Last close As at 10/08/2026
—
— 0.00 (0.00%)
Market capitalisation
—
Research: Financials
CoinShares International (CS) is a pioneer and a well-established player in the nascent, high-growth digital asset industry. The company recently introduced a dividend policy to pay out between 20% and 40% of its total comprehensive income adjusted for currency translation differences. This is underpinned by the steady income from management fees and capital market infrastructure activities, including rewards from staking digital assets, most notably Ether following the recent major upgrades to the Ethereum blockchain network.
CoinShares International |
Pursuing a transatlantic strategy in digital assets |
Company outlook |
Financials |
19 June 2024 |
Share price performance
Business description
Next events
Analyst
CoinShares International is a research client of Edison Investment Research Limited |
|||||||||||||||||||||||||||||||||||||||||||||||
CoinShares International (CS) is a pioneer and a well-established player in the nascent, high-growth digital asset industry. The company recently introduced a dividend policy to pay out between 20% and 40% of its total comprehensive income adjusted for currency translation differences. This is underpinned by the steady income from management fees and capital market infrastructure activities, including rewards from staking digital assets, most notably Ether following the recent major upgrades to the Ethereum blockchain network.
Year |
Asset management revenue (£m) |
Other gains and income (£m) |
Adjusted EBITDA* (£m) |
Adjusted |
DPS |
P/E |
Yield |
12/22 |
50.1 |
(19.6) |
(6.8) |
0.04 |
0.00 |
113.4 |
N/A |
12/23 |
43.0 |
42.3 |
57.3 |
0.54 |
0.13 |
8.1 |
2.9 |
12/24e |
85.8 |
39.4 |
83.6 |
1.21 |
0.25 |
3.8 |
5.6 |
12/25e |
91.4 |
55.6 |
99.1 |
1.47 |
0.31 |
3.1 |
6.8 |
Note: *Sum of revenue, income and gains from capital markets infrastructure and gains on principal investments less administrative expenses excluding D&A. **Diluted total comprehensive income per share attributable to the shareholders of the parent.
Digital assets have emerged as a new asset class
We believe that digital assets have become an established, distinct asset class with growing acceptance among retail and institutional investors. Bitcoin’s investment case is centred around its ‘digital gold’ status as an incorruptible, trustless, independent monetary system with a predefined currency supply based on a peer-to-peer network. The appeal of blockchains such as Ethereum is underpinned by decentralised finance as a global, open alternative to the existing financial system without the need for traditional intermediaries and in a 24/7 set-up. Finally, non-fungible tokens (NFTs) extend the technology’s use cases beyond finance and into areas such as gaming, fine art, licensing and digital identity.
Expanding into the US market
A significant milestone for the asset class was the approval of several spot bitcoin exchange traded funds (ETFs) in the US in January 2024, which subsequently attracted considerable capital (US$14.8bn net inflows to 18 June). CS has recently made forays into the US market through its newly launched Hedge Fund Solutions business, as well as the acquisition of Valkyrie Funds, which manages several investment products linked to digital assets, including a US spot bitcoin ETF. These organisational changes create an opportunity for CS to tap into the vast US capital pool through more sophisticated, actively managed investment products.
Valuation: Secular theme not fully priced in
Assuming continued digital asset adoption, we value CS at SEK88.0 per share (up from SEK82.7 previously). We assume a full write-down of CS’s stake in FlowBank, one of its major proprietary investments, given the recent opening of bankruptcy proceedings by the Swiss regulator. Despite the recent share price rally, our valuation still leaves considerable upside potential. Using a more cautious scenario with digital asset price growth at only 2% pa (ie the European Central Bank’s and Federal Reserve’s inflation target), we value CS at SEK57.5 per share.
Investment summary
Company description: A gateway to digital assets
CS is a leading European digital asset firm that provides institutional and retail investors with access to digital assets in a secure, transparent and regulated way. The company is built on a strong technology backbone (the Galata platform), which is the foundation of its two major business verticals: asset management platforms, including the passive investment products (ETPs) and ETF platform, and the capital markets infrastructure (CSCM), which is active in liquidity provisioning (for its XBT Provider products), fixed income investments, decentralised finance (DeFi) investments and proprietary trading based on low-latency delta-neutral (ie non-directional) strategies aimed at exploiting market inefficiencies. Moreover, CS is now actively involved in digital asset staking (ie locking digital assets on the blockchain to generate rewards from securing the blockchain network), both on behalf of ETP holders and from its own balance sheet. CS also recently launched its Hedge Funds Solutions business to introduce sophisticated, actively managed investment products. Consequently, the company is more than a simple beta play/proxy on the bitcoin (BTC) price, as it provides the opportunity to benefit from both overall progress in terms of digital asset adoption (and the potential accompanying increase in the market capitalisation of major cryptocurrencies) and market volatility in the sector. Importantly, an investment in CS now also offers an income component following the recent introduction of a dividend policy (as opposed to a plain vanilla BTC investment).
Valuation: Implies 46% upside potential
Our discounted cash flow (DCF) valuation implies a fair value per share of SEK88.0 (vs SEK82.7 previously), which represents 46% upside to the current share price. The upward revision comes primarily from: 1) our revised digital asset price assumptions (on the back of the recent bull run); 2) a higher assumed share of BTC in total digital asset capitalisation compared to previous assumptions (on the back of the strong inflows into spot bitcoin ETFs); and 3) a higher £/SEK exchange rate. Our valuation is supported by our expected growth in the allocation of global investment portfolios to digital assets, as well as the recent good momentum in digital asset prices. We assume that the European digital asset ETP market could grow to US$44.2bn by FY30, compared to US$8.6bn at end-2023 and US$13.7bn at end-March 2024. In the US, the recent launch of spot BTC ETFs (with spot Ether ETFs likely to follow soon) has been an important market catalyst that should pave the way for more complex digital asset products, which CS plans to introduce. Although we expect continued net outflows from CS’s legacy XBT Provider products, these should be more than offset by net inflows into other products, as well as price appreciation of major digital assets (driven by increasing global portfolio allocation to this asset class coupled with the supply constraints embedded in Bitcoin’s and Ethereum’s code).
Sensitivities: Fair value of SEK57.5 at a price growth of 2% pa
Predicting the exact prospective price path for digital assets is challenging. Consequently, we present a summary of our forecasts and valuation for CS in a scenario in which digital asset prices grow at 2% pa from the current level (ie BTC at c US$65k and Ether (ETH) at c US$3,500). In this scenario, we value CS at SEK57.5 per share. Other major sensitivities include the adoption path of digital assets, competitive pressure, regulatory risks, protocol risks of blockchain base layers and DeFi applications, and the XBT Provider Trackers’ redemption pattern.
Financials: Digital asset adoption to drive strong AUM growth
CS remains a leader in the European digital asset ETP market by AUM, holding a c 39% market share at end-March 2024, according to our estimates. This still largely comes from its legacy XBT Provider products, whose AUM we expect will decline from US$3.6bn at end-March 2024 to US$1.1bn by FY30. The net outflows from this product group should be more than offset by net inflows to other products (CoinShares Physical in particular), further supported by upward digital asset price pressure from increasing adoption. As a result, we expect CS’s AUM could be around US$14.7bn by FY30 (with a European market share of c 24%) compared to US$6.1bn at end-March 2024. We anticipate that CS will, in the long run, face pressure from declining management fees and staking yields (and potentially also lower CSCM returns as digital markets become more efficient). However, this could be offset by CS’s expansion in terms of actively managed products (which is not reflected in our cautious forecasts for now).
Exhibit 1: Edison forecast summary FY24–26e
£m unless otherwise stated |
FY21 |
FY22 |
FY23 |
FY24e |
FY25e |
FY26e |
Assets under management (US$m) |
6,075.1 |
1,863.9 |
4,151.2 |
7,023.9 |
8,224.2 |
9,622.1 |
Asset management revenue |
80.4 |
50.1 |
43.0 |
85.8 |
91.4 |
95.9 |
Gains/income from capital markets activities |
61.2 |
(17.8)* |
39.0 |
54.1 |
55.6 |
51.5 |
Administrative expenses excluding D&A |
(30.8) |
(35.1) |
(28.4) |
(41.0) |
(46.4) |
(49.6) |
Adjusted EBITDA |
121.1 |
(6.8) |
57.3 |
83.6 |
99.1 |
97.0 |
Source: CoinShares International data, Edison Investment Research. Note: Assets under management include seed assets. Further details on CS’s results are included below. *Including exceptional items of £43.9m.
Company description: A pioneer in digital assets
CS is one of the pioneers in the emerging digital assets sector (see our initiation note for details), formed in 2013 and headquartered in Jersey, with offices in London, Paris, Geneva and New York. It is a well-established player in a nascent, high-growth industry and one of the largest companies focused exclusively on digital assets and blockchain equities in Europe and globally, with total AUM of c £4.77bn at end-March 2024. It has been at the forefront of introducing innovative investment products since its inception.
The company’s backbone is its in-house technology infrastructure (the Galata platform), required to operate efficiently in markets that are open 24/7 with very fragmented liquidity across trading venues (centralised and decentralised crypto exchanges, as well as over-the-counter (OTC) markets) and also used to stay connected to traditional exchanges. CS’s focus on continuous development of its infrastructure and technology layer is a critical component of its product innovation in the fast-changing digital assets industry, which is heavily reliant on code development capabilities.
The team behind CS consists of experienced professionals from the commodities trading business. Two of its co-founders (Daniel Masters and Russell Newton) set up the specialist commodities hedge fund manager Global Advisors in 1999, leveraging their experience from, among others, JP Morgan (where Mr Masters was global head of energy trading), Royal Dutch Shell, Phibro and Salomon Brothers. Jean-Marie Mognetti, CS’s third co-founder, current CEO and a major shareholder, is a former commodities quantitative trader and joined Mr Masters and Mr Newton at Global Advisors in 2011. Global Advisors introduced the first regulated BTC hedge fund (co-managed by Mr Masters and Mr Mognetti) in April 2014.
CS’s board of directors consists of Mr Masters as non-executive chairman (he is also the largest shareholder with a 21.30% stake), Mr Mognetti and four independent non-executive directors: Christine Rankin, Johan Lundberg, Carsten Køppen and Viktor Fritzén. CS’s management team is made up of seven members (see the end of this report for details).
One-stop shop provider offering both beta and alpha
CS offers a diverse set of products, providing exposure to digital assets and blockchain equities, including both passive products (offering the ‘beta’) and actively managed ETPs (seeking to also deliver the ‘alpha’). CS’s current European product suite in its asset management vertical can be divided into three groups:
■
XBT Provider Trackers (£2,893m AUM at end-March 2024, see Exhibit 2): CS’s legacy products (launched in 2015 and 2017), which are based on synthetic replication of the underlying asset through a combination of physical digital assets (at least 75% of the exposure) and derivatives (futures and options in particular) held by CS’s subsidiary. Consequently, they share some characteristics of a structured product with counterparty risk.
■
CoinShares Physical ETPs (£932m AUM at end-March 2024): launched in 2021, the ETPs use physical replication (notes are issued only on receipt of the respective physical digital asset), with digital assets custodied by Komainu (see the ‘Principal investments’ section for details). The underlying assets are kept in bankruptcy-remote special purpose vehicles, a structure preferred by institutional investors (especially after the global financial crisis) as it removes counterparty risk.
■
Blockchain equities ETFs (£646m AUM at end-March 2024): in July 2021, CS acquired the ETF index business from Elwood Technologies, including the index creation and management activities related to the Invesco Elwood Global Blockchain Equity UCITS ETF (renamed subsequently to Invesco CoinShares Global Blockchain UCITS ETF).
Exhibit 2: Overview of CS’s current European ETP/ETF offering
Product |
Underlying asset |
AUM at end-Q124 (US$m) |
Inception date |
Mgmt fee |
Staking reward |
Trading currency |
Exchanges |
XBT Provider |
|||||||
Bitcoin Tracker One |
BTC/US$ |
1,056 |
May-2015 |
2.50% |
- |
SEK |
Sweden, Germany |
Bitcoin Tracker Euro |
BTC/US$ |
1,323 |
Oct-2015 |
2.50% |
- |
€ |
Sweden, Germany |
Ether Tracker One |
ETH/US$ |
488 |
Oct-2017 |
2.50% |
- |
SEK |
Sweden, Germany |
Ether Tracker Euro |
ETH/US$ |
810 |
Oct-2017 |
2.50% |
- |
€ |
Sweden, Germany |
CoinShares Physical |
|||||||
Bitcoin ETP |
BTC |
950 |
Jan-2021 |
0.35% |
- |
US$, €, £, CHF |
Switzerland, Germany, France, Netherlands |
Staked Ethereum ETP |
ETH |
314 |
Feb-2021 |
0.00% |
1.25% |
US$, €, CHF |
Switzerland, Germany, France, Netherlands |
Litecoin ETP |
LTC |
8 |
Apr-2021 |
1.50% |
- |
US$, €, CHF |
Switzerland, Germany |
XRP ETP |
XRP |
25 |
Apr-2021 |
1.50% |
- |
US$, €, CHF |
Switzerland, Germany |
Staked Polkadot ETP |
DOT |
11 |
Jan-2022 |
0.00% |
5.00% |
€, US$, CHF |
Switzerland, Germany |
Staked Tezos ETP |
XTZ |
5 |
Jan-2022 |
0.00% |
3.00% |
€, US$ |
Germany |
Staked Cardano ETP |
ADA |
18 |
Mar-2022 |
0.00% |
2.00% |
€ |
Germany |
Staked Solana ETP |
SOL |
280 |
Mar-2022 |
0.00% |
3.00% |
€ |
Germany |
Chainlink ETP |
LINK |
9 |
May-2022 |
1.50% |
- |
€ |
Germany |
UniSwap ETP |
UNI |
4 |
May-2022 |
1.50% |
- |
€ |
Germany |
Staked Cosmos ETP |
ATOM |
3 |
Jun-2022 |
0.00% |
5.00% |
€ |
Germany |
Staked Matic ETP |
MATIC |
9 |
Jun-2022 |
0.00% |
2.50% |
€ |
Germany |
Staked Algorand ETP |
ALGO |
13 |
Jul-2022 |
0.00% |
2.00% |
€ |
Germany |
Top 10 Crypto Market |
Multi-asset |
1 |
Mar-2023 |
0.00% |
- |
€ |
Germany |
Smart Contract Platform |
Multi-asset |
20 |
Mar-2023 |
0.00% |
- |
€ |
Germany |
Invesco CoinShares Global Blockchain UCITS ETF |
Index* |
816 |
Mar-2019 |
0.65%*** |
N/A |
US$, €, £, ILS, MXN |
UK, Germany, Switzerland, Italy, Mexico, Israel** |
Source: CoinShares data. Note: *CoinShares Blockchain Global Equity Index (BLOCK index). **The ETF also has a feeder fund in Thailand and two self-replication funds in Japan (which basically operate in a similar way to feeder funds). ***Of which 0.325% is attributable to CS.
Advanced proprietary capital markets infrastructure
The CoinShares Capital Markets (CSCM) division, which traded c US$8.8bn of notional value in 2023 (US$15bn in 2022), began as the algorithmic trading arm of Global Advisors (see above) and has been trading in spot and derivative crypto markets since 2014. CS’s infrastructure, connecting ‘analogue’ and digital finance (which now offers connectivity to more than 30 counterparties), was initially built primarily to facilitate a tight bid-ask spread and liquidity for its XBT Provider Trackers. The connectivity network and infrastructure layer that CS has developed over time allows it to deploy its algorithms to both support the asset management platform and execute a variety of trading strategies.
CS has followed a few core principles in developing its infrastructure trading division: 1) all activities should be algorithm-driven (ie minimising manual trading); 2) the technology is utilised exclusively for its own internal purposes (CS has no interest in becoming an OTC broker, although it started allowing some third parties to use its technology as a white-label solution and interact directly with their flow); and 3) CS does not carry out any directional trading but focuses on exploiting market inefficiencies through delta-neutral strategies (statistical arbitrage strategies in particular). An important recent contributor to CSCM’s results has been staking income, which we discuss in more detail below. CSCM is also active in fixed-income investments, mostly digital asset reverse repurchase agreements, with its counterparties including, for example, hedge funds and family offices. Finally, it is also exploring opportunities in the DeFi space, mostly as a lender in decentralised lending protocols, though it has no meaningful investment in this area at present.
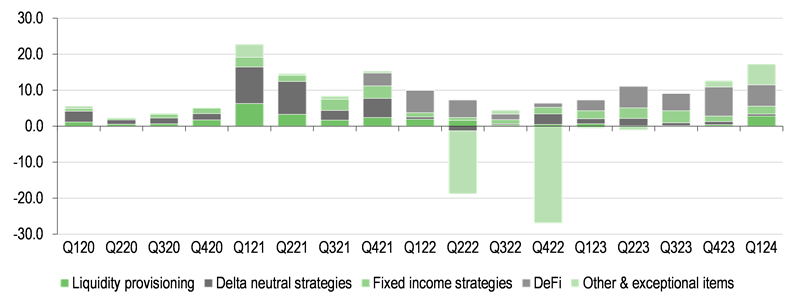
CSCM generated a profit throughout FY18 to FY23 during both bull markets (2020–21, 2023, see Exhibit 3,) and the 2018 bear market, while its FY22 results were burdened by two one-off events: the failure of the TerraUSD-LUNA protocol in May 2022 (see our June 2022 note for details) and the bankruptcy of FTX in November 2022 (see our November 2022 note for details). Here, we note that CS may recover most or even all of the funds lost in the FTX fraud, given that the bankruptcy lawyers for the FTX bankruptcy estate recently stated that they expect all customers and creditors to be paid in full.
|
Exhibit 3: CS’s capital market infrastructure income and gains (£m) |
|
|
Source: CoinShares International data |
Making forays into the US market
The acquisition of Valkyrie Funds, together with CS’s decision in September 2023 to enter the North American market with its recently launched Hedge Fund Solutions business, illustrate the company’s ambition to become a global player in the digital asset management industry.
On 12 March 2024, CS finalised the takeover of Valkyrie Funds, the investment advisory business of US digital asset manager Valkyrie Investments. The consideration paid for the business did not include any material cash component and primarily involved an earn-out based on the bottom-line performance of the business’s North American activities over the next three years. CS’s management highlighted that the acquisition provides the company with an opportunity to enhance its risk, compliance, trading and distribution operating model. It believes that a successful integration of Valkyrie Funds is key to unlocking CS’s ability to be competitive in terms of global requests for investment.
US spot bitcoin ETFs approval is a major industry milestone
Valkyrie manages several US-domiciled products that complement CS’s European product offering. First, the Valkyrie Bitcoin Fund (ticker BRRR), to which CS acquired the sponsor rights, was among the spot bitcoin ETFs approved by the US Securities and Exchange Commission (SEC) in January this year, with trading commencing on 11 January. The SEC approval has been a major milestone for the digital asset industry on its path to institutional adoption. Spot bitcoin ETFs had a very good start, attracting net flows of US$14.8bn to 18 June 2024 even after accounting for the US$18.3bn of net outflows from the Grayscale Bitcoin Trust (ticker GBTC, which converted its existing bitcoin trust into a spot ETF), according to Bloomberg data. The GBTC outflows were likely due to: 1) profit taking, as some investors held on to their GBTC units (which had traded at a discount to NAV during the recent ‘crypto winter’); 2) the sale of significant holdings in GBTC of the bankrupt exchange FTX; and 3) some rotation out of the higher-cost GBTC into other bitcoin spot ETFs.
We believe that, despite the healthy inflows into US spot bitcoin ETFs witnessed so far, they are still at an early stage of adoption. Many of the large wealth management platforms and registered investment advisers are likely still in the product due diligence phase. Furthermore, we note the recent SEC approvals of the 19b-4 forms filed by issuers seeking to launch spot Ether ETFs, which is an important step towards allowing the trading of these products in the US. Analysts at Bernstein recently highlighted that they expect the BTC and Ether ETFs market to grow to US$450bn in the next two years, fuelled by net inflows of US$100bn and price appreciation (they expect the price of BTC to reach US$150k by end-2025, visibly above our current assumption of US$78,700).
BRRR is one of the smaller players at present, with c US$539m AUM at 18 June 2024 (after attracting c US$497m of net inflows). This compares with close to US$20.0bn for BlackRock’s iShares Bitcoin Trust (ticker: IBIT) and US$18.0bn GBTC (see Exhibit 4). BRRR charges a low fee of 0.25% pa, broadly in line with most competitors, which, except for the largest players by AUM, means that the products are unprofitable. Therefore, CS expects BRRR to be a brand-building tool and ‘door opener’ rather than a significant profit contributor (the company intends to run the product at break-even).
|
Exhibit 4: Assets under management of US spot bitcoin ETFs |
|
|
Source: Bloomberg as at 18 June 2024 |
Moreover, Valkyrie manages: 1) the Valkyrie Bitcoin Miners ETF, investing in listed digital asset mining equities, 2) an actively managed Valkyrie Bitcoin and Ethereum Strategy ETF (which invests in CME futures on BTC and ETH) and 3) the recently launched Bitcoin Futures Leveraged Strategy ETF, which aims to deliver twice the performance of the S&P CME Bitcoin Futures Excess Return Index (see Exhibit 5). Given that BRRR’s management fee likely broadly covers its direct costs (custody and trading fees), and that the other three products have a modest AUM at present, we do not expect any meaningful bottom-line contribution from the Valkyrie Funds acquisition in the short term.
Exhibit 5: Overview of Valkyrie’s current product offering
Product |
Underlying asset |
AUM at end-Q124 (US$m) |
Inception date |
Total expense ratio |
The Valkyrie Bitcoin Fund |
BTC |
543 |
Jan-2024 |
0.25%* |
The Valkyrie Bitcoin Miners ETF |
Blockchain equities |
101 |
Feb-2022 |
0.75% |
The Valkyrie Bitcoin and Ether Strategy ETF |
Bitcoin and Ether futures |
57 |
Oct-2021 |
1.24% |
The Valkyrie Bitcoin Futures Leveraged Strategy ETF |
Bitcoin futures |
49 |
Feb-2024 |
1.85% |
Source: Valkyrie Funds data. Note: *Sponsor fee.
Hedge Fund Solutions: Advanced, niche products
While the vast majority of CS’s existing AUM is attributable to single-asset, passive BTC and Ether ETPs, CS’s strategic objective (which we support) is to launch more sophisticated, niche, actively managed products (which will be more profitable), leveraging CS’s experience in structuring investment products and quantitative trading skills, as well as Valkyrie’s actively managed ETF platform. The development of these products is carried out by CS’s Hedge Fund Solutions business, which was launched in September 2023 and attracted its first external limited partners in Q423. Within this business unit, tech specialists, quants and traders deploy CS’s existing, well-tested trading strategies (carried out in its CSCM division) within fund structures, and also develop new strategies with the aim to build a performance track record from 2024 onwards.
Upon the launch of the vertical, CS introduced the Bitcoin and Ethereum Integrated Strategies Funds for professional/accredited investors, which aim to outperform their respective benchmarks by 20% annually. They deploy multiple strategies, including call overwrite, quantitative and arbitrage. The Ethereum fund also deploys a staking strategy (which is used especially during periods of low volatility and in a bearish market trend). They are both eligible for general solicitation (also in the US), so they can be marketed to a wide audience.
CS’s management acknowledges growing the US footprint of the Hedge Fund Solutions vertical will be a multi-year process of establishing an audited track record. Activities in the current year will be centred around refining operations and the product offering and attracting further external limited partners. CS’s strategy of growing through more sophisticated ‘hedge fund-like’ products (which are easily accessible given their regulated, listed status) is underpinned by the company’s strong technological backbone, discussed above. To drive the scalability and efficiency of Hedge Fund Solutions and CS’s capital markets infrastructure divisions, as well as support its risk management capabilities, CS is investing in a new trading platform, which it intends to migrate to in 2024.
Principal investments: Investing in the ecosystem
CS also invests from its own balance sheet in early-stage technology companies and channels to facilitate the distribution of its products and services, which were valued at £46.5m at end-March 2024. It also holds some minor proprietary investments in digital assets and other receivables, worth £8.7m at end-March 2024. Its major holdings at the end of Q124 included:
■
FlowBank – a Swiss-based online neo bank launched in Q121, which offered a wide range of financial products such as stocks, bonds, commodities, ETFs, forex and contracts for differences to both retail and institutional clients on its investment platform. On 13 June 2024, FINMA (the Swiss financial markets regulator) opened bankruptcy proceedings against FlowBank. This move was due to the bank no longer meeting the minimum capital requirements for its business operations, and also in light of concerns that the bank may be overindebted. CS holds a 26.75% stake, which is accounted for using the equity method and was valued at £21.8m at end-March 2024. We assume a full write-down of the stake in CS’s Q224 results.
■
Komainu (carrying value of £11.0m at end-March 2024) – a digital asset custodian regulated by the Jersey Financial Services Commission and established in 2018 as a joint venture between CS, Ledger (a digital asset security specialist and a top player in custody hardware) and Japanese investment bank Nomura.
■
WAO Fintech (carrying value of £3.8m at end-March 2024) – a residual holding following the merger of the US retirement account provider Choice Fintech (which CS had invested in) with WAO at the beginning of 2024.
■
3iQ (carrying value of £4.4m at end-March 2024) – a leading Canadian digital assets manager founded in 2012. CS recently sold its entire stake in the business to the Japan-based brokerage firm Monex Group, as CS’s management considered the price offered to be very attractive (9x revenue vs CS’s current valuation of c 7x its FY23 topline, which excludes its CSCM income and gains). CS realised a solid profit on the transaction (collecting £4m of cash proceeds compared to the cost of initial investment at £1.6m), and has also benefited from trading opportunities arising from the investment in 3iQ in recent years. Another reason for the disposal was developments in the US market, which, according to CS, made the Canadian digital asset market look less attractive.
Riding the secular adoption theme
Digital assets are increasingly becoming an established, distinct asset class, with growing adoption across both retail and institutional investors. Therefore, we expect an increase in the global portfolio allocation to digital assets, assuming 2.5% on average by 2030 (vs 1.3% at end-March 2024), unchanged versus our previous assumptions. We further assume that 4% of this allocation in Europe will be through ETPs, above the c 1.5% current share of gold ETFs in the global gold market capitalisation, given the complexity associated with storing, trading and reporting digital asset investments, as well as the fact that a meaningful part of physical gold investments is held by central banks. As a result, we now expect the AUM of Western European digital asset ETPs to grow to US$44.2bn (see Exhibit 6) compared to c US$8.6bn and US$13.7bn at end-2023 and end-March 2024, respectively (according to our estimates). This represents a downward revision from the US$50.4bn we assumed in our March 2023 outlook note, with the reduction coming exclusively from the lower forecast financial assets in the region, as per Boston Consulting Group’s Global Wealth Report 2023 compared to the 2022 edition.
Exhibit 6: Assumptions of digital assets allocation globally and in Western Europe
US$tn unless otherwise stated |
2021 |
2022 |
2023 |
2024e |
2025e |
2026e |
2027e |
2028e |
2029e |
2030e |
Financial assets excluding currency and deposits |
197.1 |
182.9 |
192.5 |
202.6 |
213.3 |
224.5 |
236.4 |
248.8 |
261.9 |
275.7 |
Digital assets allocation (%)* |
1.1% |
0.4% |
0.8% |
1.4% |
1.6% |
1.8% |
2.0% |
2.2% |
2.3% |
2.5% |
Digital assets allocation (global)* |
2.1 |
0.7 |
1.5 |
2.8 |
3.4 |
4.0 |
4.7 |
5.4 |
6.1 |
6.9 |
Financial assets excluding currency and deposits |
35.6 |
32.7 |
34.0 |
35.3 |
36.6 |
38.0 |
39.5 |
41.0 |
42.6 |
44.2 |
Digital assets allocation (%)** |
1.1% |
0.4% |
0.8% |
1.4% |
1.6% |
1.7% |
1.9% |
2.1% |
2.3% |
2.5% |
Digital assets allocation (Western Europe)** |
0.4 |
0.1 |
0.3 |
0.5 |
0.6 |
0.7 |
0.8 |
0.9 |
1.0 |
1.1 |
% of allocation to ETPs |
2.6% |
2.3% |
3.2% |
3.2% |
3.4% |
3.7% |
4.0% |
4.0% |
4.0% |
4.0% |
AUM of Western European crypto ETPs (US$bn) |
9.7 |
3.1 |
8.6 |
15.6 |
20.2 |
24.8 |
30.2 |
34.3 |
39.0 |
44.2 |
Source: Edison Investment Research. Note: *Adjusted for the value of lost BTC (3m coins according to Glassnode estimates). **Assuming allocation in line with global allocation.
We note that BTC’s inherent scarcity is pre-defined in its code, with new supply diminishing over time as a result of halving events (see our Edison Explains piece for details). Moreover, recent upgrades to the Ethereum network also translated into increased scarcity of ETH (see below for details). Therefore, any increase in the allocation of global investment portfolios to these two assets (which currently represent around 70% of the total market capitalisation of digital assets) would largely have to be realised through price appreciation. If we assume: 1) global digital assets allocation of US$6.9tn by FY30 (as per Exhibit 6 above), 2) BTC and ETH dominance of c 50% and 23%, respectively (vs c 54% and 18% currently) and 3) the pre-defined BTC supply evolution and broadly stable ETH supply, we arrive at BTC and ETH prices of around US$169k and US$13,200, respectively (vs the current spot prices of c US$65k and US$3,500, respectively). This compares to our previous assumptions for BTC and ETH of US$119k and US$13k, respectively, with the higher BTC price assumption stemming from a higher market share assumption (previously 36%) following the strong inflows into US spot bitcoin ETFs.
Retaining its leadership position in Europe
CS is still by far the largest European digital asset ETP issuer, with a c 39% market share by AUM at end-March 2024, according to our estimates (see Exhibit 7). This represents a decline from 44% at end-2022 and c 50% at end-2021, which was due to continued redemptions of CS’s legacy XBT Provider units, translating into net outflows of US$446m in 2022 and US$125m in 2023 (and a further US$238m in Q124). We consider profit taking from early investors as the main driver behind these outflows. Meanwhile, the CoinShares Physical product suite (launched in early 2021) attracted more than US$140m of net inflows in 2022 and US$213m in 2023.
CS’s blockchain equity ETF business represented AUM of US$801m at 5 April 2024, positioning it as the leader in ETFs with exposure to blockchain companies, with the second player having AUM of c US$702m, according to CS’s weekly funds flow report.
|
Exhibit 7: AUM of major European issuers of digital asset ETPs at end-March 2024 (US$bn) |
Exhibit 8: AUM of major US and European ETFs with exposure to blockchain companies at 5 April 2024 (US$m) |
|
|
|
Source: CoinShares data, Bloomberg. Note: *At 22 February 2024. |
Source: CoinShares Digital Asset Fund Flows Weekly |
|
Exhibit 7: AUM of major European issuers of digital asset ETPs at end-March 2024 (US$bn) |
|
|
Source: CoinShares data, Bloomberg. Note: *At 22 February 2024. |
|
Exhibit 8: AUM of major US and European ETFs with exposure to blockchain companies at 5 April 2024 (US$m) |
|
|
Source: CoinShares Digital Asset Fund Flows Weekly |
Legacy product outflows to be offset by other products and price action
We forecast CS’s total AUM to grow from c £4.8bn (c US$6.1bn) at end-March 2024 to £11.6bn (US$14.7bn) by FY30e (see Exhibit 9), as we expect the net outflows from the legacy XBT Provider products to be offset by inflows into other products (CoinShares Physical, the Invesco CoinShares Global Blockchain UCITS ETF (BLOCK index), products managed by Valkyrie Funds) and digital assets price appreciation. XBT Provider Trackers may be considered legacy products given that: 1) they have synthetic backing from a combination of physical digital assets and derivatives giving rise to increased counterparty risk; and 2) they are subject to a quite high 2.5% fee. That said, we note that the products maintain a strong position among retail investors in the Nordics, while outflows are dominated by professional and US-based investors. The high demand from local retail investors may be due to XBT Provider’s strong local brand and its long track record, as well as the fact that it is available in the local currency (Swedish krona).
We expect that CS’s transition away from the legacy products will reduce the company’s European market share to c 24% by FY30e. We assume net outflows from XBT Provider products of US$768m in FY24e and US$644m in FY25e and expect the AUM to decline from US$3.4bn at end-March 2024 to US$1.1bn (or c 11% of CS’s total AUM) by FY30e.
Meanwhile, we forecast the AUM of CoinShares Physical to increase from c US$1.7bn at end-March 2024 to US$9.2bn by FY30e, primarily driven by its two flagship products (CoinShares Physical Bitcoin ETP and CoinShares Physical Staked Ethereum ETP), but also by growing penetration of other single-asset ETPs, as well as multi-asset products. The CoinShares Physical Bitcoin ETP saw US$51m of net outflows in Q124, which CS management believes was due to hedge funds exiting a popular long European ETP/short CME futures trade. Therefore, we assume that this was a one-off event – in Q224 so far, the product had around US$47m of net inflows. We assume US$187m net inflows into CoinShares Physical BTC and ETH products in FY24e, followed by US$354m in FY25e.
We expect the existing Valkyrie Funds ETFs to gradually grow in terms of AUM from c US$750m at end-March 2024 to US$2.3bn by end-FY30e. Finally, we cautiously assume no meaningful external inflows into the products offered by the Hedge Fund Solutions business, though we see upside potential in the case of CS’s successful expansion in the US. Here, we note that the growth in AUM may not be as smooth as assumed in our forecasts due to the inherent high volatility in digital asset prices.
|
Exhibit 9: CS’s historical and forecast AUM growth (US$m) |
|
|
Source: CoinShares International data, Edison Investment Research |
Fees on plain vanilla ETPs going down
In response to the launch of spot bitcoin ETFs in the US, CS reduced the management fee on its CoinShares Physical Bitcoin ETP from 0.98% to 0.35% pa (effective from 1 February 2024), which is visibly below some of the major competing products in Europe (see Exhibit 10). For instance, ETC Group’s Physical Bitcoin ETP charges 2.00% pa, while the 21Shares Bitcoin ETP charges 1.49% pa, though we note that WisdomTree and Invesco made a similar move to CS and now charge 0.35% and 0.39%, respectively, on their Bitcoin ETPs. 21Shares also offers a lower-fee Bitcoin Core ETP (0.21% pa), but we note that the structure of this product allows for lending out the BTC held as collateral (which exposes the unit holders to a certain degree of counterparty risk). Moreover, the new fee on the CoinShares Physical Bitcoin ETP is now only moderately above the fee for the recently approved US spot bitcoin ETFs (0.19–0.30% pa, except for the Grayscale Bitcoin Trust, which charges 1.50%). We note that the management fee on the XBT Provider Bitcoin Trackers remains at the high level of 2.5%. CS’s move to reduce the fee on its CoinShares Physical Bitcoin ETP is in line with our expectations (discussed in our initiation note) that as single-asset BTC and ETH ETPs become more commoditised products, their management fees should gravitate towards levels common for precious metals ETPs at c 0.00–0.40% for most major providers.
We also note that from 1 February 2023, CS introduced a 0% fee on its CoinShares Physical Ethereum ETP to accumulate further AUM while it worked on introducing a mechanism to pass on some of the staking rewards to unit holders. Eventually, it implemented a staking reward of 1.25% pa effective from 1 February 2024, with any excess reward earned on the staked ETH being an income to CS (see below for details on CS’s staking income). We believe that it is the only major Ethereum ETP in Europe that offers such an attractive combination of zero fees and transparent staking rewards. Products of some competitors (eg 21Shares and VanEck) also offer a staking yield, but at the same time charge a management fee. Most of CS’s other single-asset European ETPs also provide exposure to native tokens of proof-of-stake blockchains, and currently offer staking yields ranging from 2.0% to 5.0% and a 0% management fee. The fee on the XBT Provider Ether Trackers remains unchanged at 2.5%. The management fee on the BLOCK index stands at 0.65%, half of which goes to CS.
|
Exhibit 10: Comparison of major European BTC ETPs |
Exhibit 11: Comparison of major European Ether ETPs |
|
|
|
Source: CoinShares data, Edison Investment Research. Note: *White-label solution from HanETF. **Data for 21Shares Bitcoin ETP; the 21Shares Bitcoin Core ETP (which can participate in yield generation from collateralised lending) charges 0.21% and had US$82.9m of AUM at end-March 2024. |
Source: CoinShares data, Edison Investment Research. Note: *Data for 21Shares Ethereum Staking ETP; the 21Shares Ethereum Core ETP (which can participate in yield generation from collateralised lending) charges 0.21% and had US$14.4m of AUM at end-March 2024. **White-label solution from HanETF. |
|
Exhibit 10: Comparison of major European BTC ETPs |
|
|
Source: CoinShares data, Edison Investment Research. Note: *White-label solution from HanETF. **Data for 21Shares Bitcoin ETP; the 21Shares Bitcoin Core ETP (which can participate in yield generation from collateralised lending) charges 0.21% and had US$82.9m of AUM at end-March 2024. |
|
Exhibit 11: Comparison of major European Ether ETPs |
|
|
Source: CoinShares data, Edison Investment Research. Note: *Data for 21Shares Ethereum Staking ETP; the 21Shares Ethereum Core ETP (which can participate in yield generation from collateralised lending) charges 0.21% and had US$14.4m of AUM at end-March 2024. **White-label solution from HanETF. |
Staking income has become an important driver
Significant upgrades to the Ethereum network in recent years
The Ethereum blockchain network has witnessed significant technological advancements in recent years. This includes ‘The Merge’, a long-awaited, major upgrade (completed in September 2022) that involved the move from an energy-intensive proof-of-work consensus algorithm (based on the activity of ‘miners’ who compete with their computing power for block rewards, a process similar to Bitcoin’s consensus algorithm) to a proof-of-stake (PoS) consensus mechanism, where rewards are proportional to the amount of ETH staked (ie locked up as a kind of collateral) to secure the network by the validators. Furthermore, the Shanghai (Shapella) upgrade, completed in April 2023, enabled the un-staking (withdrawal) of staked ETH. Finally, the Dencun upgrade (completed in March 2024) was aimed at driving the scalability of the Ethereum network and included a cost reduction for so-called layer-2 solutions (ie built on top of the base blockchain network).
Several benefits of the move to PoS
The transition to PoS has vastly reduced the energy consumption of the Ethereum network (by c 99.99%), which may be appealing to investors cautious of the use of energy and the carbon footprint of blockchain networks. Moreover, ‘The Merge’ also significantly reduced the new issuance of ETH and, together with the introduction of a process of ‘burning’ (ie cancelling) ETH spent on transaction fees on the network (following the implementation of the EIP-1559 upgrade in 2021), it translated into a slight deflationary trend in total ETH supply, which has declined by 0.3% since September 2022 to date. Here, we note that the total revenue (transaction fees) generated by the Ethereum network amounted to just over US$2bn in 2023, according to Grayscale.
Ether now offers a regular income stream
The upgrades allow ETH holders to generate a steady income from staking rewards. Staking income from native tokens of PoS blockchains (including Ethereum) has become an important earnings contributor for CS. The staking rewards in excess of those distributed to CoinShares Physical ETP holders were the main contributor to the year-on-year increase in revenue from CoinShares Physical products in Q124 to £3.3m, versus £0.6m in Q123. Moreover, CS booked around £5.9m of staking rewards in the CSCM division by deploying its own capital, including part of the funds used as collateral for the XBT Provider Ether products. The current staking yield as per CoinDesk’s Composite Ether Staking Rate stands at c 3.19% at 17 June 2024, which is broadly in line with end-2023 (3.40%), but represents a decline from c 5% in September 2022.
Ethereum staking rewards consist of consensus rewards and transaction fees. The yield arising from the latter component is usually much lower (0.37% at 17 June 2024), but is quite volatile as it depends on the level of network activity (or more precisely, the level of so-called priority tip rewards and maximal extractable value rewards) and historically has seen temporary, short-term spikes to levels as high as 3–4%. Consensus rewards are more stable in the short term but are inversely correlated with the proportion of ETH staked on the network, which has been steadily rising from c 14.6m (or c 12% of total supply) in September 2022 to c 33.1m (28%) as at 17 June 2024. This was accompanied by a decline in the consensus rewards yield from c 4.00% to 2.82%.
We conservatively assume a gradual decline of total ETH staking yields to c 2% until FY30e due to further growth in the amount of ETH staked amid increased interest from both retail and institutional investors in the steady income stream offered by staking, and as re-staking/liquid staking solutions such as Lido or EigenLayer become more popular. Upside risks to this assumption include a significant increase in network activity (which would drive transaction fees), as well as greater investor demand for investment opportunities across DeFi on Ethereum, which are more difficult/risky to access through re-staking.
Asset management revenue forecasts
Based on the above-mentioned assumptions with respect to AUM growth, fee income and excess staking rewards, we forecast an increase in CS’s asset management revenue from £43.0m in FY23 to £85.8m in FY24e. Subsequently, we arrive at an initial single-digit percentage growth in FY25–27e, followed by a top-line decline driven by a further fall in the average management fee rate and staking yield, despite the growth in AUM. That said, we note that these factors may be offset if CS manages to significantly expand in the actively managed product category beyond our current conservative assumptions.
|
Exhibit 12: CS’s historical and forecast asset management revenue |
|
|
Source: CoinShares data, Edison Investment Research |
CSCM gains and income forecast
We expect CSCM to continue delivering solid income and gains in the coming years, with ETH staking being an important contributor. That said, we expect the latter to gradually decline as the ETH staking yield compresses and the AUM of XBT Provider diminishes. We assume that the lower staking rewards will be partly offset by a pick-up in gains on CS’s delta neutral and fixed income strategies, as well as some income on DeFi activity. We assume that the average return generated by CSCM will become more moderate in the long run as digital asset markets mature and in turn become more efficient.
Exhibit 13: Income and gains – CS’s capital markets business
£m |
FY20 |
FY21 |
FY22 |
FY23 |
FY24e |
FY25e |
FY26e |
FY27e |
FY28e |
FY29e |
FY30e |
Liquidity provisioning |
4.2 |
13.8 |
4.5 |
1.4 |
6.9 |
5.6 |
5.5 |
4.8 |
4.2 |
3.4 |
3.1 |
Delta neutral strategies |
7.6 |
27.2 |
2.6 |
5.0 |
3.1 |
5.6 |
5.6 |
7.1 |
8.8 |
11.0 |
13.8 |
Fixed income activities |
3.8 |
10.9 |
5.0 |
10.1 |
8.8 |
9.7 |
9.7 |
11.2 |
12.8 |
14.8 |
17.0 |
Staking/DeFi |
0.0 |
3.6 |
13.9 |
21.9 |
29.4 |
34.6 |
30.7 |
27.4 |
23.9 |
19.2 |
15.1 |
Other & exceptional items |
1.3 |
5.8 |
(43.3) |
0.2 |
5.8 |
0.0 |
0.0 |
0.0 |
0.0 |
0.0 |
0.0 |
Total |
16.8 |
61.2 |
(17.4) |
38.6 |
54.1 |
55.6 |
51.5 |
50.4 |
49.7 |
48.4 |
48.9 |
Source: CoinShares data, Edison Investment Research
Dividends
At the Q423 results announcement, the company introduced a dividend policy that aims to pay out between 20% and 40% of its total comprehensive income adjusted for currency translation differences. Payments will be made in Swedish krona in four quarterly instalments, subject to an assessment by CS’s board of the financial health and cash requirements of the company prior to each payment. Dividends will primarily be in the form of distributions to shareholders and the company does not expect to launch another buyback programme beyond the last one (completed on 30 May 2024).
We currently assume a dividend payment from FY24e earnings of £0.25 per share (representing a 20% payout ratio), which implies a healthy 5.6% yield on the current share price. CS may be encouraged to increase the payout ratio in case of 1) successful recovery of the FTX claim and 2) high cash inflow of accrued XBT Provider fees released upon unit redemptions.
Financials
Income statement shaped by digital assets accounting
CS’s financial statements are influenced by the current accounting treatment of digital assets as intangible assets under IFRS. CS records digital assets (including those held to hedge its liability to ETP investors) under current assets as a separate line item, held at fair value through the revaluation model. Consequently, unrealised gains and losses on these holdings arising from the movements in digital asset prices are recognised within other comprehensive income (unless reversing previously recognised gains). At the same time, changes in the value of CS’s liability to its ETP holders is recognised as an income or expense within the P&L. This also applies to non-leveraged, digital asset-backed products such as ETPs used to hedge the liability related to XBT Provider products. The above accounting policies significantly distort CS’s reported net income. Therefore, we consider CS’s adjusted EBITDA and total comprehensive income as more meaningful performance measures, as these reflect the movements in the value of both digital assets and the liability to ETP holders (see Exhibit 14).
Exhibit 14: Summary of key items from CS’s statement of comprehensive income
£m, unless otherwise stated |
FY18* |
FY19* |
FY20* |
FY21 |
FY22 |
FY23 |
Asset management revenue |
10.5 |
11.3 |
18.4 |
80.4 |
50.1 |
43.0 |
Capital market infrastructure income/gains, of which: |
14.4 |
9.4 |
16.8 |
61.2 |
26.1 |
39.0 |
Liquidity provisioning |
8.2 |
2.3 |
4.2 |
13.8 |
4.5 |
1.4 |
Delta neutral trading strategies |
0.7 |
5.4 |
7.6 |
27.2 |
2.6 |
5.0 |
Fixed income activities |
0.6 |
0.9 |
3.8 |
10.9 |
5.0 |
10.1 |
DeFi |
- |
- |
- |
3.6 |
13.9 |
20.4 |
Other |
4.8 |
0.8 |
1.3 |
5.8 |
0.4 |
2.0 |
Principal investment gains/(losses) |
(1.1) |
(0.4) |
1.0 |
9.9 |
(4.9) |
3.7 |
Administrative expenses excl. D&A |
(10.9) |
(9.1) |
(14.1) |
(30.8) |
(78.9)** |
(28.4) |
Adjusted EBITDA |
13.0 |
11.2 |
22.1 |
121.1 |
(6.8) |
57.3 |
Adjusted EBITDA margin |
54% |
55% |
61% |
80% |
-9% |
67% |
Depreciation and amortisation |
(0.0) |
(0.2) |
(0.2) |
(1.3) |
(2.9) |
(3.2) |
Finance expense |
(0.1) |
(0.4) |
(1.2) |
(7.0) |
(6.3) |
(6.9) |
Income taxes |
(0.2) |
(0.3) |
(0.4) |
(1.1) |
(0.4) |
(0.6) |
Currency translation differences |
1.8 |
(1.4) |
(1.9) |
1.8 |
19.3 |
(8.2) |
Total comprehensive income |
14.4 |
8.9 |
18.4 |
113.4 |
2.9 |
38.4 |
Source: CoinShares data. Note: *Prepared in accordance with FRS 102 (the financial reporting standard applicable in the UK and Republic of Ireland). FY21–23 prepared in accordance with IFRS. **Including exceptional items of £43.9m.
Valuation
We value the company’s shares using a DCF approach (Exhibit 15). Given that we are in the initial stage of digital assets adoption, we have applied an extended detailed forecast horizon to FY30e. We have used CS’s approach to calculating adjusted EBITDA, but for the purposes of our valuation we remove any income and gains in CSCM arising from earlier income/gains recycled back into the trading activity (in order to avoid double-counting of cash flows). Our DCF is sensitive to the change in working capital associated with accrued management fees on the XBT Provider Trackers (see our initiation note for details).
We have applied a weighted average cost of capital (WACC) of 13.3% based on a capital asset pricing model, with an additional 50% premium applied to account for the sensitivity of our forecasts to the price movements of digital assets, as well as risks to our digital asset adoption scenario. We further assume a 2.0% residual growth rate. We account for CS’s principal investments (including digital assets) in line with the last reported fair value at end-March 2024 of £47.7m but after applying a full write-down of CS’s stake in FlowBank, which brings the value of the principal portfolio to £23.1m. Conservatively, we have not pencilled in any gains on principal investments. As a result, we arrive at a fair value per share of SEK88.0, which implies 46% upside potential to the current share price. This represents an increase from SEK82.7 previously, mostly due to 1) our revised digital asset price assumptions (on the back of the recent bull run), 2) a higher assumed share of BTC in total digital asset capitalisation compared to previous assumptions (on the back of the strong inflows into spot bitcoin ETFs) and 3) a higher £/SEK exchange rate. Moreover, we now include the full amount of the FTX claim of around £27m (discounted by a year). Exhibit 16 shows our valuation sensitivity to different WACC assumptions. We have not identified any close listed comparators for CS for which complete consensus figures are available.
Exhibit 15: CS’s DCF valuation model
£m, unless otherwise stated |
Q2–Q424e |
FY25e |
FY26e |
FY27e |
FY28e |
FY29e |
FY30e |
EBITDA* |
72.4 |
100.8 |
98.6 |
97.8 |
93.5 |
83.2 |
73.9 |
Interest expense |
(4.5) |
(5.1) |
(5.9) |
(6.9) |
(8.0) |
(8.8) |
(9.2) |
CSCM income/gains adjustment |
(4.7) |
(21.0) |
(24.4) |
(26.2) |
(27.4) |
(27.9) |
(29.8) |
Income taxes |
(0.7) |
(1.0) |
(1.0) |
(0.9) |
(0.9) |
(0.8) |
(0.7) |
Change in working capital |
(27.0) |
(27.7) |
(8.2) |
7.3 |
31.9 |
58.6 |
64.1 |
Capex |
(2.4) |
(2.5) |
(2.5) |
(2.6) |
(2.7) |
(2.8) |
(2.8) |
Free cash flow to firm (FCFF) |
33.2 |
43.5 |
56.7 |
68.4 |
86.4 |
101.6 |
95.5 |
Discounted FCFF |
30.2 |
35.0 |
40.1 |
42.8 |
47.7 |
49.4 |
41.0 |
WACC |
13.3% |
|
|
|
|
|
|
Residual growth rate |
2.0% |
|
|
|
|
|
|
Sum of DFCFF |
286.2 |
|
|
|
|
|
|
Residual value |
95.8 |
|
|
|
|
|
|
Principal investments |
23.1 |
|
|
|
|
|
|
Digital assets |
2.8 |
|
|
|
|
|
|
FTX claim |
23.8 |
||||||
Enterprise value |
431.8 |
|
|
|
|
|
|
Net debt/(cash) at end-March 2024 |
(15.4) |
|
|
|
|
|
|
Equity value |
447.2 |
|
|
|
|
|
|
Share count (fully diluted) |
71.3 |
|
|
|
|
|
|
Fair value per share (£) |
6.3 |
|
|
|
|
|
|
£/SEK |
13.3 |
|
|
|
|
|
|
Fair value per share (SEK) |
88.0 |
|
|
|
|
|
|
Current share price (SEK) |
60.2 |
|
|
|
|
|
|
Upside/(downside) |
46% |
|
|
|
|
|
|
Source: CoinShares data, Edison Investment Research. Note: *Adjusted for non-cash share-based payments, Q2–Q424 excludes the FlowBank write-off which is accounted for in the principal investments line.
Exhibit 16: CS’s valuation sensitivity to WACC assumption
WACC |
10.3% |
11.3% |
12.3% |
13.3% |
14.3% |
15.3% |
16.3% |
Fair value per share (SEK) |
105.3 |
98.6 |
93.0 |
88.0 |
84.0 |
80.3 |
77.1 |
Source: Edison Investment Research
Sensitivities
Digital asset prices
Our base case valuation of CS remains conditional on a continued increase in average portfolio allocations to digital assets in the coming years as the asset class establishes itself as an inherent (even if small) part of many diversified portfolios. Given the limited supply of new digital assets (BTC and ETH in particular), we expect the above to translate into a visible increase in digital asset prices (our model implies BTC and ETH prices of c US$169k and US$13,200, respectively, by 2030).
Having said that, digital asset are very hard to value (as discussed in our Edison Explains piece) and it is difficult to gauge the extent to which the value of a blockchain network should be reflected in the market capitalisation of its native token. Hence, predicting the exact prospective price path for digital assets is quite challenging. Consequently, we present a summary of our forecasts and valuation for CS in a scenario in which digital asset prices grow in line with the European Central Bank’s and the Federal Reserve’s inflation target of 2% from the current level (ie BTC at c US$65k and ET at c US$3,500). In this more cautious scenario, we value CS at SEK57.5 per share. In Exhibit 17, we present a summary of our forecasts assuming stable digital asset prices.
Exhibit 17: Summary forecasts in a 2% pa price growth scenario
£m unless otherwise stated |
FY20 |
FY21 |
FY22 |
FY23 |
FY24e |
FY25e |
FY26e |
FY27e |
FY28e |
FY29e |
FY30e |
Digital assets allocation (%) |
0.4% |
1.1% |
0.4% |
0.8% |
1.4% |
1.2% |
1.1% |
1.1% |
1.0% |
1.0% |
1.0% |
Digital assets allocation (US$tn) |
0.67 |
2.11 |
0.7 |
1.5 |
2.8 |
2.5 |
2.5 |
2.6 |
2.6 |
2.7 |
2.7 |
CoinShares total AUM |
2,317 |
6,075 |
1,864 |
4,151 |
6,107 |
5,402 |
5,711 |
5,989 |
6,096 |
5,995 |
6,343 |
Fee revenue |
18.4 |
80.8 |
51.5 |
43.5 |
87.9 |
78.6 |
66.2 |
61.3 |
54.6 |
45.9 |
38.7 |
CSCM income/gains |
16.8 |
61.2 |
(17.4) |
38.6 |
53.2 |
50.2 |
41.4 |
39.8 |
39.5 |
40.3 |
42.7 |
Administrative expenses excluding D&A |
(14.1) |
(30.8) |
(35.3) |
(28.8) |
(43.6) |
(41.6) |
(40.9) |
(40.9) |
(41.4) |
(41.7) |
(42.1) |
Adjusted EBITDA |
22.1 |
121.1 |
(6.5) |
56.9 |
82.3 |
86.0 |
66.2 |
59.6 |
51.9 |
43.8 |
38.6 |
Source: CoinShares data, Edison Investment Research
Other sensitivities
We have also identified other factors that may affect CS and our base case scenario:
■
Digital assets adoption path: our addressable market forecast relies on the assumption of a continued increase in the allocation of global financial wealth to digital assets. We note that the adoption trajectory is hard to predict (especially given the difficulty in valuing digital assets) and our forecast may prove too conservative or too aggressive. However, we also note the advantages of a global seamless blockchain-based financial infrastructure, which will likely encourage asset tokenisation (see our Blockchain adoption report for details). This would create a market in which experienced players with robust trading infrastructure such as CS can thrive.
■
Competitive pressure in the crypto ETP market: although CS is the largest European digital asset firm and has been at the forefront of solutions such as introducing a transparent mechanism for sharing staking rewards, it needs to remain innovative to stay competitive and successfully expand in the US. Therefore, investors should closely follow CS’s developments in terms of more sophisticated product launches.
■
Regulatory risks: while further regulatory clarity should help drive adoption, government policies and regulations may also pose a risk to sector growth if they are not aligned with the nature of the blockchain technology.
■
XBT Provider redemption pattern and backing: our DCF valuation is sensitive to the timing and volume of redemptions of the legacy XBT Provider ETPs and the accompanying release of cash fees. The lower (or higher) the redemption volume in the coming years, the lower (or higher) our free cash flow estimates and valuation. Interestingly, an abrupt bear market could, apart from offering CSCM more attractive trading opportunities, trigger a large redemption wave and provide a significant cash inflow for CS (although at the same time affecting future fee revenue). Moreover, we note that CS deploys part of the digital asset investments used as collateral for the XBT Provider products (eg by staking the ETH held to back the Ether Trackers). Any potential losses (beyond plain beta vs digital asset prices) arising from these activities could result in a mismatch between the collateral held by CS and the liability to unit holders.
■
Protocol risk: capital deployed in digital assets is subject to risks associated with the robustness of the code underpinning the blockchains hosting these assets. While both Bitcoin and Ethereum are well-established blockchains with limited protocol risk, we note that CS can also deploy capital beyond these base layers and into DeFi applications. However, CS currently has no meaningful capital invested in DeFi. We also note that CS is mindful of the liquidity risks associated with DeFi protocols (based on the lessons learned from the TerraUSD-LUNA collapse) and is very careful in its CSCM activities with respect to pursuing DeFi opportunities. As an example, it does not engage in re-staking through protocols such as EigenLayer at present.
■
Low free float: we note that the company’s free float currently stands at just 29.7%, which may affect the liquidity of the shares and the extent to which the stock price reflects CS’s intrinsic value.
Exhibit 18: Financial summary
Year ending 31 December |
FY19 |
FY20 |
FY21 |
FY22 |
FY23 |
FY24e |
FY25e |
FY26e |
FY27e |
FY28e |
Income statement |
|
|
|
|
|
|
|
|
|
|
Revenues |
11,331 |
18,389 |
80,755 |
51,337 |
43,083 |
85,836 |
91,438 |
95,890 |
99,072 |
97,982 |
Administrative expenses |
(9,284) |
(14,312) |
(32,059) |
(23,833) |
(21,393) |
(44,061) |
(49,473) |
(52,649) |
(55,304) |
(57,603) |
Other operating income |
529 |
607 |
14,665 |
16,627 |
2,323,447 |
24,409 |
24,897 |
25,395 |
25,903 |
26,421 |
Profit/(loss) on financial instruments |
(64,553) |
(1,398,436) |
(2,483,773) |
1,741,144 |
(1,281,647) |
(1,631,591) |
(896,974) |
(1,023,565) |
(1,101,047) |
(1,074,198) |
Realised gain/(loss) on investments |
(405) |
942 |
5,287 |
(4,950) |
775 |
(3) |
0 |
0 |
0 |
0 |
Adjusted EBITDA |
11,171 |
22,113 |
121,059 |
(6,766) |
57,267 |
83,570 |
99,146 |
96,993 |
96,200 |
91,843 |
EBIT |
(62,382) |
(1,392,810) |
(2,415,125) |
513,998 |
(455,875) |
(1,257,730) |
96,110 |
93,957 |
93,164 |
88,807 |
Finance income |
931 |
3,793 |
10,905 |
12,917 |
10,224 |
12,186 |
14,118 |
12,862 |
12,281 |
11,688 |
Finance expense |
(404) |
(1,191) |
(7,045) |
(6,330) |
(6,902) |
(7,131) |
(5,118) |
(5,934) |
(6,929) |
(7,988) |
Pre-tax profit |
(61,855) |
(1,390,208) |
(2,411,265) |
520,585 |
(452,553) |
(1,245,811) |
105,110 |
100,884 |
98,517 |
92,506 |
Income taxes |
(269) |
(401) |
(1,056) |
(369) |
(574) |
(764) |
(1,013) |
(972) |
(949) |
(891) |
Net income |
(62,124) |
(1,390,610) |
(2,412,322) |
520,216 |
(453,126) |
(1,246,574) |
104,097 |
99,912 |
97,567 |
91,615 |
Total comprehensive income |
8,914 |
18,419 |
113,443 |
2,934 |
38,396 |
85,905 |
104,097 |
99,912 |
97,567 |
91,615 |
Adjusted EPS (diluted, £)* |
N/A |
0.28 |
1.62 |
0.04 |
0.54 |
1.21 |
1.47 |
1.41 |
1.37 |
1.29 |
DPS (£) |
0.00 |
0.00 |
0.00 |
0.00 |
0.13 |
0.25 |
0.31 |
0.30 |
0.29 |
0.27 |
Balance sheet |
|
|
|
|
|
|
|
|
|
|
Property, plant and equipment |
376 |
223 |
836 |
1,936 |
3,066 |
2,400 |
1,818 |
1,309 |
875 |
520 |
Digital assets |
N/A |
N/A |
2,689 |
112 |
1,332 |
1,332 |
1,332 |
1,332 |
1,332 |
1,332 |
Intangible assets |
7 |
20 |
18,099 |
11,992 |
10,658 |
11,445 |
10,572 |
9,699 |
8,826 |
7,953 |
Investments |
5,585 |
3,626 |
23,690 |
14,608 |
25,111 |
22,683 |
22,683 |
22,683 |
22,683 |
22,683 |
Investments in JVs and associates |
N/A |
N/A |
N/A |
30,404 |
19,813 |
21,871 |
21,871 |
21,871 |
21,871 |
21,871 |
Long term receivables |
323 |
329 |
1,176 |
806 |
329 |
1,503 |
1,503 |
1,503 |
1,503 |
1,503 |
Other non-current assets |
N/A |
N/A |
N/A |
1,968 |
2,212 |
3,020 |
3,020 |
3,020 |
3,020 |
3,020 |
Non-current assets |
6,290 |
4,199 |
46,489 |
61,826 |
62,520 |
64,254 |
62,799 |
61,417 |
60,111 |
58,882 |
Trade and other receivables |
27,011 |
62,274 |
1,063,415 |
1,458 |
2,241 |
17,664 |
26,160 |
22,619 |
43,068 |
46,373 |
Digital assets |
427,524 |
1,826,695 |
2,761,630 |
868,923 |
2,375,850 |
3,522,807 |
4,107,875 |
4,919,274 |
5,737,262 |
6,369,380 |
Cash at bank |
2,350 |
2,266 |
10,776 |
26,568 |
6,661 |
19,448 |
34,817 |
61,929 |
107,750 |
171,433 |
Amounts due from brokers |
39,405 |
66,518 |
118,976 |
98,129 |
16,271 |
41,584 |
48,218 |
56,296 |
64,908 |
71,759 |
Other current assets |
N/A |
N/A |
N/A |
187,638 |
268,670 |
967,089 |
1,112,153 |
1,167,761 |
1,226,149 |
1,287,456 |
Current assets |
496,290 |
1,957,752 |
3,954,796 |
1,182,716 |
2,669,693 |
4,568,592 |
5,329,223 |
6,227,878 |
7,179,137 |
7,946,402 |
Total assets |
502,580 |
1,961,951 |
4,001,285 |
1,244,541 |
2,732,213 |
4,632,846 |
5,392,021 |
6,289,295 |
7,239,247 |
8,005,284 |
Share capital |
2,215 |
31 |
34 |
34 |
34 |
33 |
33 |
33 |
33 |
33 |
Share premium |
111 |
2,387 |
30,781 |
30,781 |
30,691 |
30,529 |
30,529 |
30,529 |
30,529 |
30,529 |
Other reserves |
168,813 |
1,209,630 |
(2,797,090) |
22,136 |
454,110 |
1,558,941 |
1,558,941 |
1,558,941 |
1,558,941 |
1,558,941 |
Retained earnings |
(125,795) |
(1,155,551) |
2,966,289 |
150,790 |
(245,590) |
(1,271,266) |
(1,184,167) |
(1,105,114) |
(1,027,567) |
(955,504) |
Total equity |
45,343 |
56,497 |
200,013 |
203,741 |
239,245 |
318,238 |
405,337 |
484,390 |
561,936 |
634,000 |
Trade and other payables |
419,340 |
1,792,936 |
3,505,675 |
3,970 |
5,612 |
7,488 |
7,488 |
7,488 |
7,488 |
7,488 |
Certificate liability |
N/A |
N/A |
N/A |
986,707 |
2,351,476 |
4,158,359 |
4,821,829 |
5,629,572 |
6,490,807 |
7,175,894 |
Amounts due to brokers |
37,631 |
112,121 |
292,707 |
0 |
669 |
53,937 |
62,543 |
73,020 |
84,191 |
93,077 |
Lease liabilities |
N/A |
N/A |
210 |
1,308 |
564 |
631 |
631 |
631 |
631 |
631 |
Current tax liabilities |
266 |
398 |
2,578 |
236 |
157 |
188 |
188 |
188 |
188 |
188 |
Other current liabilities |
N/A |
N/A |
N/A |
27,117 |
108,941 |
70,000 |
70,000 |
70,000 |
70,000 |
70,000 |
Current liabilities |
457,237 |
1,905,454 |
3,801,171 |
1,019,337 |
2,467,419 |
4,290,602 |
4,962,678 |
5,780,898 |
6,653,304 |
7,347,277 |
Non-current liabilities |
0 |
0 |
101 |
21,463 |
25,549 |
24,007 |
24,007 |
24,007 |
24,007 |
24,007 |
Total equity and liabilities |
502,580 |
1,961,951 |
4,001,285 |
1,244,541 |
2,732,213 |
4,632,846 |
5,392,021 |
6,289,295 |
7,239,247 |
8,005,284 |
Ratios |
|
|
|
|
|
|
|
|
|
|
Adjusted EBITDA margin |
54.0% |
62.8% |
79.7% |
(9.4%) |
66.9% |
59.7% |
67.4% |
65.8% |
64.4% |
62.2% |
Adjusted net margin |
38.4% |
47.6% |
74.7% |
4.1% |
44.8% |
45.0% |
70.8% |
67.8% |
65.3% |
62.0% |
Source: Company accounts, Edison Investment Research. Note: *Total comprehensive income per share attributable to shareholders of the parent.
|
|||||||||||||||||||||||||||||||||||||||||||||||||||||||||||||||
|
|
Research: TMT
Cordel’s new customer win in the Middle East expands its global customer footprint, providing further validation of the company’s product market fit and long-term revenue opportunity. Meanwhile, the company’s most recent certification from Network Rail means that Cordel’s entire processing pipeline now meets some of the most stringent standards globally, providing an important validation of the company’s product set.