We refresh our view on Cairn Energy, focusing on key areas of interest for investors already familiar with the company. We examine a number of valuation approaches for SNE in Senegal, the potential for reserve upgrades and exploration value. We believe SNE is an outsized asset and assume Cairn seeks to farm-down. This will naturally affect long-term value upside, but would in our view drive a better balance of asset and financial risk. We also examine features of Catcher, Cairn’s cost of capital and look at the Indian tax dispute. After a long period of value stagnation (as cash was invested to develop Catcher/Kraken), coming years could be a time when investors see a path to this investment steadily bearing fruit. Our core contingent NAV is 225p/share and our RENAV is 255p/share.
Written by
Cairn Energy |
Producer, developer, explorer |
Update |
Oil & gas |
24 July 2017 |
Share price performance
Business description
Next events
Analysts
|
||||||||||||||||||||||||||||||||||||||||||||||||||
We refresh our view on Cairn Energy, focusing on key areas of interest for investors already familiar with the company. We examine a number of valuation approaches for SNE in Senegal, the potential for reserve upgrades and exploration value. We believe SNE is an outsized asset and assume Cairn seeks to farm-down. This will naturally affect long-term value upside, but would in our view drive a better balance of asset and financial risk. We also examine features of Catcher, Cairn’s cost of capital and look at the Indian tax dispute. After a long period of value stagnation (as cash was invested to develop Catcher/Kraken), coming years could be a time when investors see a path to this investment steadily bearing fruit. Our core contingent NAV is 225p/share and our RENAV is 255p/share.
(US$m) Year end |
Revenues |
PBT |
Operating cash flow |
Net cash |
Cash from financing |
12/15 |
0 |
(498) |
(16) |
603 |
(6) |
12/16 |
0 |
(152) |
(21) |
335 |
(4) |
12/17e |
59 |
(792) |
(21) |
18 |
0 |
12/18e |
402 |
107 |
226 |
98 |
0 |
Note: Figures are as reported.
SNE reserves upgrades hinge on upper reservoir
The recent SNE-6 well test appeared to show strong connectivity between wells in the upper reservoirs, going some way to settle concerns that the pressure declines seen in past well testing would be major obstacles to recovery. If we assume that lower reservoirs have recovery of 30% (as hinted at by Cairn), this implies the current 473mmbbl 2C estimate has recovery factors in the upper reservoirs of between 9-14%, with FAR’s 641mmbbl estimate implying 19-22%. The interference test may well clear the way for higher recovery factors than 9-14% to be used by Cairn, but it may be more difficult to move much beyond 20% we suspect. Given the positive interference test and other appraisal results, we choose to use FAR’s estimate for the time being, awaiting an August update from Cairn.
Cairn India tax arbitration result still some time away
The final hearing of the arbitration is due in early 2018 and judgement could be a few months after. We believe the market is largely pricing in very little value for the stake, and taking a very risked view on Cairn winning any of the $1.1bn damages.
Valuation: 225p/share NAV with RENAV of 255p/share
We revisit our valuation, giving a contingent NAV of 225p/share. Within this, we (notionally) risk the Cairn India stake at 50% and assume Cairn will farm-down part of its stake in the Senegalese assets to reduce risk. We think exploration at SNE North and FAN South are unlikely to be more than incremental additions to value, but that the progression of SNE and the production cash flow from Catcher/Kraken could be the impetus to get Cairn’s shares to move higher in coming years. Druid/Drombeg is a high risk/value prospect; together with SNE exploration it contributes to a RENAV of 255p/share (based on a long-term oil price of $70/bbl).
Executive summary
Cairn’s share price has been far more stable than many of its peers in recent quarters, avoiding the turmoil caused by the financial distress of low oil prices. Equally, the shares have not been a great absolute investment over recent years, not helped by the ongoing Indian tax challenge.
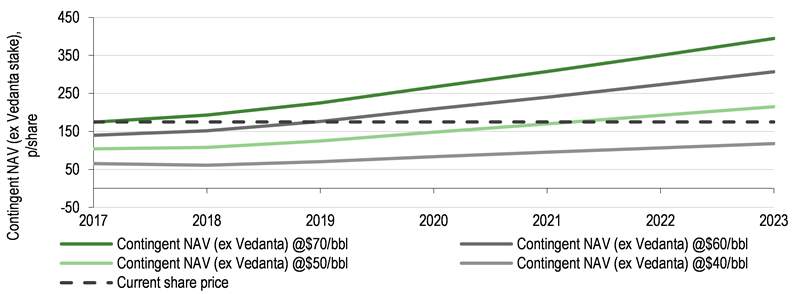
In previous years, the company valuation has been dominated by the cash and Cairn India stake. In transitioning to a more balanced E&P with production, development and exploration, the company has invested a great deal, the result being a reduction in cash that has not as yet been fully compensated for by increase in value from production cash flows. This meant that the NAV/share from 2013-16 was relatively flat, unsurprisingly producing relatively damped share price performance. We believe this has the potential to change in 2017 and onwards. Below we show NAV performance without the Cairn India stake (given that the value of this is uncertain and heavily discounted in the share price at the moment).
|
Exhibit 1: Edison’s assessment of NAV/share for Cairn (ex-Cairn India stake) |
Exhibit 2: Edison’s assessment of NAV/share for Cairn (ex-Cairn India stake) at different oil prices |
|
|
|
Source: Edison Investment Research. Note: Does not include value of Cairn India. The NAV for past period is using current assumptions throughout (does not use oil prices/production/costs assumed at the time). |
Source: Edison Investment Research. Note: Does not include value of Cairn India. The NAV for past period is using current assumptions throughout (does not use oil prices/production/costs assumed at the time). Dashed line: current share price. |
|
Exhibit 1: Edison’s assessment of NAV/share for Cairn (ex-Cairn India stake) |
|
|
Source: Edison Investment Research. Note: Does not include value of Cairn India. The NAV for past period is using current assumptions throughout (does not use oil prices/production/costs assumed at the time). |
|
Exhibit 2: Edison’s assessment of NAV/share for Cairn (ex-Cairn India stake) at different oil prices |
|
|
Source: Edison Investment Research. Note: Does not include value of Cairn India. The NAV for past period is using current assumptions throughout (does not use oil prices/production/costs assumed at the time). Dashed line: current share price. |
The assets will account for the vast majority of Cairn’s value from 2017 and investors will see Cairn change once again into a full cycle E&P. Production from UK fields should provide sufficient cash flows to fund the spending that SNE (and to a lesser extent Norway) will require in a few years, while an exploration well at Druid/Drombeg has the potential to provide high value growth potential.
Portfolio choice affects valuation
However, the management has a clear choice on the future direction for Cairn. Should it continue to recycle cash flows from production into developments at SNE and Norway (potentially using all cash flows and debt capacity), or look to monetise some of its portfolio, releasing value to shareholders in the process? SNE is a valuable long-term asset but will likely consume the lion’s share of cash flows (from 2020) to develop, while delays/disruptions are always a possibility. A well-executed farm-down in return for a (partial) development carry would open the door to a potential return of cash to shareholders as production cash flows are freed up, and reduce the risk of financial distress should oil prices not move slowly upward as the market currently expects. It would repeat the monetisation of success it achieved with the Cairn India spin-off, a rare breed among E&Ps.
We also take a closer look at:
■
The moving parts of valuing SNE, examining the potential of reserve upgrades following the appraisal process albeit with a view on how much value additional reserves contribute given the time to develop them. Exploration success at SNE South or FAN North would be useful additions, but have the potential to be tie-ins to the core SNE development. As such, first production of such discoveries may be over a decade away.
■
The logic and implications of a farm-down of SNE post FID. We assume that Cairn looks to farm-down the asset to reduce risk and manage its capital. If the company does not liquidate its Cairn India stake before first oil at SNE, it is possible that it will be close to financing limits (depending on oil prices, performance of UK assets, market sentiment), and we believe it would be prudent to seek a farm-down for a development carry.
■
The implications of the likely increased production rates possible at Catcher, balanced by the impact of its very high opex ($35/bbl life-of-field). We see an extension beyond the current 10-year production life as unlikely given the high opex and paucity of tie-in opportunities.
■
A timeline on the Indian tax arbitration and further information on other companies affected by the retrospective tax legislation passed in 2012. We are not law experts and do not make a determination of likely success, and note that our assumed valuation for the stake in Cairn India/Vedanta (and that we think the market is applying) implies a low chance of success. We leave it to investors to decide whether this is reasonable.
■
Thoughts on Cairn’s cost of capital and an investigation into the recent financing deal, which implied an IRR for Flowstream of around 20% – well above other sources of capital.
Exhibit 3: NAV summary
Asset |
Shares: 583m |
|
|
Recoverable reserves |
|
Net risked value |
|
|||||
Country |
WI |
CoS |
Gross |
Net |
NPV |
US$m |
p/share |
|
|
@$60/bbl |
||
|
% |
% |
mmboe |
$/boe |
12.5% |
10.0% |
15.0% |
12.5% |
||||
Net (Debt) Cash end-Dec 2016 |
335 |
46 |
46 |
46 |
46 |
|||||||
Dividends from Cairn India/Vedanta to be released – risked @50% and discounted |
47% |
++ |
49 |
7 |
7 |
7 |
7 |
|||||
Value of Cairn India stake (now Vedanta) |
89% |
* |
673 |
92 |
96 |
89 |
92 |
|||||
Tax claim on Cairn India - assume overall to be half of total stake value |
(337) |
(46) |
(48) |
(44) |
(46) |
|||||||
Cairn counter claim against India |
0 |
0 |
0 |
0 |
0 |
|||||||
Costs to litigate Indian tax case (2017/18) |
(13) |
(2) |
(2) |
(2) |
(2) |
|||||||
G&A (3 years) |
(52) |
(7) |
(7) |
(7) |
(7) |
|||||||
Exploration capex in 2017 |
(137) |
(19) |
(19) |
(19) |
(19) |
|||||||
Development |
|
|||||||||||
Kraken |
UK |
29.5% |
95% |
140 |
41 |
10.6 |
416 |
57 |
63 |
51 |
47 |
|
Catcher |
UK |
20% |
90% |
100 |
20 |
12.8 |
230 |
31 |
35 |
29 |
25 |
|
Core NAV = Cash + Development |
|
|
|
240 |
61 |
|
1,165 |
159 |
171 |
149 |
143 |
|
Contingent |
||||||||||||
SNE (assumes farm-down) |
Senegal |
25% |
60% |
641 |
160 |
4.7 |
456 |
62 |
95 |
41 |
45 |
|
Skarfjell |
Norway |
20% |
60% |
100 |
20 |
2.4 |
28 |
4 |
6 |
2 |
3 |
|
Contingent resources |
|
|
|
981 |
242 |
|
1,650 |
225 |
271 |
192 |
191 |
|
Druid/Drombeg |
Ireland |
30% |
20% |
601 |
180 |
5.4 |
195 |
27 |
40 |
18 |
18 |
|
SNE North/Sirius |
Senegal |
25% |
36% |
80 |
20 |
2.9 |
21 |
3 |
5 |
1 |
2 |
|
Total RENAV |
|
|
|
1,662 |
442 |
|
1,866 |
255 |
316 |
211 |
211 |
|
Source: Edison Investment Research. Note: We explicitly assume that Cairn notionally reduces its stake in SNE from 40% WI to 25% WI in return for a development carry (see section on farm-out for logic). *We arrive at 89% by assuming a present value of the value of the stake (if sold after the end of arbitration in one year’s time. For the Indian tax claim, we do not take a position on the judgement, so assume that there is a 50:50 chance of judgement against, hence choose a 50% notional assertion of Cairn stake value for the tax claim. In reality the judgement will be a binary result ++ 47% risking on Cairn dividend is a 50% risk of payment discounted by six months.
Senegal: Examine value not volumes
The discoveries of FAN-1 and SNE-1 in October and November 2014 (40% WI) respectively, were a high point for exploration in that year (FAN was the largest discovery globally). The consortium has drilled multiple exploration and appraisal wells since and Cairn has given indications of a development concept based on its current 2C reserves estimate. How should we approach a valuation of the assets? We review a number of approaches to give indications of value from invested capital to implied values from pure-play peers. Unsurprisingly, these give a range of values.
We believe the analysis indicates few major avenues for investors to see step-change upside in the asset other than reserves upgrades and successful exploration. We expect a reserves update in August after the results of the interference testing at SNE-6 are fully interpreted, which will inform how the upper reservoirs (which hold a majority of OIP but have produced the lower test rates so far) are best exploited. Exploration at FAN South and SNE North (formerly Sirius) could add incrementally, although time to develop these potential tie-ins to a core SNE development will mean that a marked increase in value is unlikely, we think.
|
Exhibit 4: Current value for Cairn’s Senegal stake |
|
|
Source: Edison Investment Research |
Valuing by investment
At the end of 2016, Cairn held the Senegalese assets on its balance sheet at US$330m, equivalent to 45p/share. With a proposed investment in 2017 of US$155m (including contingent drilling costs of $50m), this would rise to 65p/share by the end of the year.
Valuing by deal
Woodside’s 2016 acquisition of Conoco’s stake gives a good guide as to the value that industry attributes to the area. The acquisition for $442m of a 35% interest implies a gross block value of $1,257m (this includes $92m of adjustments to compensate for capex). This implies a Cairn value of 69p/share.
Valuing by DCF
We use discounted cash flows as the primary valuation methodology, modelling the fiscal terms as available to us and a set of macro, opex and capex assumptions using company guidance where available and appropriate. This gives us a value that we can track over time to see how the value increases as capital is invested and production cash flows approach. The mechanism of value increase for SNE shown below indicates growth of around 25% pa (on an unrisked basis).
We note our risked valuation for SNE roughly tracks the capital invested until 2017/2018 as the long-term risked value of the asset only exceeds the significant (and required) outlay on appraisal wells. The excess of value over investment increases markedly in coming years however. By first oil in mid 2020s, our modelling assumes that Cairn (at current working interest of 40%) would have invested the equivalent of 312p/share, but would have an NPV12.5 of c 578p/share. In a farm-down scenario, the value in 2024 would be 357p/share having invested around 145p/share. In the first five years of production, the asset will produce over $9.6bn of gross post-tax cash flow (assuming long-term Brent prices of $70/bbl real, with a 2.5% quality discount applied given the 32° API oil).
|
Exhibit 5: (Un)risked valuation of SNE net to Cairn vs capex spent (assuming no farm-down is done) |
Exhibit 6: (Un)risked valuation of SNE net to Cairn vs capex spent (farm down) |
|
|
|
Source: Edison Investment Research. Note: This assumes that Cairn retains 40% interest. |
Source: Edison Investment Research. Note: This assumes our base case that Cairn farms-out 15% of its interest (retaining 25%) in return for a development carry. |
|
Exhibit 5: (Un)risked valuation of SNE net to Cairn vs capex spent (assuming no farm-down is done) |
|
|
Source: Edison Investment Research. Note: This assumes that Cairn retains 40% interest. |
|
Exhibit 6: (Un)risked valuation of SNE net to Cairn vs capex spent (farm down) |
|
|
Source: Edison Investment Research. Note: This assumes our base case that Cairn farms-out 15% of its interest (retaining 25%) in return for a development carry. |
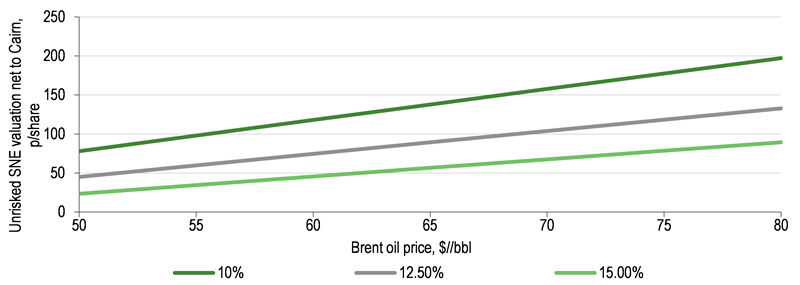
The major sensitivities to our valuation are discount rate and long-term oil price. Reducing our discount rate from 12.5% to 10% would see a >50% increase in NPV. A US$5/bbl decrease in the long-term oil price would see unrisked value fall by 14% (assuming Cairn farms-down).
|
Exhibit 7: Sensitivities to oil price and discount rates (NPV in 2017) (assuming a farm-down) |
|
|
Source: Edison Investment Research |
We also note that because of our methodology (assuming FAR’s relatively high estimate vs Cairn’s 473mmbbls, but using a higher capex intensity and risking at 60%), it is possible an increase in Cairn’s estimate of SNE volumes to below the 641mmbbls but lower capex than we conservatively assume will only have a relatively muted effect on our valuation. For example, an estimate of 580mmbbls and lower capital intensity would increase our SNE valuation by 4p/share (vs a 9p fall if we move our long-term Brent assumption from $70/bbl to $65/bbl, for example).
Valuing by proxy – FAR Ltd
FAR is an Australian-listed company that is (largely) a pure play on Senegal. We can therefore derive a proxy value for Cairn’s interest in Senegal by looking at the EV of FAR (WI 15%) and adjusting for working interests. This generates the charts below. We note the expansion in value implied by FAR is attributed to a doubling of the share price, a 60% plus increase in share count (from date of discovery) and a small movement of exchange rates.
|
Exhibit 8: FAR’s EV and share price (A$/share) |
Exhibit 9: Implied value of Senegal to Cairn shareholders, p/share |
|
|
|
Source: Bloomberg, Edison Investment Research |
Source: Edison Investment Research, Bloomberg |
|
Exhibit 8: FAR’s EV and share price (A$/share) |
|
|
Source: Bloomberg, Edison Investment Research |
|
Exhibit 9: Implied value of Senegal to Cairn shareholders, p/share |
|
|
Source: Edison Investment Research, Bloomberg |
Also overlain in the charts above is the implied value from the target price valuation of FAR analysts. Perhaps not surprisingly, given the range of analyst approaches and levels of optimism sometimes seen in pure-play explorers, this view implies a very high value. We note that the Bloomberg consensus target price includes four of the eight brokers, one of which has a target price over twice that of the consensus number. Just to underline the range of estimates for FAR’s value, there are two target prices above A$0.2/share, which, given the number of shares outstanding and net cash position, would imply that these analysts believe that FAR should be worth more than Cairn’s current market cap (even though Cairn has other assets and >2.5x the working interest in SNE).
This is a paradox. Cairn is a well-funded E&P with two large developments that will be cash flow positive by the end of 2017. It held cash of $335m at end December 2016 and will have c $210m of RBL facility by the end of 2017 (and an estimated peak RBL facility of $350-400m). The cash flows from Catcher and Kraken together with the RBL facility could be enough to fund the SNE development without recourse to new equity. On the other hand, FAR has no internally sourced cash flows and will have to source hundreds of millions (>US$500m) of capital pre-first oil. By definition, FAR has a much higher cost of capital and so arguably FAR should be valued at a lower level than Cairn, yet we believe that its assets are valued higher by the market.
Three avenues for upside in Senegal
FAN-1 was discovered in October 2014 with the SNE well success announced in November. Since then, the consortium has drilled six appraisal wells on SNE while none have been drilled at FAN. Cairn remarked that although the FAN structure is large, the reservoir quality is poor. Because of this and its lack of action on SNE, we do not believe FAN figures in any future development plans. For investors, this leaves three avenues for upside in Senegal, other than the natural de-risking as the development moves towards FID and then production: (i) a full delineation of SNE with possible increases following appraisal; (ii) exploration; or (iii) improvement of project economics.
Delineation and increases to reserve estimates hinge on recovery factors
SNE has seen consistent increases to recoverable barrels since discovery as successful appraisal wells have de-risked the flanks of the structure and given greater confidence in the reservoir characteristics. FAR has updated its (independently audited) estimates more regularly than Cairn, and the most recent estimate is notably above those of Cairn (as seen below). Cairn has indicated that FAR’s higher estimates are most likely due to the application of higher recovery factors (mid-year results, August 2016). Cairn expects to publish an updated reserve estimate in August.
|
Exhibit 10: Estimates for recoverable barrels from SNE (FAR, Cairn and Woodside) |
|
|
Source: FAR, Cairn and Woodside. Note: The Woodside number seems to be the average of the available Cairn and FAR estimates at the time. |
The reservoir at SNE consists of many layers, but they are broadly split by Cairn into Upper and Lower Zones. The Lower Zones are good quality and have produced at a constrained rate of 8,000bopd when tested in SNE-2.
As illustrated below, the consortium has concentrated far more on the upper reservoirs since then. They contain the majority of OIP but are described as being thinner and finer grained and have produced at lower rates than the Lower reservoir sands (SNE-3 produced at 5.4kbd). Additionally, during testing of these Upper Zones in SNE-3, slight pressure depletion was observed. This could have indicated that SNE-3 is not well connected to the rest of the field.
Exhibit 11: Summary of well results – a great deal more effort has been made to determine upper reservoirs
Date |
Well |
Reservoirs tested |
Flow rates achieved |
Gross oil bearing column |
10 Nov 2014 |
SNE-1 |
95m |
||
4 Jan 2016 |
SNE-2 |
Lower and upper reservoirs |
DST over a 12 metre (m) interval of high quality pay flowed at a maximum stabilised, but constrained rate of ~8,000bopd on a 48/64” choke, confirming the high deliverability of the principal reservoir unit in the SNE-2 well |
103m |
1 Mar 2016 |
SNE-3 |
Upper reservoirs |
DST 1a flowed at a maximum rate of ~5,400bopd and a main flow rate of ~4,000bopd over a 24-hour period from a 15m) zone |
101m |
11 Apr 2016 |
SNE-4 |
Upper reservoirs |
Not tested |
c 100m |
7 Mar 2017 |
SNE-5 |
Upper reservoirs |
DST 1a flowed from an 18m interval at a maximum rate of ~4,500bopd on a 60/64” choke. Two main flows of 24 hours each were performed; the first at ~2,500bopd on a 40/64” choke, followed by a second at ~3,000bopd on 56/64” choke |
|
6 Apr 2017 |
VR-1 |
Lower reservoirs |
5km step out. Cairn suggests that recovery factors from lower sands “should yield recovery factors of 30% or more”... “VR-1 confirmed the 1C proven resources for the field” |
|
18 May 2017 |
SNE-6 |
Upper reservoirs |
The objective of the SNE-6 well was to flow oil from one of the principal units in the upper (400 series) reservoirs and demonstrate connectivity between the two wells. Pressure data from SNE-6 immediately confirmed good connectivity with SNE-5 and accordingly a short DST was performed. Two DST were performed: a longer 48-hour test on an 11m interval that produced 3,700bopd and (with the addition of a further 12m interval) a 24-hour test averaging 4,700bopd. Pressure data confirmed that SNE-6 is connected to SNE-5 (1.6km away). We note that the plan pre-well was to test for 10 days and see connection to both SNE-5 and SNE-3. No mention was made of SNE-3 in the release |
Source: Cairn Energy, Edison Investment Research
|
Exhibit 12: SNE schematic cross section |
|
|
Source: Cairn Energy |
To investigate this pressure decline further, the SNE-6 well was planned to be tested for a longer period of time (of around 10 days) in order to carry out an interference test. It was hoped that the pressure pulse generated by the change of pressure at SNE-6 would be detected by gauges installed at SNE-5 and SNE-3, providing a clearer picture of the connectivity of the reservoir. This would then be used to assess the potential effectiveness of waterflooding and could affect the field recovery factor. The results will have an impact on the number, design, placement and orientation of future development wells in the upper reservoirs. This is critical because the majority of OIP is in the upper reservoirs (and where we believe the recovery factor is currently estimated to be lower than that assumed in the lower reservoirs).
Results of SNE-6 (released by Cairn on 18 May), indicate that a much shorter DST was performed (48 hours vs 10 days planned) as pressure data immediately confirmed good connectivity with SNE-5. This is in line with Cairn’s existing model, which indicated that oil would flow preferentially to SNE-5. We note that no mention was made of connectivity with SNE-3 – it is possible that Cairn felt able to confirm its model given the speed at which connectivity with SNE-5 was measured.
Making a case for existing assumptions on recovery factors
An RNS by Cairn after the VR-1 well in April 2017 indicated that “the lower 500 series reservoirs are the better connected, more tabular, highly productive sands, where water-flooding should yield recovery factors of 30% or more.” We do not know the exact split of resources between the layers, but Cairn indicated that a greater proportion of the SNE resources sit in these Upper zones (the Q4 results indicated the upper reservoirs account for “the bulk of the oil in place”). Interpretations of “bulk” vary, but we would imagine that this could be seen as being between 60-80%. Using a 30% recovery factor in the lower reservoirs would imply that RF for the upper reservoirs is currently assumed in the 473mmbbl 2C estimate to be between 9-14% (depending on what the split of OIP between the reservoirs is). This rises to 19-22% if we assume the 641mmbbl 2C estimate given by FAR (and the estimate we adopt following the positive interference test). These are obviously very different ranges and illustrate why so much energy and capital has been expended trying to better understand the upper reservoirs.
Exhibit 13: Low implied recovery factors in the upper reservoirs assuming given recovery factors in lower reservoirs and OIP distribution (using 2C estimate of 473mmbbl)
% of volumes in upper reservoirs |
||||
60% |
70% |
80% |
||
Assumed recovery factor in lower reservoirs |
25% |
12% |
14% |
15% |
30% |
9% |
12% |
14% |
|
35% |
5% |
10% |
13% |
|
40% |
2% |
8% |
12% |
|
Source: Edison Investment Research
This also informs our thinking about how much upside there could be above 641mmbbl. Unless the OIP increases and the recovery factor assumed in the lower reservoirs is above the 30% that seems to have been indicted by Cairn (both of which are possible), the 641mmbbl estimate already assumes a reasonable recovery factor in the upper reservoirs of perhaps 20%. The positive interference test gives us more confidence in the upper reservoirs, but we are hesitant to think it would necessarily move up to 30% at this stage.
Exhibit 14: Implied recovery factors in the upper reservoirs assuming given recovery factors in lower reservoirs and OIP distribution (using 2C estimate of 641mmbbl)
% of volumes in upper reservoirs |
||||
60% |
70% |
80% |
||
Assumed recovery factor in lower reservoirs |
25% |
22% |
23% |
23% |
30% |
19% |
21% |
22% |
|
35% |
16% |
18% |
20% |
|
40% |
12% |
16% |
19% |
|
Source: Edison Investment Research
Exploration wells
Cairn stated at its full year results announcement that it may drill two further exploration wells in 2017 (the Sirius/SNE North and FAN South prospects), so it was no great surprise to see FAR announce that the next exploration well would be at FAN South.
The first well drilled by Cairn in Senegal (FAN-1) was a discovery that, crucially, established the presence of world class source rocks in the region. It encountered a hydrocarbon interval of over 500m, but the reservoir quality was not as promising as seen in the subsequent shelf well SNE-1 and so Cairn focused on the appraisal of SNE while developing geological models to identify areas of improved reservoir thickness and quality either in FAN or in another fan along the trend.
Based on this modelling work, FAN South-2 was positioned slightly shallower in the basin than FAN-1, where Cairn believed it should be able to encounter much better developed reservoir characteristics. FAN South-2 was a new fan on trend with the North Fan and with a separate input point and new layers. The well was located around 20km south-east of SNE-3 in 2,139m of water (compared to 1,100m in SNE) and targeted a Cretaceous channelised turbidite fan with multiple stacked layers. It was estimated by Cairn to contain more than 110mmbbl with a consolidated chance of success of 24%. The same prospect was estimated in mid-2016 to contain just over 150mmbbl with a 15% CoS, so work had affected understanding of the prospects notably.
|
Exhibit 15: FAN-South well location cartoon |
Exhibit 16: FAN structures in block |
|
|
|
Source: FAR Ltd |
Source: FAR Ltd |
|
Exhibit 15: FAN-South well location cartoon |
|
|
Source: FAR Ltd |
|
Exhibit 16: FAN structures in block |
|
|
Source: FAR Ltd |
Results of well
On 11 July, Cairn announced results from the well. Hydrocarbon bearing reservoir was encountered, with oil samples collected of 31 API oil. However, the company indicated that further work would be needed to assess potential commerciality of the discovery. This suggests to us that the discovery is not as large as forecast, that the reservoir has poorer permeability/porosity than thought. For now, it looks like both FAN wells have given sub-commercial results.
Sirius and other exploration
For Sirius/SNE North, Cairn currently estimates a 67% CoS over 80mmbbl (FAR indicates 294mmbbl at 60%). We note that these consolidated chances of success may be misleading for some, and cannot be directly applied to the total prospect sizes as each prospect is made up of a number of individual intervals with unique CoSs. We note the CoS for the two prospects given by FAR are lower as seen below (we also note the difference in sizes estimated).
Exhibit 17: Summary of exploration prospects and chances of success
Prospect |
Play type |
FAR estimates |
Cairn estimates |
||
Gross prospective recoverable oil (P50), mmbbl |
CoS, % |
Gross prospective recoverable oil (P50), mmbbl |
CoS, % |
||
Sirius/SNE North |
Albian shelf edge |
294 |
60% |
80 |
67% |
Spica |
Albian shelf edge |
199 |
37% |
||
Leebeer SNE |
Late Albian shelf |
116 |
33% |
||
Leebeer Sirius/SNE North |
Late Albian shelf |
50 |
20% |
||
Leebeer Spica |
Late Albian shelf |
47 |
20% |
||
Rufisque Onlap |
Albian |
181 |
14% |
||
Alhamdulillah |
Albian FAN |
80 |
23% |
||
Leraw |
Cenomanian |
108 |
23% |
||
Jabbah |
Cenomanian |
44 |
25% |
||
Jabbah Deep |
Cenomanian |
111 |
16% |
||
South FAN |
Cretaceous FAN |
134 |
18% |
110 |
24% |
Central FAN |
Cretaceous FAN |
96 |
17% |
||
Source: RISC (via FAR) and Cairn Energy Note: We consider the South FAN well sub-commercial and therefore valueless currently
Two questions occur to us on this exploration programme:
■
How many more exploration wells will be drilled in the blocks beyond FAN South and (we assume) Sirius/SNE North?
■
If successful, how much would discoveries be worth?
How many more exploration wells will be drilled?
In terms of material wells in the near term, we do not think many more will be drilled. Given the factors listed above, it is very useful to know (or at least have a good indication of) the sizes and characteristics of any other potential developments around the core field before the finalisation of the designs for the core development (and particularly the FPSO). Greater gas concentrations or different oil properties could require meaningful changes to a design that are best catered for in the initial construction. Changes to gas/water processing capacity are harder to make down the line.
The size of the prospects of the planned wells and the relatively low CoS for the South FAN suggests that there are few material candidates for exploration in coming years. The de-risking brought about by the SNE (and FAN) wells has only increased three of these prospects to above 30% CoS, while many are small and would not make a great deal of difference to FPSO design. Small tie-in exploration wells are possible in the fullness of time – we would not be surprised to see Spica drilled if Sirius is successful, but other prospects in the block may have to wait (indefinitely). The partners may look to deploy capex to other areas, especially if the CoS remains the same (relatively low).
|
Exhibit 18: Prospects around SNE and FAN |
|
|
Source: FAR |
What effect would an increase in reserves have on value?
An increase in recoverable barrels does not necessarily lead to a proportional increase in value for the development, primarily due to an extended life of reserves as they increase. According to data from the NPD, a doubling of reserves leads to an increase in maximum plateau rate of around 1.5x.
|
Exhibit 19: Initial recoverable barrels vs maximum production rate, Norway |
Exhibit 20: Production rates for UK and Norwegian fields between 350-1,200mmboe |
|
|
|
Source: NPD, Edison Investment Research |
Source: NPD, Department for Business, Energy and Industrial Strategy, Edison Investment Research Note: Many fields are still in production. Grey denotes UK fields, green Norwegian. |
|
Exhibit 19: Initial recoverable barrels vs maximum production rate, Norway |
|
|
Source: NPD, Edison Investment Research |
|
Exhibit 20: Production rates for UK and Norwegian fields between 350-1,200mmboe |
|
|
Source: NPD, Department for Business, Energy and Industrial Strategy, Edison Investment Research Note: Many fields are still in production. Grey denotes UK fields, green Norwegian. |
Value of exploration success
We model that any discovery would be developed as a tie-in to the core SNE development, with a delay of (at least) a number of years. Discoveries have a number of positive effects over and above the addition of more recoverable barrels:
■
They can be tied in to the core SNE development, using existing facilities to reduce opex and capex on a per barrel basis, potentially enabling more reserves to be extracted from the core field economically.
■
They can more fully utilise FPSO capacity over a longer time period; if found early enough, they can affect the design and capacity of the FPSO, increasing the most economic plateau, accelerating the recovery of the core SNE development and reducing opex and capex/bbl.
To balance these factors, discoveries are likely to be phased in to add to volumes as initial developments start to decline. This pushes out the development timelines for these volumes.
As a result, we model a notional 100mmbbl prospect (25% CoS and starting in around 2030) being worth around 3p/share to Cairn currently.
Increases to project economics
Cairn has stated that it believes opex for SNE development will be around $10/bbl. We believe that analysts may assume this to be life of field (LoF) opex, when in reality this is opex/bbl at an assumed 120kbd plateau.
“…..the guidance we gave at $10 a barrel is for – was the all-in OpEx at plateau rates of 120,000 barrels a day as an indicator. So [for life of field], I guess it might be a little bit higher than that. And of course…you may well structure a lease of the purchase option, and it’ll depend on the term and so on. So, it’s sort of guidance for plateau rate at those levels that we gave six months ago.” (James Smith, CFO, 8 March 2017. Transcript via Bloomberg)
This implies materially higher opex/bbl life of field (LoF) and therefore an increase in costs may need to be incorporated in many models. Our modelling assumes a LoF opex of $17/bbl. A $2/bbl movement in LoF opex affects our NPV12.5 by c 8%.
We note that the leasing contract with the FPSO will likely produce a level of fixed operating costs that are more immune from increasing/decreasing cost during the life of the field.
The logic and numbers of a farm-down
SNE is a very large development and will require billions to develop. Even with the cash flows from Kraken and Catcher, Cairn will need to assume material debt if it is to fund its current working interest to production. Our assumptions of around $10/bbl pre-first oil capex ($6.3bn) would arguably push Cairn to the limits of financing the project and expose it to similar risks that Premier Oil, Tullow Oil and EnQuest have experienced over the last few years given low oil prices. With 40% Cairn holds a greater working interest than the operator (to-be) Woodside.
We expect Cairn to look to farm-down part of its working interest to reduce these risks and enable a better balance to its portfolio. We would envisage a farm-down for capex carry, which would enable Cairn to reduce capital gains tax losses and keep material value in the project. Our modelled 15% reduction (from 40% to 25%) would allow an incoming partner a sizeable stake (especially if combined with a farm-down/sale of FAR’s interest) but would allow Cairn retain a material interest in the production cash flows.
Farm-down terms modelled on a buyer’s IRR basis
In the new oil cycle, and with lower oil prices, we believe that large companies have become and will continue to be more selective with acquisitions. Majors’ debt and dividend burdens require greater capital efficiency and (we think) more of an eye on downside protection. As a result, we believe that the deals executed at very favourable terms (for the seller) are gone, and buyers will require higher (and more protected) IRRs for purchases.
If we assume a 15% IRR is required for an incoming partner (Woodside’s purchase implied a 14% IRR), then Cairn would receive a $550m carry and retain c 87% of our current NPV12.5 project value (though given the funding and greater certainty of cash flows that a farm-down would bring, arguably the discount rate would fall). If the IRR required were 20%, this would fall to a $165m carry and retain c 68% of this value. We note that these assumed IRRs are the same or lower than many of those seen across a number of other deals we have tracked.
|
Exhibit 21: Summary of implied IRRs in deals |
|
|
Source: Edison Investment Research |
Catcher
Higher production rates than 50kbd entirely possible
Cairn still guides to plateau production of 50mb/d but the operator of Catcher (Premier) has made a number of positive comments about Catcher’s production potential in a recent results call:
“… the original plan was to run the field at about 50,000 barrels a day. The nameplate capacity of the FPSO is 60,000 plus 10%. And we’re working now to work out what would be the right way to flow our wells in the early days. We know we’ve got productive capacity hugely in excess at the outset of what the facility is capable of doing, but that wouldn’t be a sensible way to flow your well. So, we’ll take it cautiously in the first few months, but we’re expecting to be able to deliver far more than 50,000 barrels a day.” Robin Allan, PMO, Director North Sea
This was reinforced by the recent trading announcement text:
“As a result of the positive drilling results, Premier is optimistic that a higher plateau production rate can be achieved and a review is underway to understand the potential additional production capacity available from the FPSO.” 15 May 2017
Assuming a peak production rate of 60kbd would imply a 20% increase in revenues and cash flows. However, the effect on Cairn’s valuation is relatively muted, adding only around 4p to valuation – this was broadly the change in share price we saw on the day of the announcement in May.
|
Exhibit 22: Catcher capex savings |
Exhibit 23: Higher production rates possible |
|
|
|
Source: Cairn Energy |
Source: Cairn, Premier, Edison Investment Research |
|
Exhibit 22: Catcher capex savings |
|
|
Source: Cairn Energy |
|
Exhibit 23: Higher production rates possible |
|
|
Source: Cairn, Premier, Edison Investment Research |
But high costs hamper Catcher in the longer term
Catcher has suffered from delays and difficulties, and was sanctioned at a time of very high service and construction costs. As a result, the FPSO being built by BW Offshore is being leased at relatively high costs. The total opex bill is around $20/bbl at plateau according to Cairn; of this, the FPSO day rate accounts for $13/bbl (assuming the reported $2.3bn bill over 10 years due to BW Offshore), which will only increase on a $/bbl basis as production declines – we model that life of field opex is around $34/bbl. These high costs mean the fields will need to be abandoned when the field is still producing relatively high volumes (in 2025, we model cash flow break-even despite production rates of 9kbd and a Brent price assumption of $85/bbl at that time) unless (i) costs can be lowered or (ii) satellite/tie-in fields brought online.
The first would be subject to a negotiation with BW and its partner (it recently signed a deal with The Industrial and Commercial Bank of China). Given the initial term for the contract is seven years, we would imagine that Cairn would seek to reduce the fees to reduce costs and that BW would be open to negotiation to continue to make returns on its investment.
The latter seems unlikely, given that Carnaby/Bonneville discoveries will not be developed. The relinquishment of Carnaby (3km west of Burgman, discovered in 2012, 24° API, similar to Catcher, 28mmbbl OIP) and Bonneville (30% porosity, 25° API, 4km south of Burgman, 30mmbbl OIP) shows larger/better accumulations need to be found to be economic. Cairn has stated that the Laverda discovery may be a possible tie-in to Catcher, but with a 25mmbbl STOIIP (smaller than Bonneville and Carnaby), this may be marginal.
Skarfjell
Skarfjell was discovered in 2012 and appraisal wells were drilled in 2013 and January 2014, giving confidence on characteristics of the 100mmbbl light oil field. After a relatively long process, the partners have selected a tie-back to the Gjoa gas platform as the best option. This is not a simple job however, with offshore technology reporting that a 1,000 tonne topside will have to be constructed to be installed on the platform. To balance this, Gjoa is a large platform, with a production capacity of 87mb/d and 600mmcfd that sources power via electrical cable from shore so opex should be relatively modest.
We await further details on the development concept as the field moves towards FID in 2017/2018.
Druid/Drombeg
The Druid/Drombeg well is a high risk, high impact well targeting two large prospects planned to spud mid-2016. While Cairn believes the prospect has all the ingredients of a working hydrocarbon system, the basin is still largely unexplored and there is uncertainty over the phase of possible hydrocarbons. As we have written in Exploration watch: Wells to watch in 2017, if oil is found it could mean recoverable reserves of around 600mmbbl, while gas would equate to 3.3tcf.
Discovery of oil would be extremely valuable given Irish fiscal terms, but work indicates that a gas discovery would be marginal unless very large, given the limited (and expensive) development options for gas so far from existing infrastructure.
Mexico
On 20 June, Cairn announced that it was awarded interest in two offshore blocks in Mexico (Block 7 and Block 9). The company has already identified “multiple prospects in a variety of play types”. The area showed its promise with the July announcement that Premier Oil (and partners) had discovered net oil bearing reservoir containing 1bn bbls of OIP. Partner and operator Talos estimates OIP of between 1.4-2.0bnbbls. We have written extensively about exploration wells in 2017 and we encourage readers to visit our blog.
Costs of capital
A key component of Cairn’s valuation is the cost of capital. We believe there are three main methods that analysts use to get to arrive at a WACC: (i) 10% as a consistent assumption across coverage; (ii) use CAPM, beta-derived cost of equity to add to debt facilities to arrive at a WACC; or (iii) a country-specific WACC.
We assume a discount rate of 12.5% across the portfolio. Given our analysis of the costs of capital of the sector, a 10% rate is only useful for broad brush comparative work against other companies, and is certainly too low given current market dynamics. A CAPM based assessment of WACC uses historic data to derive beta. There is a case to suggest that the beta could increase (see section below), and WACC may increase, at least in the short term. The trajectory of oil prices over the last two years (the period over which many calculate beta) may also not be consistent with future price movements, giving an unrepresentative estimate.
Cost of other instruments
As we have blogged (www.edisoninvestmentresearch.com/oils-blog), we are puzzled by Cairn’s choice to seek $75m of funding for the last stages of Kraken development. The deal dictates that Flowstream will receive 4.5% of Kraken’s production until it achieves an IRR of 10%, then 1.35% until an IRR of 15% is achieved, after which it falls to 0.675% of production revenues. Based on our assumed production profile, this would give Flowstream an IRR of around 20% at the forward curve in March (see Exhibit 24) and 25% at our assumed long-term price of $70/bbl.
|
Exhibit 24: IRRs for Flowstream for Kraken funding |
|
|
Source: Edison Investment Research, Bloomberg |
Cairn is not desperate for capital and giving away 20% IRR to a funder is only really understandable in the context of the much higher IRR it gained from the additional Kraken stake it acquired at low cost. Even so, it is puzzling.
Reduced cash increases beta
We note that 2017 could see Cairn’s net cash position almost disappear as final capex is spent before Catcher and Kraken come online and exploration/appraisal uses further cash. This means the damping effect of the cash on the beta fades, which could lead to increasing beta over time (year end 2016 cash was equivalent to 46p/share or around 25% of market cap vs 82p/share year end 2015). Cairn has been substantially more cushioned from the financial distress felt by EnQuest, Premier and Tullow, but we would expect Cairn’s beta to start to move toward these peers as their distress reduces and Cairn’s excess cash is burnt off – especially if the Cairn India stake continues to be heavily discounted by the market. The current beta of the peer group is around 1.4x with the last decade averaging 1.2x.
The damping effect of post-tax debt costs has the potential to offset this increase, although based on our modelling, the company will not require substantial amounts of debt unless Cairn returns cash to shareholders and/or develops a larger SNE or Druid/Drombeg (assuming success).
|
Exhibit 25: E&Ps’ WACCs (CAPM derived) |
Exhibit 26: E&Ps’ betas |
|
|
|
Source: Bloomberg |
Source: Bloomberg Note: Light grey is Cairn, dark grey is median of TLW, OPHR, PMO, SIA, GENL, NOG, ENQ |
|
Exhibit 25: E&Ps’ WACCs (CAPM derived) |
|
|
Source: Bloomberg |
|
Exhibit 26: E&Ps’ betas |
|
|
Source: Bloomberg Note: Light grey is Cairn, dark grey is median of TLW, OPHR, PMO, SIA, GENL, NOG, ENQ |
If we assume the beta increases towards historical averages, and no debt is incurred (beyond the financing of Flowstream), the WACC would increase from 10.3% to 10.9% (assuming risk premium of 6.25%, beta of 1.2x, risk free rate of 2.33%). Cairn would need to take on $150m of (assumed) 6% debt to reduce it back to 10.3%. We note here we are using market values of equity at the current share price.
|
Exhibit 27: Correlation between Cairn share price and oil prices (in £/bbl) vs Cairn’s assets in cash |
|
|
Source: Edison Investment Research, Bloomberg |
|
Exhibit 28: Share price sensitivity to oil price (£/bbl), since January 2015 |
Exhibit 29: Share price sensitivity to oil price (£/bbl), since January 2015 |
|
|
|
Source: Bloomberg, Edison Investment Research |
|
Exhibit 28: Share price sensitivity to oil price (£/bbl), since January 2015 |
|
|
Source: Bloomberg, Edison Investment Research |
|
Exhibit 29: Share price sensitivity to oil price (£/bbl), since January 2015 |
|
|
Source: Bloomberg, Edison Investment Research |
Cairn India
A major uncertainty for investors of Cairn is the value of the Cairn India stake, given the tax demand from India. In the week that it was announced, Cairn’s shares dropped significantly and the market does not attribute the full value of its stake given the ongoing litigation/arbitration. We are not legal experts and do not seek to make a judgement about the direction of the case, but believe that investors would be interested in more detail of the case, especially as the final arbitration hearing nears (January 2018).
Cairn received an assessment from the Indian tax authorities for INR102bn (c $1.5bn) plus interest (totalling INR188bn or $2.8bn) relating to the intra-grouping restructuring prior to the IPO of Cairn India in 2006. The tax demand related to a retrospective amendment to tax introduced in 2012 (see Vodafone section) and Cairn is meanwhile prevented from selling the assets. A timeline is below; evidential hearings are due to be heard in the Hague in January 2018. Cairn is confident that it will be successful.
Cairn Energy was not the only company to be asked to pay retrospective tax bills. Vodafone and Nokia were issued with tax demands, and it may be interesting for investors to read the progress of these disputes (see below). Vodafone successfully defended its view that no tax was due only for new legislation to be introduced and a new demand issued, while the Nokia tax demand contributed to the shuttering of the factory affected and the loss of thousands of jobs.
Cairn India tax dispute timelines
24 January 2014 – Cairn contacted by Indian tax authorities for taxes alleged to be due relating to the year ending March 2007.
31 January 2014 – Cairn indicates that the tax demand is in respect of amendments introduced in the 2012 Indian Tax Finance Act, which seeks “to tax prior year transactions under retrospective legislation”. Cairn is therefore being asked to pay taxes due on a reorganisation made in 2006, but for which the allegedly applicable law was passed in 2012. Cairn’s 9.8% stake in Cairn India was restricted.
10 March 2015 – Cairn received “a draft assessment order from the Indian Income Tax Department in relation to the Cairn Group restructuring that was undertaken in 2006 prior to the CIL IPO, to the amount of INR 102.4 billion (US$1.6billion) plus any applicable interest and penalties.” Cairn appealed against the draft assessment and filed a Notice of Dispute under The UK-India Investment Treaty in order to protect its legal position and shareholder interests. Cairn appointed an arbitrator and awaits the government of India to name its appointment to the international panel.
According to the end of year results, “Cairn has asked the arbitration panel either to order India to withdraw its unlawful tax demand and compensate Cairn for the harm suffered by the seizure of the CIL shares, being not less than US$1.1bn (plus costs); or, if the tax demand remains in place, compensate Cairn for the quantum of the tax assessment and the harm suffered by the seizure of the CIL shares, being together not less than US$5.6bn (plus costs)”.
We had expected over $100m of dividends from Cairn India after these amounts had been cleared to be paid to Cairn. However, in June 2017 the Indian tax department sought the cash in payment of the outstanding tax demand – this seems to be a reversal of an earlier position. In a recent RNS Cairn noted that on “9 June 2017, the tribunal issued a formal order memorialising the numerous confirmations from the GoI that the dividends were no longer restricted”.
Costs to defend tax case
The Cairn action against the Republic of India on the tax case is likely to add materially to the costs incurred in 2017/2018. According to press reports, Cairn has engaged Harish Salve, a former solicitor general of India (1999-2002) and an eminent QC who has previously represented Reliance Industries, Tata, ITC and Vodafone (see below), among others.
We reference the costs that Gulf Keystone incurred in its successful defence of the litigation in 2012/2013 (over its interests in Kurdistan), where it sought to recoup £23m (US$30m at current FX rates). Cairn has already spent around $15m. It is not hard to imagine that costs may be of a similar magnitude overall, especially if the case runs longer than expected.
Valuation approach
We are not experts in Indian tax law, and do not seek to make an assertion on the outcome of the case. Our broad approach is to value the Cairn India stake at a notional 50% of its current value adjusted for time value of money and a 10% discount to allow for a sale if it so chooses. However, we note that given the circumstances of the arbitration, this implicitly undervalues a 50:50 outcome, mainly due to the damages that Cairn is claiming.
For this analysis, we assume:
1.
if the judgement goes against Cairn, only Cairn’s current holding is at risk, ie that no assets of the parent company are at risk as Cairn asserts (the Indian tax authorities raised the dispute against Cairn UK Holdings, a subsidiary of Cairn Energy that had as its principal asset the shares in Cairn India (now Vendata Ltd);
2.
that the losing party pays both costs, which could be tens of millions of dollars. We include arbitration fees, which (using ICC guidance on its mediations) we believe could be $1.75m;
3.
the arbitration process will take some time; a result is expected within a few months of the final hearing, but we tentatively (conservatively) assume that a judgement will be delivered in H218, requiring some discounting for time value of money;
4.
Cairn may win its counter claim for $1.1bn, equal to the value of the shares at the time of the tax demand; and
5.
the value of the shares held when the judgement is made (whatever it is) is uncertain, especially given the merger with Vedanta. We do not model/value Vedanta/Cairn India and therefore assume that the shares are priced as at today and, given that the judgement is a year away, we discount this value.
Using these inputs, our broad-brush approach implies that Cairn has a 35% chance of winning and receiving full damages. We note that if Cairn is successful in fully claiming the $1.1bn it seeks (with no counter judgement) this would be equal to 150p/share and likely trigger a significant increase in share price.
Exhibit 30: India tax dispute assumptions and implications, $m unless stated
Judgement for Cairn |
Judgement against Cairn |
Comments |
|||||
Note: Discounted value of Cairn India/Vedanta shares retained by Cairn |
722 |
0 |
|||||
. |
|||||||
Discounted value of damages claimed by Cairn ($1.1bn headline) |
978 |
0 |
|||||
Discounted costs recouped/(paid) |
13 |
(29) |
|||||
Total |
991 |
(29) |
|||||
Equivalent value per share |
135p/share |
(4p/share) |
|||||
Value assumed in valuation |
324 |
||||||
Equivalent value per share |
44p/share |
||||||
Implied % chance of success if full damages awarded |
35% |
||||||
Implied % chance of success if shares are unfrozen and no damages awarded |
46% |
||||||
Source: Edison Investment Research. Note: here we assume that the share price is unchanged, but that sale is not possible for a year and therefore we discount the value. We assume that the damages claim, if won, is also discounted by one year.
Recent update
In March 2017, the Indian tax authorities (the Central Board of Direct Taxes) issued a circular offering to waiver the interest due on tax demands due to retrospective tax demands (such as Vodafone or Cairn Energy) as long as the principal demand is fully paid and all appeals against the government are withdrawn. Neither Vodafone nor Cairn Energy have taken up this offer.
Vodafone case
The text below is an edited version of text from Vodafone’s half-year financial results.
In August and September 2007, Vodafone received notices from the Indian tax authority alleging that it was liable for withholding tax due on its acquisition of assets from Hutchinson Telecom – essentially retrospectively stating that it had to pay capital gains on an asset that it had just acquired (not sold). After a number of judgements against it, in January 2012 the Supreme Court agreed with Vodafone that the transaction was not taxable. On 20 March 2012 the Indian Government returned Vodafone’s deposit of INR25 billion and released the guarantee for INR85bn, which was based on the demand for payment issued by the Indian tax authority in October 2010, for tax of INR79bn plus interest.
On 28 May 2012, India passed the Finance Act 2012, “which contained provisions intended to tax any gain on transfer of shares in a non-Indian company, which derives substantial value from underlying Indian assets, such as [Vodafone’s] transaction… in 2007. Further it seeks to subject a purchaser, such as [Vodafone], to a retrospective obligation to withhold tax.” Our interpretation is that after India lost the case, it passed new laws to allow the retrospective tax collection from Vodafone, which then received a letter in early 2013 of the tax demand raised prior to the Indian Supreme Court’s judgement and purporting to update the interest element to a total amount of INR142bn.
In April 2014, [Vodafone] formally commenced arbitration proceedings, invoking a Netherlands-Indian treaty. In June 2016, the tribunal was fully constituted. Vodafone continues to receive tax demands – the most recent was in February 2016 for INR 221bn.
Nokia India case
In March 2013, Nokia received a tax demand alleging it had failed to withhold taxes for payments made to the parent company for supplying the software for the phones made in India (the factory once employed around 10,000 people and produced 15 million handsets per month). These payments are considered by India as royalties and are therefore taxable. Nokia indicated that no prior warning was given and that nothing was illegal, noting the transfer pricing policy had been regularly reviewed by Indian and Finnish tax authorities.
In May 2013, Finland invoked the Mutual Agreement Procedure asking authorities to seek an agreement under double tax avoidance agreements between the countries. In July 2013, Nokia’s devices and services division was sold to Microsoft, leading India to freeze all of Nokia India assets. These were unfrozen after Nokia suggested it paid a deposit in December 2013 – the sale to Microsoft can proceed. In February 2014, the High Court then reversed this decision, committing Nokia to paying the taxes without rights to appeal. Nokia India announced it would appeal this decision. The factory in Chennai that is the subject of the tax demand is excluded from the deal and the sale to Microsoft proceeds. In October/November 2014, the factory shut down.
The Indian Express reported the outstanding tax claims in 2014 to be Rs 21,153 crore (US$3bn)
In January 2017, Foxconn was reported to be discussing plans to restart the factory, and the tax situation had still not been cleared.
Other companies reported to be in dispute with the Indian tax authorities in 2014 included IBM, Shell India, SABMiller, Gillette, AT&T and Genpact India.
Valuation
We have substantially revisited our modelling, assumptions and expectations for Cairn, producing a core NAV of 159p/share, contingent NAV of 225p/share and RENAV of 255p/share.
Our main modelling assumptions are a discount rate of 12.5% across the portfolio and a $70/bbl long-term oil price. However, the table below gives investors an idea of how the valuation would change under different oil prices and discount rates.
Exhibit 31: NAV summary
Asset |
Shares: 583m |
|
|
Recoverable reserves |
|
Net risked value |
|
|||||
Country |
WI |
CoS |
Gross |
Net |
NPV |
US$m |
p/share |
|
|
@$60/bbl |
||
|
% |
% |
mmboe |
$/boe |
|
12.5% |
10.0% |
15.0% |
12.5% |
|||
Net (Debt) Cash end-Dec 2016 |
335 |
46 |
46 |
46 |
46 |
|||||||
Dividends from Cairn India/Vedanta to be released – risked @ 50% and discounted |
47% |
++ |
49 |
7 |
7 |
7 |
7 |
|||||
Value of Cairn India stake (now Vedanta) |
89% |
* |
673 |
92 |
96 |
89 |
92 |
|||||
Tax claim on Cairn India - assume overall to be half of total stake value |
(337) |
(46) |
(48) |
(44) |
(46) |
|||||||
Cairn counter claim against India |
0 |
0 |
0 |
0 |
0 |
|||||||
Costs to litigate Indian tax case (2017/18) |
(13) |
(2) |
(2) |
(2) |
(2) |
|||||||
G&A (3 yrs) |
(52) |
(7) |
(7) |
(7) |
(7) |
|||||||
Exploration capex in 2017 |
(137) |
(19) |
(19) |
(19) |
(19) |
|||||||
Development |
|
|||||||||||
Kraken |
UK |
29.5% |
95% |
140 |
41 |
10.6 |
416 |
57 |
63 |
51 |
47 |
|
Catcher |
UK |
20% |
90% |
100 |
20 |
12.8 |
230 |
31 |
35 |
29 |
25 |
|
Core NAV = Cash + Development |
|
|
|
240 |
61 |
|
1,165 |
159 |
171 |
149 |
143 |
|
Contingent |
||||||||||||
SNE (assumes farm-down) |
Senegal |
25% |
60% |
641 |
160 |
4.7 |
456 |
62 |
95 |
41 |
45 |
|
Skarfjell |
Norway |
20% |
60% |
100 |
20 |
2.4 |
28 |
4 |
6 |
2 |
3 |
|
Contingent resources |
|
|
|
981 |
242 |
|
1,650 |
225 |
271 |
192 |
191 |
|
Druid/Drombeg |
Ireland |
30% |
20% |
601 |
180 |
5.4 |
195 |
27 |
40 |
18 |
18 |
|
SNE North/Sirius |
Senegal |
25% |
36% |
80 |
20 |
2.9 |
21 |
3 |
5 |
1 |
2 |
|
Total RENAV |
|
|
|
1,662 |
442 |
|
1,866 |
255 |
316 |
211 |
211 |
|
Source: Edison Investment Research. Note: We explicitly assume that Cairn notionally reduces its stake in SNE from 40% WI to 25% WI in return for a development carry (see section on farm-out for logic). *We arrive at 89% by assuming a present value of the value of the stake (if sold after the end of arbitration in one year’s time. For the Indian tax claim, we do not take a position on the judgement, so assume that there is a 50:50 chance of judgement against, hence use a 50% notional assertion of Cairn stake value for the tax claim. In reality the judgement will be a binary outcome ++ 47% risking on Cairn dividend is a 50% risk of payment discounted by six months.
Sensitivities to oil price
Given the oil price variability and the levels at which it has remained over the last year, investors may have different oil price expectations to those we assume. As a result, they may find it useful to see the impact of using different price decks and especially how these affect the valuation in coming years. The chart below indicates that the contingent NAV (which explicitly excludes any value for the Cairn India/Vedanta stake/dividends and any upside from exploration) only exceeds the share price now if a $60/bbl long-term price is assumed. If a long-term price of below $60/bbl is expected, the company value may take a number of years to reach the share price. If we were to include a risked value for the Cairn India/Vedanta stake, this would reduce the “break-even” oil price for investment markedly.
|
Exhibit 32: Sensitivity of valuation over time to oil price |
|
|
Source: Edison Investment Research Note: the oil price noted is for 2017, which we assume inflates at 2.5% per annum over time. We explicitly exclude any value for Cairn India/Vedanta. Dashed line: current share price. |
Financials
At December 2016, Cairn held cash of $335m and we expect cash inflows from production at Kraken (from mid-year). We had expected over $100m of dividends from Cairn India after these amounts had been cleared to be paid to Cairn. However, in June the Indian tax department sought the cash in payment of the outstanding tax demand – this seems to be a reversal of an earlier position. In a recent RNS Cairn noted that on “9 June 2017, the tribunal issued a formal order memorialising the numerous confirmations from the GoI that the dividends were no longer restricted”.
Additionally, the company has access to RBL funding estimated to be $210m by the end of 2017 (and $350-400m at peak) and access to extension of the Flowstream financing if it chooses. This means it is well placed to fund the remaining development costs for Kraken and Catcher while furthering the appraisal of SNE and PDO of Skarfjell as they move towards FID.
Further out, production cash flows and debt could be enough to cover increasing capital requirements as SNE and Skarfjell start construction, but we believe that Cairn will look to reduce risk by farming down. SNE is the obvious candidate given Cairn’s arguably outsized working interest and large pre-oil capex requirements, although a sale of Skarfjell (its only asset in Norway) would also make sense too – Norwegian assets are more tax efficient if held within a portfolio.
Exhibit 33: Financial summary
Accounts: IFRS; year end 31 December; US$m |
|
2014 |
2015 |
2016 |
2017e |
2018e |
|
Total revenues |
|
0 |
0 |
0 |
59 |
402 |
|
Cost of sales |
|
(3) |
(3) |
(3) |
(745) |
(243) |
|
Gross profit |
|
(3) |
(3) |
(3) |
(686) |
159 |
|
SG&A (expenses) |
|
(40) |
(7) |
(5) |
(5) |
(5) |
|
Pre-award and exploration costs |
|
(263) |
(133) |
(88) |
(92) |
(33) |
|
Other income/(expense) |
|
0 |
0 |
0 |
0 |
0 |
|
Exceptionals and adjustments |
|
(66) |
(36) |
(53) |
(20) |
(25) |
|
Depreciation and amortisation |
|
0 |
0 |
0 |
0 |
0 |
|
Reported EBIT |
|
(372) |
(179) |
(148) |
(803) |
95 |
|
Finance income/(expense) |
|
4 |
(1) |
(3) |
11 |
12 |
|
Other income/(expense) |
|
0 |
0 |
0 |
0 |
0 |
|
Exceptionals and adjustments |
|
(190) |
(319) |
0 |
0 |
0 |
|
Reported PBT |
|
|
(559) |
(498) |
(152) |
(792) |
107 |
Income tax expense (includes exceptionals) |
|
|
178 |
(18) |
57 |
0 |
0 |
Reported net income |
|
|
(381) |
(516) |
(95) |
(792) |
107 |
Basic average number of shares, m |
|
|
573 |
571 |
583 |
583 |
583 |
Basic EPS (c) |
|
|
(66.5) |
(90.3) |
(16.6) |
(135.8) |
18.3 |
|
|
|
|
|
|
|
|
Balance sheet |
|
|
|||||
Property, plant and equipment |
|
|
473 |
584 |
737 |
298 |
347 |
Goodwill |
|
|
0 |
0 |
0 |
0 |
0 |
Intangible assets |
|
|
562 |
555 |
590 |
679 |
706 |
Other non-current assets |
|
|
809 |
384 |
656 |
656 |
656 |
Total non-current assets |
|
|
1,844 |
1,523 |
1,983 |
1,634 |
1,709 |
Cash and equivalents |
|
|
874 |
603 |
335 |
18 |
98 |
Inventories |
|
|
0 |
1 |
0 |
25 |
26 |
Trade and other receivables |
|
|
60 |
149 |
114 |
114 |
114 |
Other current assets |
|
|
239 |
33 |
26 |
26 |
26 |
Total current assets |
|
|
1,173 |
785 |
475 |
183 |
263 |
Non-current loans and borrowings |
|
|
0 |
0 |
0 |
0 |
0 |
Other non-current liabilities |
|
|
65 |
89 |
145 |
166 |
182 |
Total non-current liabilities |
|
|
65 |
89 |
145 |
166 |
182 |
Trade and other payables |
|
|
278 |
120 |
123 |
126 |
131 |
Current loans and borrowings |
|
|
0 |
0 |
0 |
0 |
0 |
Other current liabilities |
|
|
12 |
0 |
0 |
0 |
0 |
Total current liabilities |
|
|
290 |
120 |
123 |
126 |
131 |
Equity attributable to company |
|
|
2,663 |
2,099 |
2,190 |
1,525 |
1,659 |
Non-controlling interest |
|
|
0 |
0 |
0 |
0 |
0 |
|
|
|
|
|
|
|
|
Cashflow statement |
|
|
|||||
Profit before tax |
|
|
(559) |
(498) |
(152) |
(792) |
107 |
Depreciation and amortisation |
|
|
3 |
3 |
3 |
710 |
89 |
Share based payments |
|
|
21 |
15 |
17 |
15 |
15 |
Other adjustments |
|
|
448 |
432 |
99 |
69 |
10 |
Movements in working capital |
|
|
11 |
8 |
6 |
(22) |
4 |
Interest paid / received |
|
|
0 |
0 |
0 |
0 |
0 |
Income taxes paid |
|
|
66 |
24 |
7 |
0 |
0 |
Cash from operations (CFO) |
|
|
(9) |
(16) |
(21) |
(21) |
226 |
Capex |
|
|
(376) |
(323) |
(274) |
(408) |
(158) |
Acquisitions & disposals net |
|
|
95 |
53 |
0 |
0 |
0 |
Other investing activities |
|
|
(4) |
33 |
27 |
112 |
12 |
Cash used in investing activities (CFIA) |
|
(286) |
(237) |
(247) |
(296) |
(146) |
|
Net proceeds from issue of shares |
|
|
0 |
0 |
0 |
0 |
0 |
Movements in debt |
|
|
(53) |
0 |
0 |
0 |
0 |
Other financing activities |
|
|
(83) |
(6) |
(4) |
0 |
0 |
Cash from financing activities (CFF) |
|
(137) |
(6) |
(4) |
0 |
0 |
|
Increase/(decrease) in cash and equivalents |
|
|
(432) |
(259) |
(272) |
(317) |
80 |
Currency translation differences and other |
|
|
(8) |
(7) |
4 |
0 |
0 |
Cash and equivalents at end of period |
|
869 |
603 |
335 |
18 |
98 |
|
Net (debt) cash |
|
|
874 |
603 |
335 |
18 |
98 |
Movement in net (debt) cash over period |
|
|
(389) |
(272) |
(268) |
(317) |
80 |
Source: Edison Investment Research, Cairn Energy accounts
|
|
Allium Medical has made significant progress across business lines. The safety monitoring board has recommended continuing the study of Gardia’s embolic protection device; clinical data will be reported by end Q317. A clinical trial of its urological stents in the local population will not be necessary for approval in China; this is in line with our expectations. We expect sales to start in 2018 via a NIS58m eight-year distribution agreement. Following positive preclinical data, Allevetix is on track to start a clinical trial by year-end 2017. We forecast revenue CAGR of 41% in 2016-20e and expect the company to break even in 2020. Our valuation is NIS1.95-2.08/share.