Last close As at 05/08/2026
—
— 0.00 (0.00%)
Market capitalisation
—
Research: Healthcare
SymBio announced in October that it has begun preparations to establish its own sales organization to market Treakisym and other anticancer drugs in Japan after the marketing agreement with Eisai expires in December 2020. The announcement validates our decision earlier this year to adopt self-commercialization in Japan in our base-case valuation model. Self-commercialization will improve operating margins and allow it to establish a team of in-house experts to communicate the benefits of Treakisym (and rigosertib if approved) to healthcare providers. Our valuation increases to $225m as we roll forward the DCF model; our earnings forecasts and valuation assumptions are unchanged.
Written by
SymBio Pharmaceuticals |
Preparing to establish own sales organization |
Strategy update |
Pharma & biotech |
12 December 2018 |
ADR research
Business description
Next events
Analysts
SymBio Pharmaceuticals is a research client of Edison Investment Research Limited |
|||||||||||||||||||||||||||||||||||
SymBio announced in October that it has begun preparations to establish its own sales organization to market Treakisym and other anticancer drugs in Japan after the marketing agreement with Eisai expires in December 2020. The announcement validates our decision earlier this year to adopt self-commercialization in Japan in our base-case valuation model. Self-commercialization will improve operating margins and allow it to establish a team of in-house experts to communicate the benefits of Treakisym (and rigosertib if approved) to healthcare providers. Our valuation increases to $225m as we roll forward the DCF model; our earnings forecasts and valuation assumptions are unchanged.
Year end |
Revenue (US$m) |
PTP |
EPADR |
DPADR |
P/E |
Gross yield |
12/16 |
21.0 |
(20.5) |
(0.52) |
0.0 |
N/A |
N/A |
12/17 |
30.5 |
(35.2) |
(0.71) |
0.0 |
N/A |
N/A |
12/18e |
37.2 |
(26.8) |
(0.41) |
0.0 |
N/A |
N/A |
12/19e |
38.3 |
(32.0) |
(0.41) |
0.0 |
N/A |
N/A |
Note: Converted at ¥113 to US$1.
Liquid formulations and DLBCL justify own sales
The extension of Treakisym’s lifecycle through the in-license of liquid formulations from Eagle Pharmaceuticals plus the potential for the r/r diffuse large B-cell lymphoma (DLBCL) Phase III to drive further sales growth from 2021 (if successful) support the rationale for SymBio to establish its own salesforce to market Treakisym and other drugs. Treakisym in-market sales grew by ~61% to $67m in 2017 (on an NHI price basis), supported by two new indications approved in 2016. We model Treakisym sales of $95m in FY21, allowing SymBio to attain profitability in the first year of self-commercialization.
New Treakisym indications, rigosertib to drive growth
Treakisym (bendamustine hydrochloride) plus rituximab is already established as standard-of-care for malignant lymphoma in a number of settings. SymBio initiated a Phase III study in r/r DLBCL in August 2017, with top-line data expected in 2019. We estimate the r/r DLBCL indication could double the peak sales potential for Treakisym, if approved. In July SymBio filed for approval of Treakisym as part of a pre-treatment regimen prior to CAR-T therapy with Kymriah. In addition, SymBio aims to recruit 40 Japanese patients, as part of partner Onconova’s 360-patient global Phase III trial of intravenous (iv) rigosertib in r/r higher-risk myelodysplastic syndromes (MDS) and plans to file for approval in Japan in 2021.
Valuation: $225m (¥25.5bn) or $2.9/ADR
We roll forward our DCF model and increase our risk-adjusted valuation to $225m (¥25,469m) (vs $211m). The extra 20m shares issued under the 45th stock acquisition rights (raising $22.9m) sees value per share decline to $2.9/ADR (vs $3.6/ADR). Our valuation assumptions and earnings forecasts are unchanged, as we already adopted self-commercialization in Japan as the base-case valuation scenario in in our April report. SymBio has reaffirmed its guidance, which already allowed for expenses related to establishing its own salesforce.
Establishing own salesforce for revitalized Treakisym
SymBio acquired the rights to develop and commercialize Treakisym from Astellas in Japan (2005) and subsequently in China/Hong Kong, Korea, Taiwan and Singapore (April 2007). Treakisym is approved in Japan for the treatment of the hematological cancers chronic lymphocytic leukemia (CLL) and low-grade non-Hodgkin’s lymphoma and mantle cell lymphoma (lg NHL/MCL). Orphan exclusivity on the currently-marketed freeze dried powder (FD) Treakisym product expires in October 2020.
Treakisym is marketed by Eisai in Japan, Singapore and South Korea under a business partnership agreement that expires in December 2020.
In September 2017, SymBio in-licensed two liquid formulations of bendamustine HCl (Treakisym) from Eagle Pharmaceuticals (Eagle). The new formulations are protected by patents that extend to 2031, which will add around 10 years to the Treakisym product lifecycle compared to the company’s marketed FD powder Treakisym product. The new formulations are more convenient for healthcare workers and for patients, which will be important advantages as SymBio seeks to switch users away from the FD formulation.
The extended period of patent protection for the liquid formulations has made investment in a Phase III study of Treakisym in the DLBCL indication an attractive proposition for SymBio. DLBCL comprises around 45% of NHL cases in Japan, and we estimate that approval in this indication could double the sales potential of Treakisym.
Taken together, the patented liquid formulations and the DLCBL Phase III justify SymBio investing in establishing its own sales organization to market Treakisym and other drugs such as rigosertib (if approved), in our view. We estimate that SymBio could earn an operating profit margin of 50% of net sales of Treakisym under a self-commercialization model, compared to an estimated margin of 10–12% of in-market top-line sales under the arrangement with Eisai.
Own sales organization provides leverage for new products
SymBio has noted that having its own sales organization in place will enable it to better understand and respond to market needs, positioning it to deliver the benefits of Treakisym to healthcare providers and patients. Treakisym is used in the hematology departments of approximately 900 institutions across Japan, with the top 400 institutions accounting for ~90% of sales. If rigosertib is approved for treating MDS, the top 400 institutions would similarly be expected to account for the majority of use. Therefore, SymBio would be in a position to market rigosertib (if approved) through its own sales organization for minimal additional cost. The same operation leverage would apply were SymBio to in-license or develop other hematological drugs. Establishing its own sales organization will be an important step towards achieving SymBio’s vision of establishing itself as a leading specialty pharma company.
Pipeline progress
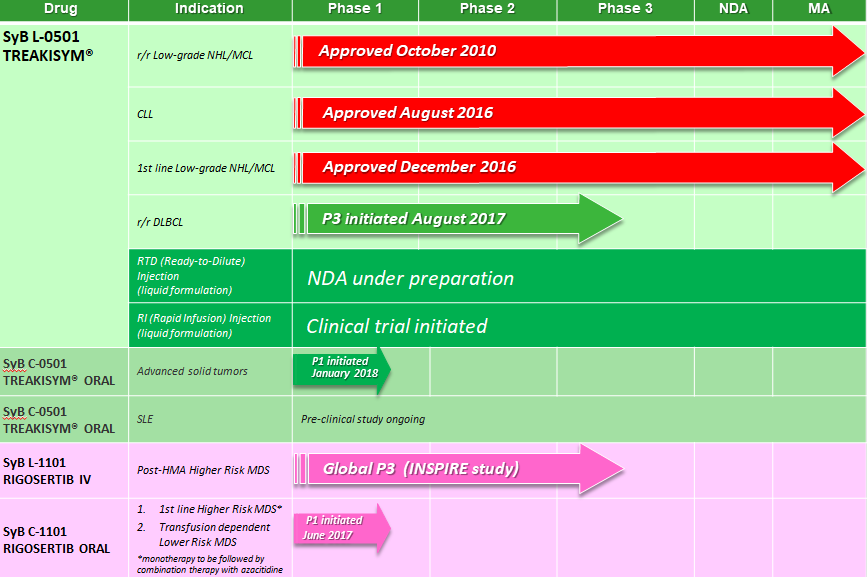
Exhibit 1 summarizes the status of SymBio’s product pipeline. The main areas of focus are:
■
Obtaining approval for the two liquid formulations of Treakisym to extend the product lifecycle out to 2031.
■
Completion of the Phase III study of Treakisym in DLBCL, which could potentially double the sales potential of Treakisym.
■
Participating in the global Phase III study of iv rigosertib in MDS, which could become SymBio’s second product for hematological cancers.
■
Completion of ongoing Phase I studies of oral formulations of Treakisym and rigosertib, which could lead to development of additional indications for both drugs.
|
Exhibit 1: Status of the SymBio pipeline |
|
|
Source: SymBio |
Key news anticipated for SymBio in 2019 includes:
■
Top-line data from the DLBCL and rigosertib Phase III studies.
■
Filing for approval of the ready-to-dilute (RTD) liquid Treakisym formulation.
■
Update on the clinical study of the rapid infusion Treakisym formulation.
Liquid formulations extend Treakisym lifecycle
The new liquid formulations of Treakisym that SymBio in-licensed from Eagle are more convenient for healthcare workers and for patients.
The first in-licensed product is an RTD liquid formulation that will significantly reduce dose preparation time, making it easier and safer for health professionals. This compares to the FD Treakisym, which has to be reconstituted before administration, a time-consuming process that carries the risk of exposing healthcare workers to cytotoxic powders and vapors.
The second in-licensed product is a rapid-infusion (RI) formulation that will cut drug infusion time to 10 minutes from 60 minutes for the current Treakisym product (and the RTD formulation).
Exhibit 2 illustrates the differences in use between the current FD Treakisym and the new liquid RTD and RI formulations.
|
Exhibit 2: Comparison of the current FD powder and new liquid formulations |
|
|
Source: SymBio |
Liquid formulations aim to maintain SymBio’s market share
We expect the approval pathway for the RTD Treakisym formulation to be relatively straightforward, as the same dose of drug is administered to patients in the same way, with the only difference being the way the dose is prepared. SymBio is aiming to launch the RTD product in H121, which would allow it to be well established in the marketplace before the expected entry of the first FD generics in 2022.
The RI product represents a greater change to the current treatment protocols, so approval of this product is expected to take longer – we model a 95% chance of a launch by the start of 2023. Given the greater convenience for patients of the rapid 10-minute infusion with the RI formulation, we expect over 95% of patients to be switched to this product.
DLBCL indication could substantially increase Treakisym sales
SymBio is seeking to add another indication for the treatment of r/r DLBCL, an intermediate or high-risk form of NHL, with Treakisym. It commenced a Phase III trial to confirm the safety and efficacy of Treakisym plus rituximab in r/r DLBCL in August 2017. SymBio’s mid-range plan aims to file an NDA in H120. We model Phase III costs of $18m and a potential launch in H221.
DLBCL is a rapidly growing, intermediate or high-risk form of NHL, in contrast to the slower-growing indolent or low-risk lymphomas that are included in the current approvals for Treakisym. There is currently no standard chemotherapy for the treatment of DLBCL.
DLBCL is the most common form of NHL and is estimated to represent 45% of NHL cases in Japan1. Based on epidemiology studies1 and Globocan data, we estimate there will be 35,500 new cases of NHL and 16,000 new cases of DLBCL in Japan in 2020. Assuming that 70% of DLBCL patients progress to receive second-line therapy, we forecast a target market of 11,200 second-line (r/r) DLBCL patients per year in Japan by 2020.
Chihara et al; British Journal of Haematology, 2014, 164, 536–545; doi: 10.1111/bjh.12659
The patient market of 11,200 r/r DLBCL patients in Japan is almost as large as the combined market of ~12,500 patients for the currently approved indications for Treakisym in CLL and first-line and r/r low-grade NHL and MCL patients. Given the high unmet need for this patient group, we model a 50% market penetration and peak sales (net sales after discounts) of $85m for DLBCL vs $84m for the currently approved indications.
Iv rigosertib a potential second product for SymBio
SymBio in-licensed rigosertib (iv and oral formulations, Japan and Korean rights) from Onconova in 2011 for MDS, a rare blood cancer. SymBio is contributing patients from Japan to the global Phase III INSPIRE trial of iv rigosertib for the treatment of second-line higher-risk MDS (HR-MDS); as of end of July 2018 it had already enrolled 36 patients in the study.
Onconova announced in January 2018 that it is moving forward with the study as it had been cleared to continue following an interim analysis by the independent data monitoring committee (DMC). Following a pre-planned sample size re-estimation conducted by the DMC as part of the interim analysis, the target enrolment was expanded from 225 to 360 patients, with the aim of increasing the power of the trial. SymBio will continue to collaborate with Onconova on the study and plans to increase the total enrolment in Japan to 40 patients. Onconova is guiding for top-line results of the overall survival analysis after 288 events to be available in 2019. SymBio aims to file for approval in 2021.
Onconova raised $28.8m in May and had a cash balance of $22.4m at 30 September 2018. With operating expenses currently averaging ~$6m per quarter, it should have sufficient funds to report top-line data from the INSPIRE trial.
Valuation
We have rolled our valuation model forward in time, which increased our valuation of SymBio to ($225m) (¥25,469m), based on a risk-adjusted NPV analysis. We use a 10% discount rate for approved products and 12.5% elsewhere. The additional 20m shares in issue following the exercise of the 45th stock acquisition rights (raising $22.9m) sees value per share decline to $2.9/ADR (vs $3.6/ADR). Our valuation includes Treakisym approved indications and the r/r DLBCL indication, plus rigosertib. Our valuation assumptions and financial forecasts are unchanged. Our main assumptions are summarized in Exhibit 3 below.
Exhibit 3: SymBio rNPV valuation
Product |
Indication |
Launch |
Peak Sales ($m)** |
Value ($m) |
Probability |
rNPV ($m) |
NPV/ADR ($/ADR)*** |
Treakisym |
LG NHL/MCL (r/r and 1st line); CLL |
2010* |
84 |
153.7 |
100-95% |
147.4 |
1.9 |
Treakisym (DLBCL) |
r/r DLBCL |
2021 |
85 |
84.1 |
60% |
43.0 |
0.6 |
Rigosertib (IV) |
r/r HR-MDS |
2023 |
34 |
17.7 |
50% |
6.2 |
0.1 |
Rigosertib (oral) |
First-line HR-MDS (combo) |
2025 |
66 |
29.1 |
15% |
2.5 |
0.0 |
Net cash at 30 December 2017 |
26.1 |
100% |
26.1 |
0.3 |
|||
Valuation |
310.7 |
225.2 |
2.9 |
||||
Source: Edison Investment Research Edison Investment Research. Note: *Treakisym was launched in 2010 in r/r low-grade NHL/MCL; it received approvals in Japan in CLL in August 2016 and in first-line, low-grade NHL/MCL in December 2016; **we present Treakisym peak sales estimates net of discounts, to align with sales reporting by Eisai; 77.9m shares on issue.
We model a 95% likelihood that the RI Treakisym formulation will be launched by the start of 2023, thereby minimizing the penetration of generic copies of the FD Treakisym formulation. We model branded Treakisym market share gradually declining from 96% in 2022 to 75% in 2031, followed by a more rapid decline from 2032 after the liquid formulation patents expire.
Our Treakisym valuation assumes that SymBio earns an average net margin of 10–12% on top-line reported Treakisym sales until 2020. We assume that after 2020 the net operating margin gradually increases to reach 50% in 2024 and subsequent years as SymBio switches to self-commercialization of Treakisym via its own salesforce and the liquid formulations in-licensed from Eagle gain market share vs powder formulations.
We model $13m of development costs to achieve approval for the RTD and RI liquid formulations of Treakisym. We estimate that a salesforce of 60 would be needed to market Treakisym in Japan. At a fully-loaded cost of $250,000 per person, this would cost $15m per year.
Scenario analysis
In a scenario where the Treakisym market share declines to 50% by 2031 (vs 75% for the base case), our valuation would fall by around $18M ($0.2/ADR) to around $207m ($2.7/ADR).
We currently assume stable Treakisym pricing apart from a 5% price cut in 2022 when FD powder generics are expected to enter the market. However, should Treakisym be subject to an additional price cut in the future, this could represent downside to our forecasts; a 10% price cut in 2019 would remove around $22M from our Treakisym rNPV, or $0.3/ADR.
Exhibit 4: SymBio’s 2018 outlook and 2019 targets versus our estimates; ¥-based future financial forecasts
|
2018 |
2018 |
2019 |
2019 |
Revenue |
¥ 4,201m |
¥ 4,203m |
¥ 4,238m |
¥ 4,325m |
R&D |
¥ 2,311m |
¥ 2,250m |
N/A |
¥ 2,200m |
SG&A (including R&D) |
¥ 4,350m |
¥ 4,289m |
N/A |
¥ 4,920m |
Operating loss |
¥ 2,981m |
¥ 3,045m |
¥ 3,786m |
¥ 3,640m |
Ordinary loss |
¥ 3,044m |
¥ 3,030m |
¥ 3,849m |
¥ 3,617m |
Net loss |
¥ 3,056m |
¥ 3,034m |
¥ 3,853m |
¥ 3,621m |
Source: Edison Investment Research
Exhibit 5: Financial summary
Accounts: JPN GAAP, year end: 31 December, $'000s |
|
2014 |
2015 |
2016 |
2017 |
2018e |
2019e |
|
Total revenues |
|
|
17,301 |
17,108 |
20,957 |
30,480 |
37,193 |
38,279 |
Cost of sales |
|
|
(12,641) |
(11,949) |
(12,955) |
(21,353) |
(26,184) |
(26,948) |
Gross profit |
|
|
4,661 |
5,159 |
8,002 |
9,126 |
11,009 |
11,330 |
SG&A (expenses) |
|
|
(9,343) |
(9,734) |
(12,072) |
(17,350) |
(18,044) |
(24,075) |
R&D costs |
|
|
(6,850) |
(18,006) |
(14,753) |
(26,706) |
(19,912) |
(19,469) |
Other income/(expense) included in adjusted |
|
|
0 |
0 |
0 |
0 |
0 |
0 |
Other income/(expense) excluded from adjusted |
|
|
0 |
0 |
0 |
0 |
0 |
0 |
Reported EBIT |
|
|
(11,533) |
(22,581) |
(18,823) |
(34,930) |
(26,946) |
(32,214) |
Finance income/ (expense) |
|
|
219 |
144 |
48 |
27 |
131 |
206 |
Other income/(expense) included in adjusted |
|
|
(16) |
19 |
65 |
24 |
0 |
0 |
Other income/(expense) excluded from adjusted |
|
|
1,488 |
(841) |
(1,728) |
(290) |
0 |
0 |
Reported PBT |
|
|
(9,841) |
(23,259) |
(20,437) |
(35,169) |
(26,815) |
(32,008) |
Income tax expense |
|
|
(34) |
(34) |
(34) |
(34) |
(34) |
(34) |
Reported net income |
|
|
(9,875) |
(23,293) |
(20,471) |
(35,202) |
(26,849) |
(32,041) |
Average number of ADRs - basic (m) |
|
|
30.8 |
32.4 |
39.3 |
49.9 |
66.0 |
77.9 |
Basic Earnings per ADR |
USD |
|
(0.32) |
(0.72) |
(0.52) |
(0.71) |
(0.41) |
(0.41) |
|
|
|
|
|
|
|
|
|
Adjusted EBITDA |
|
|
(11,421) |
(22,367) |
(18,596) |
(34,668) |
(26,588) |
(3,178) |
Adjusted EBIT |
|
|
(11,533) |
(22,581) |
(18,823) |
(34,930) |
(26,946) |
(3,221) |
Adjusted PBT |
|
|
(9,826) |
(23,278) |
(20,503) |
(35,193) |
(26,815) |
(3,201) |
Adjusted Earnings per ADR |
USD |
|
(0.32) |
(0.72) |
(0.52) |
(0.71) |
(0.41) |
(0.41) |
Adjusted diluted Earnings per ADR |
USD |
|
(0.32) |
(0.72) |
(0.52) |
(0.71) |
(0.41) |
(0.41) |
|
|
|
|
|
|
|
|
|
Balance sheet |
|
|
|
|
|
|
|
|
Property, plant and equipment |
|
|
434 |
469 |
660 |
414 |
429 |
433 |
Goodwill |
|
|
0 |
0 |
0 |
0 |
0 |
0 |
Intangible assets |
|
|
585 |
460 |
372 |
610 |
762 |
849 |
Other non-current assets |
|
|
430 |
465 |
680 |
886 |
886 |
886 |
Total non-current assets |
|
|
1,449 |
1,394 |
1,711 |
1,909 |
2,076 |
2,168 |
Cash and equivalents |
|
|
45,063 |
37,712 |
50,613 |
26,080 |
20,489 |
4,425 |
Inventories |
|
|
2,164 |
1,177 |
2,413 |
3,208 |
2,869 |
2,215 |
Trade and other receivables |
|
|
2,413 |
2,661 |
4,314 |
4,335 |
5,095 |
4,405 |
Other current assets |
|
|
14,874 |
1,164 |
1,818 |
2,098 |
2,098 |
2,098 |
Total current assets |
|
|
64,514 |
42,715 |
59,159 |
35,721 |
30,551 |
13,142 |
Non-current loans and borrowings |
|
|
0 |
0 |
3,982 |
0 |
0 |
13,198 |
Trade and other payables |
|
|
0 |
0 |
0 |
0 |
0 |
0 |
Other non-current liabilities |
|
|
20 |
14 |
12 |
12 |
12 |
12 |
Total non-current liabilities |
|
|
20 |
14 |
3,995 |
12 |
12 |
13,211 |
Trade and other payables |
|
|
2,708 |
2,831 |
2,848 |
5,349 |
3,090 |
3,543 |
Current loans and borrowings |
|
|
0 |
0 |
0 |
0 |
0 |
0 |
Other current liabilities |
|
|
1,610 |
2,045 |
5,489 |
3,603 |
3,603 |
3,603 |
Total current liabilities |
|
|
4,318 |
4,876 |
8,337 |
8,951 |
6,693 |
7,146 |
Equity attributable to company |
|
|
61,625 |
39,220 |
48,539 |
28,667 |
25,923 |
(5,046) |
Non-controlling interest |
|
|
0 |
0 |
0 |
0 |
0 |
0 |
|
|
|
|
|
|
|
|
|
Cash flow statement |
|
|
|
|
|
|
|
|
Profit before tax |
|
|
(9,841) |
(23,259) |
(20,437) |
(35,169) |
(26,815) |
(32,008) |
Depreciation and Amortisation |
|
|
112 |
215 |
227 |
262 |
358 |
437 |
Share based payments |
|
|
838 |
911 |
1,212 |
1,073 |
1,073 |
1,073 |
Other adjustments |
|
|
(1,830) |
231 |
1,744 |
370 |
(131) |
(206) |
Movements in working capital |
|
|
(688) |
1,678 |
(111) |
(307) |
(2,679) |
1,798 |
Net cash from operating activities (pre-tax) |
|
|
(11,409) |
(20,226) |
(17,365) |
(33,771) |
(28,195) |
(28,906) |
Interest paid / received |
|
|
238 |
156 |
53 |
28 |
131 |
206 |
Income taxes paid |
|
|
(34) |
(34) |
(34) |
(34) |
(34) |
(34) |
Cash from operations (CFO) |
|
|
(11,205) |
(20,103) |
(17,346) |
(33,777) |
(28,098) |
(28,734) |
Capex |
|
|
(961) |
(210) |
(247) |
(505) |
(525) |
(529) |
Acquisitions & disposals net |
|
|
0 |
0 |
0 |
0 |
0 |
0 |
Other investing activities |
|
|
3,743 |
13,389 |
(141) |
(181) |
0 |
0 |
Cash used in investing activities (CFIA) |
|
|
2,782 |
13,178 |
(388) |
(686) |
(525) |
(529) |
Net proceeds from issue of shares |
|
|
4,818 |
(16) |
28,550 |
10,303 |
23,032 |
0 |
Movements in debt |
|
|
0 |
0 |
3,982 |
0 |
0 |
13,198 |
Other financing activities |
|
|
(7) |
(7) |
(159) |
0 |
0 |
0 |
Cash from financing activities (CFF) |
|
|
4,812 |
(23) |
32,373 |
10,303 |
23,032 |
13,198 |
Currency translation differences and other |
|
|
1,823 |
(402) |
(1,738) |
(373) |
0 |
0 |
Increase/(decrease) in cash and equivalents |
|
|
(1,788) |
(7,351) |
12,902 |
(24,533) |
(5,591) |
(16,064) |
Cash and equivalents at end of period |
|
|
45,063 |
37,712 |
50,613 |
26,080 |
20,489 |
4,425 |
Net (debt) cash |
|
|
45,063 |
37,712 |
46,631 |
26,080 |
20,489 |
(8,774) |
Movement in net (debt) cash over period |
|
|
(1,788) |
(7,351) |
8,919 |
(20,551) |
(5,591) |
(29,263) |
Source: Edison Investment Research and SymBio accounts. Solely for the convenience of the reader the financial summary table has been converted at a rate of ¥113 to $1. SymBio reports statutory accounts in Japanese yen. These translations should not be considered representations that any such amounts have been or could be converted into US dollars at the assumed conversion rate.
|
|
Research: Investment Companies
Standard Life UK Smaller Companies (SLS) is managed by Harry Nimmo at Aberdeen Standard Investments. He has followed the same investment process since he took over management of the trust in 2003, through a number of economic cycles, and considers it to be stable, predictable and well defined, while providing an element of resilience during periods of stock market weakness. He also believes that the investment process is optimal for running large amounts of UK small-cap money. Nimmo has a long-term record of outperformance – SLS’s NAV total return is ahead of its blended benchmark over the last one, three, five and 10 years, and above the averages of its larger peers in the AIC UK Smaller Companies sector over one and five years, and broadly in line over three years.