Last close As at 05/08/2026
GBP1.87
— 0.00 (0.00%)
Market capitalisation
GBP409m
Research: Investment Companies
Lowland Investment Company (LWI) is riding high among its UK Equity Income peers over 12 months as a market rotation towards more cyclical and domestic UK names looks to vindicate its valuation-aware, multi-cap approach. With the Brexit withdrawal agreement now signed, managers James Henderson and Laura Foll say an increase in takeover activity shows private equity and trade buyers see the value in UK companies, and argue that international investors should also return to a market that has got used to being seen as ‘unloved and underperforming’. After almost a decade of adding to its revenue reserve each year, LWI was able to draw on this to increase its FY20 dividend, with sufficient firepower to do so again in FY21 even if UK corporate dividends take longer than anticipated to recover.
Written by
Lowland Investment Company |
Positioned to benefit from UK recovery |
Investment trusts |
9 April 2021 |
Analysts
|
||||||||||||||||||||||||||||||||||||||||||||||||||||||||||||||||||||||||||||||||||||||||||||||||||||||||||||||||
Lowland Investment Company (LWI) is riding high among its UK Equity Income peers over 12 months as a market rotation towards more cyclical and domestic UK names looks to vindicate its valuation-aware, multi-cap approach. With the Brexit withdrawal agreement now signed, managers James Henderson and Laura Foll say an increase in takeover activity shows private equity and trade buyers see the value in UK companies, and argue that international investors should also return to a market that has got used to being seen as ‘unloved and underperforming’. After almost a decade of adding to its revenue reserve each year, LWI was able to draw on this to increase its FY20 dividend, with sufficient firepower to do so again in FY21 even if UK corporate dividends take longer than anticipated to recover.
|
Strong 10-year record boosted by recent market rotation |
|
|
Source: Refinitiv, Edison Investment Research. Total returns in sterling. |
Why invest in UK equities now?
Massive global monetary and fiscal stimulus has effectively reset the economic cycle, meaning a brighter outlook for cyclical stocks such as banks and industrials, which are well represented in the UK. Meanwhile, the Datastream UK index forward P/E is at a 25% discount to the World index, suggesting a relative value opportunity.
The analyst’s view
LWI has a consistent investment process focused on finding attractively valued UK stocks offering income and/or capital growth across the market cap spectrum. While this has worked well for investors over the long term (see chart), performance had suffered in the last three years as investors crowded into highly valued global tech and consumer names. As the world looks ahead to reopening from lockdowns, the more cyclical and small-cap names favoured by LWI’s managers have begun to outperform. The trust offers a differentiated approach from peers given its value-biased style, long stock list, high weighting in smaller companies, and willingness to hold some of the portfolio in non-yielders with significant growth potential.
Attractive yield and relatively wide discount
Having increased its FY20 dividend by 0.5p to 60p (a current yield of 4.7%), LWI’s 15.0p Q121 payout suggests continued modest dividend growth potential in FY21. Meanwhile, the current 5.6% discount to NAV still leaves scope for a re-rating.
Market outlook: Set fair for a cyclical upturn
As shown in Exhibit 1 (left-hand chart), the broad UK equity market (measured by the CBOE UK All Companies index) has markedly underperformed global developed markets (measured by the MSCI World index) over the five years since the vote to leave the European Union. While much of this may be attributed to Brexit uncertainty (and related weakness in sterling, which has boosted the value of overseas assets for UK-based investors), the composition of the UK equity market is also partly to blame. Global indices have been driven to ever higher levels largely by mega-cap technology companies, such as Apple and Amazon in the US or Tencent and Alibaba in China, a segment that is lacking in the UK, where technology makes up only 1% of the broad index. As a result, UK forward P/E valuations – while 10% above their 10-year average – look less stretched than in other markets (Exhibit 1, right-hand side), where forward P/Es on the relevant Datastream indices are between 27% and 41% above long-term averages. Given the scale of monetary and fiscal support around the world to help offset the effects of the COVID-19 pandemic, the global economy is effectively at the start of a new economic cycle, and in such conditions, more cyclical and recovery stocks (of which the UK has many) may perform better, with the added benefit of lower starting valuations. While the trajectory of recovery is far from certain with the pandemic still ongoing, investors may benefit from an allocation to more domestically focused and cyclical UK names, both in terms of capital growth and the potential for higher total returns as dividend payouts (which fell by 44% in 2020) are reinstated.
|
Exhibit 1: UK still catching up after years of Brexit overhang |
|||||||||||||||||||||||||||||||||||||||||||
Total return performance of UK and world (DM) equities over five years (£) |
Forward P/E multiples of Datastream indices (at 6 April 2021) |
||||||||||||||||||||||||||||||||||||||||||
|
|
||||||||||||||||||||||||||||||||||||||||||
|
Source: Refinitiv, Bloomberg, Edison Investment Research. Note: Performance data to 7 April 2021. |
|||||||||||||||||||||||||||||||||||||||||||
The fund managers: James Henderson and Laura Foll
The managers’ view: Time to get used to loving the UK again
LWI’s managers believe the recent re-rating of UK domestic equities, which has benefited the fund’s performance in recent months, is set to continue given the removal of the Brexit overhang and the reopening of the economy. ‘People have become resigned to the UK market being unloved and underperforming, but if you look back to the five years before the Brexit vote, the UK was bang in line with the European index’, says Foll. ‘It’s not “normal” for the UK to underperform, even if people have got used to it’.
Although 2020 was clearly a difficult year for the UK economy, Foll says that looking for a recovery to 2019 levels is an unambitious target for many industrial companies. ‘The year before last was not a great one for UK industrials, given the US/China trade war, weak sentiment, and fears over Brexit meaning there was not much capital expenditure’, she comments. The pandemic caused many companies to introduce or accelerate cost-saving initiatives, which the manager says will result in improved margins and profitability once sales return to normal. ‘Coming out of the global financial crisis, companies took the market by surprise in terms of how much positive operating leverage they had’, adds Foll. ‘I think we will see that again, and with valuations still reasonable, you have to question whether 2019 is the right level to be thinking about recovering to’.
The trust’s diverse portfolio covers the spectrum of economic sensitivity, with some companies, such as those in the small-cap income bucket (see Investment process), quite tied to the UK economy (for example, vehicle hire firm Redde Northgate, or Finsbury Foods, which supplies baked goods to supermarkets, but also to foodservice outlets such as Costa Coffee), while others are more exposed to structural trends such as energy transition that should transcend short-term economic bumps. Foll points to small-cap growth companies such as Ilika, which is not a typical holding for an income fund, given it pays no dividends. ‘These companies bring something different’, she explains. ‘They are not exposed to factors such as the savings ratio or the unemployment rate. What matters to Ilika is how quickly they can scale up production and whether their solid-state batteries become the standard.’ Among larger companies, LWI has more exposure to domestic names than those with international earnings, meaning the recent strength of sterling has not been a headwind for the trust to the same extent it has been for some peers.
Looking ahead, the managers are encouraged by the level of merger and acquisition (M&A) activity. ‘Takeover interest shows we aren’t the only ones who think UK plc is attractive and good value’, says Foll. ‘Now the Brexit deal has been signed, we think takeover activity will accelerate – we expected it in 2020 after seeing signs in 2019, but obviously COVID-19 has had an impact on that’.
As an income fund, LWI was clearly affected by dividend cuts and suspensions during the pandemic (see Dividends), but Henderson and Foll are optimistic that payouts are on the road to recovery. ‘We are modelling FY21 as a “bridge” year on the road to further normalisation’, says Foll. ‘While we don’t expect companies like Johnson Service Group, Churchill China or Ten Entertainment to return to paying dividends this year, our model shows earnings per share will recover fully and dividends will resume their previous trajectory by FY23.’ The managers see LWI’s multi-cap approach as an important point in building their confidence in the dividend outlook. ‘For small and mid-caps, payout ratios were not at stretched levels pre-pandemic,’ Foll says. ‘Among the largest companies, there was evidence of over-distribution by the likes of Shell, BP and HSBC [all of which have permanently rebased their dividends in the past year], but small and mid-cap payout ratios were much lower, so we don’t think we will see the same degree of rebasing.’
Asset allocation
Current portfolio positioning
At 28 February 2021, there were 106 holdings in the LWI portfolio, a decrease from 113 a year earlier. Concentration in the top 10 holdings (Exhibit 2) also decreased, from 24.9% of the total at 29 February 2020 to 22.6%. The diversified nature of the portfolio means the managers are comfortable holding quite small positions in most companies, particularly the smaller growth stocks where risk is higher, but there is potential to see returns of several times the initial investment. At 106 names the implied average position size is 0.94%, with only 19 out of 103 holdings at 31 January 2021 (the date of the latest full portfolio disclosure) making up more than a 1.5% position.
Recent additions to the portfolio include an across-the-board allocation to the major UK high street banks, driving LWI’s financials weighting (which includes real estate) to 38.2% at 28 February 2021 compared with 36.0% a year earlier (Exhibit 3). The banks made up 4.3% of the portfolio at end-FY20; this had risen to 5.7% at 31 January 2021, spread across HSBC, Standard Chartered, NatWest, Barclays (a new holding) and Lloyds Banking Group. While not a hugely high conviction position – as at the end of March, LWI is modestly overweight the sector versus its broad UK index benchmark – Foll says UK banks are still very attractively valued given their improving fundamentals. ‘Banks’ recent results have all pointed to lower loan impairments than expected, and they have been permitted by the regulator to restart dividend payments,’ she explains. ‘The sector will benefit from a steeper yield curve and we are seeing evidence of that, which begs the question of whether these names should be trading at a material discount to book value.’
Exhibit 2: Top 10 holdings (at 28 February 2021)
Company |
Country |
Sector |
Portfolio weight % |
|
28 February 2021 |
29 February 2020* |
|||
Phoenix Group |
UK |
Life insurance |
3.0 |
2.8 |
Royal Dutch Shell |
UK |
Oil & gas |
2.5 |
4.1 |
GlaxoSmithKline |
UK |
Pharma & biotech |
2.5 |
3.6 |
Ilika |
UK |
Electronic & electrical eqpt |
2.4 |
N/A |
Prudential |
UK |
Life insurance |
2.3 |
2.0 |
HSBC |
UK |
Banks |
2.1 |
2.3 |
Severn Trent |
UK |
Utilities |
2.0 |
2.3 |
Rio Tinto |
UK |
Mining |
2.0 |
N/A |
Morgan Advanced Materials |
UK |
Electronic & electrical eqpt |
1.9 |
N/A |
Aviva |
UK |
Life insurance |
1.9 |
N/A |
Top 10 (% of holdings) |
22.6 |
24.9 |
||
Source: Lowland Investment Company, Edison Investment Research, Bloomberg, Morningstar. Note: *N/A where not in end-February 2020 top 10.
The managers have also taken or increased positions in retailer Marks & Spencer, where the pandemic has accelerated cost-saving initiatives and a tie-up with online grocery store Ocado has been beneficial; TT Electronics, which has also streamlined its operations and will benefit from a lower cost base as its end markets in defence and general industrials recover; and insurer Aviva, whose new CEO is busy divesting non-core divisions and refocusing the business. More recently, Finsbury Foods and BT Group were added to the portfolio, while February saw a new position initiated in wound dressing specialist Convatec, whose valuation, in the managers’ view, does not reflect a steadily improving organic growth profile. Holdings in non-bank financials (Aviva, M&G, Standard Life Aberdeen) were added to with the proceeds from the sale of RSA Insurance, while AstraZeneca and Vodafone were topped up in February.
Exhibit 3: Portfolio sector exposure (% unless stated)
Portfolio end-February 2021 |
Portfolio end-February 2020* |
Change (pp) |
|
Financials |
38.2 |
36.0 |
2.2 |
Industrials |
22.4 |
27.0 |
(4.6) |
Consumer services |
10.8 |
10.0 |
0.8 |
Oil & gas |
7.8 |
8.0 |
(0.2) |
Basic materials |
5.9 |
3.0 |
2.9 |
Utilities |
4.4 |
6.0 |
(1.6) |
Healthcare |
4.2 |
5.0 |
(0.8) |
Consumer goods |
3.1 |
3.5 |
(0.4) |
Telecommunications |
2.5 |
1.0 |
1.5 |
Technology |
0.8 |
0.5 |
0.3 |
100.0 |
100.0 |
Source: Lowland Investment Company, Edison Investment Research. Note: End-February 2020 weightings are approximate.
The majority of exits from the portfolio during FY20 came as a result of M&A activity: pub company Greene King, medical device firm Consort Medical, clothing retailer Moss Bros and building materials company Low & Bonar were all sold after takeover bids. RSA Insurance was bid for in Q4 2020, while the managers supported chemical company Elementis in rebuffing an approach they felt undervalued the business. Edison client Avon Rubber (a long-standing holding and the top contributor to FY20 relative performance) was heavily trimmed during the year as its valuation rose to what the managers felt was an unsustainable level, with the remainder of the position sold shortly after the year end. Royal Dutch Shell was also reduced after it rebased its dividend by two-thirds; although it remains a top 10 holding; the position is now 2.5% of the portfolio compared with 4.1% a year ago. More recently, long-standing positions in chemical company Croda and Edison client XP Power were exited on valuation grounds, while water utility Pennon was sold in February as the managers saw better total return opportunities elsewhere. Henderson says it was ‘painful’ to sell Croda, which had transformed itself from ‘a relatively dull small-cap in Yorkshire’ to a remarkably successful company over LWI’s 25-year holding period. ‘When something has gone up over 100 times, you have to look at it afresh’, he comments. ‘What we need to find is new companies that are where Croda was 25 years ago’.
Exhibit 4: Portfolio geographic exposure (% unless stated)
Portfolio end-February 2021 |
Portfolio end-February 2020 |
Change (pp) |
|
UK |
97.0 |
96.2 |
0.8 |
Ireland |
3.0 |
2.9 |
0.1 |
Canada |
0.0 |
0.9 |
(0.9) |
100.0 |
100.0 |
Source: Lowland Investment Company, Edison Investment Research
As shown in Exhibit 4, while the UK Equity Income sector rules permit up to 20% of a fund to be invested outside the UK, LWI is currently almost completely invested in the home market, with the 3% in the Republic of Ireland largely made up of Dublin-listed stocks that have significant UK economic exposure, such as Irish Sea ferry operator Irish Continental Group.
Performance: Strong rebound since November 2020
Exhibit 5: Five-year discrete performance data
12 months ending |
Share price |
NAV |
CBOE UK All Cos (%) |
MSCI UK High Div Yld (%) |
CBOE UK 250 (%) |
CBOE UK Small Companies (%) |
31/03/17 |
16.0 |
20.4 |
22.6 |
25.4 |
14.5 |
18.9 |
31/03/18 |
6.2 |
2.6 |
1.2 |
0.0 |
5.6 |
7.0 |
31/03/19 |
(6.3) |
(4.7) |
6.2 |
9.1 |
(0.9) |
(3.1) |
31/03/20 |
(29.8) |
(29.5) |
(19.1) |
(22.7) |
(21.7) |
(25.3) |
31/03/21 |
45.9 |
47.0 |
26.6 |
23.4 |
50.7 |
75.0 |
Source: Refinitiv. Note: All % on a total return basis in pounds sterling.
LWI fell further than the broad UK stock market in both share price and NAV terms during the initial COVID-19 related market sell-off in February and March 2020, but has recovered more strongly since positive vaccine news (starting in early November 2020) boosted value and cyclical names that could benefit from an economic recovery and reopening. With the sell-off itself having occurred almost entirely within March 2020 and therefore excluded from the one-year numbers in Exhibit 5, LWI has markedly outperformed the CBOE UK All Companies index over the 12 months to end-March 2021 and was ahead (with the exception of the three-month share price total return) over the shorter periods of one, three and six months (Exhibit 6, right-hand chart). The prolonged period of stronger performance for growth and momentum strategies has held back the trust’s returns over the three- and five-year periods, but it has outperformed the CBOE UK All Companies over the past 10 years, with annualised NAV and share price total returns of 7.8% and 7.9% respectively versus 6.0% for the broad index.
The top contributors to relative performance in FY20 (to 30 September) were Avon Rubber, Ilika, XP Power, Phoenix Group and Somero Enterprises. This is quite a diverse list – Avon Rubber makes defence equipment such as gas masks, Ilika and XP Power are both involved in power supply (Ilika in batteries and XP in power converters), Phoenix Group owns orphaned life insurance assets and Somero produces concrete levelling equipment. The relative detractors were largely companies that were negatively affected by the pandemic. Senior (the biggest detractor) and Rolls-Royce (the fifth largest detractor) both have significant exposure to civil aerospace and as such were badly hit by the grounding of commercial air fleets. Insurer Hiscox, the second biggest detractor, suffered on the back of its involvement in business interruption and event cancellation insurance, while property company Hammerson – which had been struggling even before the pandemic – saw further woes as the lockdowns closed the majority of its retail estate. Finishing the list, in-home and online lender International Personal Finance de-rated on fears of higher default rates, although the actual level of bad debts remained manageable.
|
Exhibit 6: Investment trust performance to 31 March 2021 |
|
Price, NAV and benchmark total return performance, one-year rebased |
Price, NAV and benchmark total return performance (%) |
|
|
|
Source: Refinitiv, Edison Investment Research. Note: Three, five and 10-year performance figures annualised. |
|
Exhibit 7: Share price and NAV total return performance, relative to indices (%)
|
One month |
Three months |
Six months |
One year |
Three years |
Five years |
10 years |
Price relative to CBOE UK All Cos |
1.0 |
(2.4) |
16.7 |
15.2 |
(11.9) |
(12.5) |
20.1 |
NAV relative to CBOE UK All Cos |
0.8 |
3.9 |
14.5 |
16.1 |
(9.2) |
(9.6) |
18.0 |
Price relative to MSCI UK High Div Yld |
1.3 |
(0.4) |
19.2 |
18.2 |
(7.9) |
(9.6) |
18.5 |
NAV relative to MSCI UK High Div Yld |
1.1 |
6.0 |
16.9 |
19.1 |
(5.1) |
(6.6) |
16.5 |
Price relative to CBOE UK 250 |
1.9 |
(4.0) |
5.2 |
(3.2) |
(18.0) |
(16.6) |
(15.6) |
NAV relative to CBOE UK 250 |
1.7 |
2.1 |
3.2 |
(2.5) |
(15.6) |
(13.8) |
(17.1) |
Price relative to CBOE UK Small Cos |
(0.1) |
(13.1) |
(8.8) |
(16.7) |
(24.3) |
(26.8) |
7.7 |
NAV relative to CBOE UK Small Cos |
(0.3) |
(7.6) |
(10.5) |
(16.0) |
(22.1) |
(24.4) |
5.8 |
Source: Refinitiv, Edison Investment Research. Note: Data to end-March 2021. Geometric calculation.
In H121 (ending 31 March), the previous year’s biggest detractors at a sector level – industrials and financials, both areas that tend to do well in a cyclical upturn – were among the strongest performers, along with companies expected to benefit from the lifting of lockdown conditions. In the immediate wake of November’s positive news on COVID-19 vaccine trials, the strongest performers included bowling alley operator Ten Entertainment, which has held up well even through the latest lockdown, with its share price up c 74% from 1 November 2020 to 7 April 2021. Epwin Group and Headlam Group (respectively suppliers of UPVC building products and floor coverings) are up 50.7% and 70.7% respectively over the same period, while vehicle hire company Redde Northgate’s share price have risen by c 85%. Redde Northgate and Johnson Service Group (up c 75% since 1 November), which supplies textiles to the hospitality industry, were among the strongest contributors to performance in February 2021 as investors looked ahead to a reopening of the economy.
|
Exhibit 8: NAV performance relative to CBOE UK All Companies index over one year |
|
|
Source: Refinitiv, Edison Investment Research. Chart shows period 31 March 2020 to 8 April 2021. |
Peer group comparison
LWI is a member of the Association of Investment Companies’ UK Equity Income sector, one of the largest peer groups with a total of 22 constituents. In Exhibit 9 we show the 16 largest funds, having excluded those with a market cap of less than £100m. Given the major declines seen in stock markets around the world in March 2020 as a result of the COVID-19 pandemic, all the peers in the table have seen significant gains over the 12 months to early April 2021, given the low base from which they started. The top performers over the one-year period are largely those funds with a more value-oriented (Edison client Merchants Trust, Temple Bar) or small-cap tilted (Edison client Diverse Income Trust) approach. LWI arguably straddles these two categories, helping it to achieve fourth place in the table with a one-year NAV total return of 48.3%. The medium-term (three- and five-year) rankings reflect the greater popularity of quality growth strategies such as Edison client Finsbury Growth & Income Trust (FGT) and Dunedin Income Growth; LWI ranks 15th and 12th respectively out of 16 over these periods. The trust’s 10-year returns are again towards the top of the group, ranking sixth, albeit a little below average given the distorting effect of the outsized returns from FGT. We note that Law Debenture Corporation (LWDB; Edison client), whose portfolio is also managed by Henderson and Foll, ranks second over three and 10 years and first over five. While the managers employ the same approach to evaluating companies across all the funds they manage, LWDB has benefited from a bias to larger-cap equities, a c 20% allocation to stocks outside the UK, and an appreciable contribution to returns from its professional services operating division over the medium term. Although LWDB is ahead of LWI over one year (ranking third), LWI is arguably better placed to benefit in the next one to two years from a UK economic recovery and a continued market rotation towards more cyclical stocks.
The UK Equity Income peer group is very competitive on charges, with an average ongoing charge of 0.7% compared with LWI’s 0.6%. The recent change in LWI’s fee arrangements mean there are no funds in the group that may levy a performance fee (this is true of all 22 trusts, not just the 16 shown in the table). Despite its strong 12-month performance, LWI’s shares currently trade at one of the widest discounts to NAV, while five of the peers (including LWDB) trade at a premium. The trust’s 4.7% dividend yield is comfortably above the 4.1% sector average, which itself is testament to the important role of investment trusts’ revenue reserves in times of widespread dividend cuts; by comparison, the yield on the broad UK stock market index is currently c 2.9%.
Exhibit 9: Selected peer group at 8 April 2021*
% unless stated |
Market cap £m |
NAV TR |
NAV TR |
NAV TR |
NAV TR |
Ongoing |
Perf. |
Discount |
Net |
Dividend |
Lowland |
348.5 |
48.3 |
0.8 |
29.2 |
114.1 |
0.6 |
No |
(5.9) |
113 |
4.7 |
Aberdeen Standard Equity Inc Trust |
168.7 |
38.5 |
(4.1) |
9.4 |
78.4 |
0.9 |
No |
(7.4) |
112 |
5.9 |
BMO Capital & Income |
338.2 |
38.8 |
13.4 |
48.6 |
108.2 |
0.6 |
No |
(1.2) |
106 |
3.7 |
BMO UK High Income Units |
116.0 |
35.5 |
11.7 |
33.9 |
88.5 |
1.0 |
No |
(11.8) |
108 |
4.3 |
City of London |
1,715.5 |
26.4 |
9.5 |
28.4 |
108.4 |
0.4 |
No |
2.9 |
109 |
4.8 |
Diverse Income Trust |
406.4 |
48.0 |
27.3 |
49.5 |
-- |
1.1 |
No |
(0.6) |
100 |
3.2 |
Dunedin Income Growth |
448.9 |
30.1 |
30.0 |
62.0 |
107.1 |
0.6 |
No |
(3.4) |
109 |
4.2 |
Edinburgh Investment Trust |
1,065.8 |
35.8 |
2.4 |
13.0 |
120.0 |
0.6 |
No |
(4.4) |
106 |
3.9 |
Finsbury Growth & Income |
2,001.0 |
19.2 |
24.9 |
63.1 |
237.4 |
0.6 |
No |
0.6 |
101 |
1.9 |
Invesco Income Growth |
164.6 |
29.2 |
10.3 |
24.0 |
108.6 |
0.7 |
No |
(5.6) |
107 |
4.2 |
JPMorgan Claverhouse |
412.4 |
44.4 |
12.7 |
45.4 |
106.2 |
0.7 |
No |
(1.8) |
117 |
4.2 |
Law Debenture Corporation |
908.2 |
53.0 |
29.8 |
70.8 |
156.4 |
0.6 |
No |
3.1 |
113 |
3.7 |
Merchants Trust |
637.5 |
53.8 |
21.4 |
55.3 |
114.8 |
0.6 |
No |
1.4 |
116 |
5.2 |
Murray Income Trust |
1,024.2 |
26.3 |
25.8 |
54.2 |
109.5 |
0.6 |
No |
(3.1) |
111 |
4.0 |
Schroder Income Growth |
210.6 |
37.6 |
12.4 |
38.4 |
115.6 |
0.9 |
No |
1.3 |
106 |
4.1 |
Temple Bar |
783.7 |
58.8 |
3.8 |
30.5 |
90.7 |
0.5 |
No |
(0.8) |
114 |
3.3 |
Troy Income & Growth |
246.7 |
12.6 |
10.1 |
22.6 |
104.0 |
0.9 |
No |
(1.5) |
100 |
2.7 |
Simple average (16 funds) |
671.9 |
39.0 |
14.5 |
41.0 |
117.6 |
0.7 |
(2.3) |
109 |
4.1 |
|
LWI rank in peer group |
11 |
4 |
15 |
12 |
6 |
7 |
14 |
4 |
4 |
Source: Morningstar, Edison Investment Research. Note: *Performance at 7 April 2021 based on cum-fair NAV. TR = total return. TER = total expense ratio. Net gearing (to 28 February 2021) is total assets less cash and equivalents as a percentage of net assets.
Dividends: Strong reserves help to fund growth in FY20
LWI has a 45-year record of maintaining or growing its annual dividend, with 2008 the only year in which the dividend was held steady rather than increased. Dividends have been paid quarterly since 2013 and, until FY20, each quarter’s dividend had been higher than in the same quarter of the previous year. Having increased the Q120 dividend by 0.5p to 15.0p compared with Q119, the remaining three FY20 dividends were held at the same level, leading to total dividends for the year of 60.0p, a 0.8% increase on the 59.5p paid in FY19. Given the prevailing level of dividend cuts and suspensions in the UK market as a result of the COVID-19 pandemic (UK dividends were down 44% in calendar 2020, according to the Link Dividend Monitor), this seems a clear message from LWI’s board that they value the trust’s unbroken record of year-on-year dividend growth since the global financial crisis.
Looking at the trust’s own income during the financial year to 30 September 2020 (a period that includes the majority of the dividend cuts seen in the market but none of the vaccine-led value recovery towards the end of 2020), the decline was more severe than in the broad market, with net revenue per share falling by just over 50% to 33.8p. This partly reflects LWI’s higher weighting in mid-cap and smaller companies, which in aggregate saw more cuts than the largest multinational businesses, but also its exposure to more cyclical areas such as industrials (many of which were severely affected by COVID-19 restrictions and lockdowns) and financials, which in many cases were mandated to suspend dividend by regulatory authorities. Where dividend cuts were mandated or were made as a result of caution over the outlook rather than genuine stress in the business, payouts could return swiftly and even double up once they are reinstated, which could lead to a high level of dividend growth in the current year. However, Foll cautions that the managers are not expecting to see a normalisation in UK dividends until 2022 or 2023 at the earliest, with the timing very much dependent on the strength of the economic recovery.
LWI has not paid an uncovered dividend since 2010, and has added to its revenue reserves in each of the nine years before FY20, which meant there was a substantial reserve (£18.4m or 68.0p per share at the start of the year) to help fund the 60.0p dividend per share. A total of 26.2p per share or £7.2m of the reserve was used to this end, meaning reserves of 41.8p or £11.1m remained at the end of the financial year. At this level the board could effectively afford to fund a similar income shortfall (which is not expected to occur) in FY21, although such a situation would not be tenable in future years. The first quarterly dividend for FY21 was declared on 24 March at an unchanged level of 15.0p. While this means it is difficult to make any assumptions on the possibility of further dividend growth for the current financial year as a whole, it does suggest the FY21 total dividend will be at least as high as the 60.0p paid for FY20. Based on the FY20 dividend and the current share price, LWI has a yield of 4.7%, which is among the highest in its peer group (see Exhibit 9).
|
Exhibit 10: Dividend history since FY15 |
|
|
Source: Bloomberg, Edison Investment Research |
Discount: Scope to re-rate from medium-term range
At 8 April 2021, LWI’s shares traded at a 5.6% discount to cum-income NAV (note that as the shares have recently gone ex-dividend, the 15.0p dividend has been deducted from the NAV, which has narrowed the discount in the short term). This is a little narrower than the short- to medium-term average discounts of 6.9%, 6.4% and 6.1% over one, three and five years respectively, although it is wider than the 10-year average of 4.0%. While the trust did see discount volatility during the Q120 stock market sell-off, this was not at the extreme absolute levels experienced by some other trusts, moving from a 7.4% premium to NAV (the highest in five years) to a 13.0% discount (the widest in a decade) between mid- and late March 2020. LWI’s board does not favour the use of discount control mechanisms, which it sees as negating some of the benefits of the closed-end structure, as well as potentially shrinking the size of the trust, reducing the audience of potential investors, increasing the ongoing charges ratio and reducing liquidity in the shares. As shown in Exhibit 12, no shares have been repurchased in any of the last seven financial years, although the board may allot shares when the trust’s shares are trading at a premium to NAV, as seen during FY17. The relative stability of LWI’s discount to NAV at around 6–7% suggests the market is fairly comfortable with the board’s position. We note that in previous years when the managers’ more value-oriented, small-cap biased approach has been in favour, LWI’s shares have traded at a narrower discount or a small premium, meaning there is scope for the rating to break out of its medium-term range should market conditions continue to favour more cyclical and less widely appreciated businesses.
|
Exhibit 11: Discount/premium over three years |
Exhibit 12: Buybacks and issuance |
|
|
|
Source: Refinitiv, Edison Investment Research |
Source: Morningstar, Edison Investment Research |
|
Exhibit 11: Discount/premium over three years |
|
|
Source: Refinitiv, Edison Investment Research |
|
Exhibit 12: Buybacks and issuance |
|
|
Source: Morningstar, Edison Investment Research |
Fund profile: Diversified multi-cap growth and income
LWI was established in 1963 and aims to achieve capital growth and a growing income for its shareholders by investing mainly in UK companies from across the market capitalisation spectrum. It is jointly managed by James Henderson (since 1990) and Laura Foll (since 2013), who are members of the global equity income team at Janus Henderson Investors and co-manage Edison client Henderson Opportunities Trust and the investment portfolio of LWDB.
LWI is a member of the Association of Investment Companies’ UK Equity Income sector and benchmarks its performance against a broad UK stock market index, although this is an imperfect comparator given the fund’s high weighting in mid- and small-cap companies, particularly those listed on the Alternative Investment Market (AIM). The managers’ preference for out-of-favour value and recovery situations can also mean performance diverges from that of the index, which in a rising market naturally tends to be driven by the most popular stocks.
As part of their investment strategy, Henderson and Foll actively use gearing with the aim of enhancing returns. LWI has a mix of short- and longer-term borrowings equating to maximum gearing of £90m or c 30% of net assets. Net gearing at 28 February 2021 was 13.0%.
Investment process: Six ways of thinking about value
LWI’s managers invest on a bottom-up basis with a keen awareness of valuations, seeking to create a diversified, multi-cap portfolio of c 100–120 mainly UK companies. They have recently codified their portfolio construction parameters (see Exhibit 13) into a series of classification ‘buckets’ similar to those employed for another fund they manage, Henderson Opportunities Trust (latest Edison research here). This does not reflect a new approach, but rather a different way of expressing the way they think about the companies they seek to own.
Exhibit 13: Lowland’s portfolio ‘buckets’
Name |
Indicative range (%) |
Portfolio weighting* (%) |
Stock example |
Small-cap income |
5–15 |
7.3 |
Redde Northgate |
Small-cap growth |
0–10 |
4.1 |
Ilika |
Small and mid-cap compounders |
25–40 |
32.7 |
Morgan Advanced Materials |
Large-cap income |
20–35 |
29.5 |
Aviva |
Large-cap compounders |
10–20 |
13.3 |
Rio Tinto |
Recovery |
5–15 |
13.2 |
Johnson Service Group |
100.0 |
Source: Lowland Investment Company, Edison Investment Research. Note: *At 31 October 2020.
Foll points out that one of the key differentiators between LWI and most of its UK Equity Income peers is its high weighting in small- and mid-cap companies, which tend to average around two-thirds of the total portfolio through an investment cycle. Across the classifications, she and Henderson are looking for well-managed, cash-generative, market-leading companies that are out of favour with the market, although in the small-cap areas these could be market leaders in quite focused areas, such as Headlam in flooring distribution, or Churchill China in crockery for the hospitality trade. The six buckets ensure diversity in the portfolio, both in terms of company size and source of return, with some higher-growth names that can move up through the classifications over time alongside more traditional equity income stocks where most of the return may come from high and/or growing dividends.
The multi-cap nature of the portfolio, which may include a significant proportion in companies listed on AIM, means LWI’s profile (and hence its performance) is likely to differ appreciably from the benchmark, where c 80% of total market capitalisation is accounted for by the largest 100 names. Running a long stock list is a good way of limiting company-specific risk, particularly in smaller firms that may be at a relatively early stage of development. The trust may invest up to 20% of its assets overseas; however, non-UK holdings currently account for only c 3% of the total, focused on Irish-listed companies with significant UK operations.
Four key principles underpin the investment philosophy, which has remained largely unaltered since the trust was set up in 1963:
■
The UK is home to many world-class companies with sustainable long-term growth potential.
■
Mid-cap and smaller companies make better long-term investments because of their superior growth potential.
■
Capital growth and dividend growth go hand in hand as drivers of investment performance.
■
As long-term investment returns have tended to exceed the cost of borrowing, gearing is an appropriate way of maximising performance.
The managers use a range of valuation criteria to identify the companies in their investment universe of c 1,500 stocks that have potential to generate both capital appreciation and (in normal circumstances) a growing income. They meet with hundreds of companies every year (virtually or in person), seeking businesses with real prospects of sales and earnings growth. Henderson and Foll strongly prefer to buy into companies that are trading at low valuations because their potential to recover and grow may be under-appreciated by the wider market. In addition, because they believe dividend growth is a key to long-term capital growth, the managers favour companies that pay sustainable dividends. Clearly the high level of dividend cuts and suspensions by UK companies as a result of the COVID-19 pandemic and associated lockdowns has had an impact on LWI’s revenue account, but the managers are optimistic many holdings that have cut or suspended dividends will be able to return to the path of dividend growth in 2021 or 2022.
Positions tend to be built slowly, starting at c 0.5% of the total portfolio or even less in the case of the smallest companies. The managers’ approach is long term and portfolio turnover is relatively low, at 14.7% in FY20 and 12.4% in FY19, implying an average holding period of six to eight years.
Lowland’s approach to ESG
In line with the trust’s overall investment approach, LWI has a bottom-up rather than a top-down approach to environmental, social and governance (ESG) issues. Rather than relying on external ratings, which may be absent in the case of smaller companies, or based on flawed, outdated or incomplete data, the managers review each new investment idea for potential ESG shortcomings. Any material issue they discover is discussed with Janus Henderson’s governance and sustainable investing team and/or the company itself before an investment is made.
Henderson and Foll see responsible investing as a long-term process that depends not just on businesses meeting current legislative standards but also operating with an understanding of changing societal attitudes towards issues such as climate change, pollution and working conditions. Where evidence of poor practice emerges, they will engage with the company to discover how the problem is being addressed and will monitor progress to assess improvements. Specifically on governance, the managers always vote at the AGMs of investee companies and try to work constructively with firms on appropriate executive remuneration structures to ensure the best alignment of the interests of management and shareholders.
Gearing: Up to £90m available
LWI is geared (up to a maximum of 29.99% at the time of drawdown) via a mix of long- and short-term borrowing. In 2017, the trust issued £30m of 20-year loan notes with a fixed coupon of 3.15%. Its previous £40m bank loan facility with Scotiabank (with the option to increase to £60m) expired in October 2020 and has been replaced with a new £40m two-year facility (also extendable to £60m) with Industrial and Commercial Bank of China at an interest rate of Libor+0.9%. Taken together (and without extending the bank loan), this equates to potential gearing of c 20% (based on net assets at 25 March 2021). During FY20 (to 30 September), the amount of the bank loan that was drawn fell from £21.2m at the start of the year to £16.1m at the end (peaking at £23.7m), although net gearing increased from 12.8% at 1 October 2019 to 15.0% at 30 September 2020 because of the fall in net assets during the year. Since the end of FY20, LWI’s NAV has risen by c 32.5%. Net gearing at 28 February 2021 was 13.0%, with gross gearing of 14.0% suggesting that c £19m of the loan was drawn at this date.
Historically the managers have tended to deploy gearing in companies with yields above the cost of borrowing, leading to an immediate boost to the revenue account. With yields under pressure in 2020, they have been more focused on using the gearing (investing a net £2.5m in November 2020 alone) to buy undervalued companies in expectation of capital upside.
Fees and charges: Lower fees should show in FY21
With effect from the beginning of FY21 (1 October 2020), LWI has revamped its fee arrangements, scrapping its performance fee (it was previously the only fund in the AIC UK Equity Income sector to retain such an incentive) and reducing the level of assets at which its lower percentage management fee is applied. Under the new arrangements, Janus Henderson Investors is paid a tiered annual management fee of 0.5% on the first £325m of LWI’s net assets (previously the first £375m) and 0.4% thereafter, charged 50:50 to the revenue and capital accounts. This change has not yet been reflected in LWI’s ongoing charges, which stood at 0.66% at end-FY20 compared with 0.63% a year earlier, with no performance fee payable. Assuming all other elements of the ongoing charge remained the same, we calculate that the change in threshold for the lower tier of management fee would have reduced ongoing charges in FY20 by c 5bp to 0.61%. We would expect it to have a more appreciable impact in the current year given average net assets for FY20 were only a little above £325m (at £332.3m), compared with the 8 April 2021 level of c £369m.
Capital structure
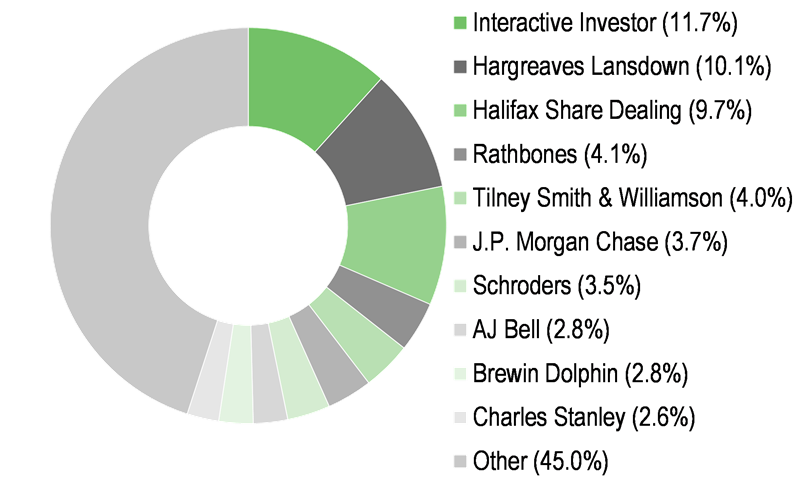
LWI is a conventional investment trust with one class of share and 27.0m ordinary shares in issue at 8 April 2021. The number of shares has remained unchanged since FY16, when c 130,000 new shares were allotted. As shown in Exhibit 14, LWI’s shareholder register includes strong representation from retail investors, with the self-directed platforms Interactive Investor, Hargreaves Lansdown, Halifax Share Dealing and AJ Bell accounting for more than a third (34.3%) of the share base. Trading liquidity (Exhibit 15) is good and reasonably consistent, with an average of 41,200 shares (c 0.15% of the total) changing hands each day in the 12 months to 8 April 2021.
|
Exhibit 14: Major shareholders |
Exhibit 15: Average daily volume |
|
|
|
Source: Bloomberg, at 4 February 2021. |
Source: Refinitiv. Note: 12 months to 8 April 2021. |
|
Exhibit 14: Major shareholders |
|
|
Source: Bloomberg, at 4 February 2021. |
|
Exhibit 15: Average daily volume |
|
|
Source: Refinitiv. Note: 12 months to 8 April 2021. |
The board
Exhibit 16: Lowland’s board of directors
Board member |
Date of appointment |
Remuneration in FY20 |
Shareholdings at end-FY20 |
Robert Robertson (chairman) |
2011 (2017) |
£39,000 |
59,225 |
Gaynor Coley (audit cttee chair) |
2016 (2017) |
£30,500 |
500 |
Karl Sternberg |
2009 |
£25,500 |
9,629 |
Duncan Budge |
2014 |
£25,500 |
9,779 |
Tom Walker |
2019 |
£25,500 |
1,600 |
Source: Lowland Investment Company.
Karl Sternberg, LWI’s longest-serving director, has indicated his intention to stand down before the 2022 (FY21) AGM. A search for his replacement is under way.
|
|
Brighton Pier Group (BPG) looks to be rather more than a clear play on the expected UK staycation boom, attractive as that is. With a focus on popular low-ticket leisure, driven by the group’s fabled eponymous key asset, entrepreneurial management sees longer-term growth opportunities as a consolidator accelerated by fallout from the pandemic. For now, it is confident that buoyancy in the Pier and Golf after spring 2020 lockdown (sales in Q3 almost at 2019 levels) can be repeated on imminent phased reopening, while business interruption insurance payments should continue to buttress results. Finances appear secure with £6m liquidity, further insurance payments aside, and, even after FY20 impairments, low gearing, given asset backing (70% and 47p NAV per share at end-2020).