Future has assembled a strong platform on which to develop its specialist media. With a growing portfolio of brands, it is successfully diversifying its revenue streams and building recurring and repeatable income, giving a more robust business model. Acquisitions have brought scale and added range and reach, building on organic growth from leveraging of the brands with their highly engaged audiences. Cash flow is strong, with tight working capital management, and the balance sheet is modestly geared. This progress has resulted in impressive share price performance, but we still consider that the rating does not yet fully reflect the opportunity.
Future |
Platform, brands and fans |
Full year results |
Media |
24 November 2017 |
Share price performance
Business description
Next events
Analysts
Future is a research client of Edison Investment Research Limited |
|||||||||||||||||||||||||||||||||||||||||||||||||
Future has assembled a strong platform on which to develop its specialist media. With a growing portfolio of brands, it is successfully diversifying its revenue streams and building recurring and repeatable income, giving a more robust business model. Acquisitions have brought scale and added range and reach, building on organic growth from leveraging of the brands with their highly engaged audiences. Cash flow is strong, with tight working capital management, and the balance sheet is modestly geared. This progress has resulted in impressive share price performance, but we still consider that the rating does not yet fully reflect the opportunity.
Year end |
Revenue (£m) |
PBT* |
EPS* |
DPS |
P/E |
Yield |
09/16 |
59.0 |
2.3 |
9.2 |
0.0 |
41.7 |
N/A |
09/17 |
84.4 |
8.3 |
21.0 |
0.0 |
18.3 |
N/A |
09/18e |
91.4 |
13.6 |
22.1 |
0.5 |
17.4 |
0.1 |
09/19e |
92.1 |
14.6 |
23.1 |
1.0 |
16.6 |
0.3 |
Note: *PBT and EPS are normalised and fully diluted, excluding amortisation of acquired intangibles, exceptional items and share-based payments.
Acquisition integration, FY18 to date on track
With three substantive acquisitions within a year, it is a considerable achievement for management to have completed the integration of the first two on plan and to be on track with the third (acquired two months before the year-end). It is even more of an achievement not to have sacrificed organic growth or working capital discipline in the process. FY18 trading to date is in line with management expectations. The strong cash performance means that the board is now considering the payment of a dividend for the year and we have built this prospect into our modelling.
Buying and adding value
As Future migrates its content to digital it becomes inherently more profitable, unlike many other media companies. By buying print assets at modest valuations, it can leverage the brands and the content by adding them to its existing proprietary platform. With its data-centric approach, it is in a strong position to drive digital revenues and also to add e-commerce opportunities. Content can generate further revenues at high margin by being reused across the group’s range of channels. A growing events portfolio further increases brand engagement and brings attractive working capital characteristics.
Valuation: Further upside potential
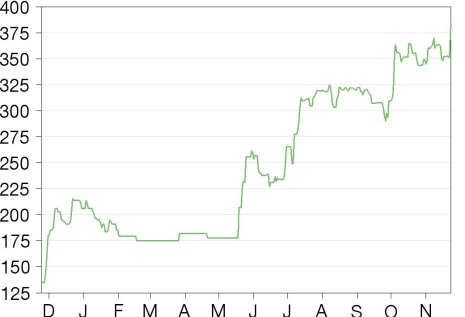
The shares have climbed over 190% from 132p in November 2016 as confidence has grown in management’s strategy and the prospects for delivering good financial performance. The placing in July 2017 to part-fund the acquisition of Home Interest was at 250p. At the current price, we nevertheless regard the shares as being at a discount to peers on a sum-of-the-parts basis, which implies a share price of 416p based on FY19e EV/EBITDA.
Investment summary
Company description: Innovative specialist media platform
Future is a global platform business for specialist media. It has transitioned over a short period from a primarily publishing company to a group centred on content and its delivery across numerous channels, on a strong and scalable technical platform. While its subject areas have broadened out with recent acquisitions, all its audiences are characterised by their enthusiasm for the subject matter, whether it be rock music, house renovation or consumer technology. Being the authoritative voice in these subject areas gives the group the potential to use its brands to generate a wider range of revenue streams, including e-commerce and events, which have been growing strongly. With the proprietary website template in place, it is relatively straightforward to launch new websites on a shorter timescale than would previously have been possible. The group has two divisions: Media and Magazines. The former includes revenues from digital display advertising, e-commerce (affiliate marketing) and events, all of which are based on content and data. The latter produces 60 specialist and focused publications and more than 430 bookazines, with a total circulation of over one million.
Valuation: Still some further upside potential
The share price has performed very strongly over the last year, increasing from 132p in November 2016. The group does not have an obvious peer or peer group, as the range of its activities has increased. With the increased prominence of the e-commerce and events in the mix we have adopted a sum-of-the-parts approach using three peer groups: consumer publishing; events and exhibitions; and online retail/performance marketing. We then weighted the respective market ratings of these groups according to the mix in our model for FY18. This exercise showed Future trading at a discount of 14% on EV/EBITDA for FY18e, and 5% on FY19e. We then sense checked this with a reverse DCF, which indicated that on a 23% EBITDA margin in the medium term and 3% top-line growth, there would be around 8% upside.
Financials: Organic and acquisition growth
The FY17 results clearly demonstrate that management is delivering on its strategic objectives of leveraging its brands and building diverse revenue streams.
■
Strong performance at group level on both organic and acquisitional fronts, despite the structural decline in print.
■
Gross profit from Media should outstrip that from Magazines in the current year.
■
Tight working capital management has kept the balance sheet under control with year-end net debt of £10m, forecast to reduce to £4.4m by end FY18. The end of HMRC payments in June 2018 frees up further cash flow thereafter with balance sheet forecast net cash for end FY19.
■
Management is now considering the payment of dividends.
Sensitivities: Take-up of innovation
The main sensitivity within our modelling is with regard to the pace of growth of the additional revenue streams, such as e-commerce and events. The outlook for digital display advertising is still set fair (and well ahead of traditional media), but marketing budgets are always sensitive to economic and geopolitical concerns. The high exposure to programmatic provides a degree of protection here. Continuing structural reductions in print are anticipated, but the pace of change may not be as we project. As with any tech-based group, there will always be IT and systems risks, and data protection is an additional potential factor. As the group grows its international reach, currency management will be a more important factor.
Company description: Specialised media
“In today’s hypercompetitive landscape, entertainment and media businesses designed around and for fans command multiple strategic advantages. They know more about who their users are, what they want, and how and where to deliver it. Fans spend more per capita and are less likely to churn. Today’s fans recruit tomorrow’s.”
PwC Perspectives from the Global entertainment and media outlook 2017-21
Future’s business model is based firmly on being at the centre of a fan’s interaction with the object of their enthusiasm. Future has transitioned rapidly over the last three years to become a specialist platform business, centred on data, with content pertinent to a broadening range of interest groups. While these cover a wide range of verticals, all have in common audiences that are enthusiastic about the subject area, whether it is rock music or home renovation. This audience commitment allows the group to drive an increasingly diversified set of income streams, from website and magazine advertising, through events and e-commerce to licensing and subscriptions. The quality of the content is essential to retain and grow credibility and engagement with the audiences, while the data derived from that engagement is crucial to driving advertising as well as the newer revenue streams, particularly e-commerce. Through this, the group is building a more robust business model, while the platform approach allows for a higher element of scalability as the group develops. The data-centric approach allows for content to reach better optimised audiences and delivers a more targeted market for advertisers, consequently of higher value.
As the business mix moves more towards digital, Future becomes increasingly profitable. Buying print assets at anywhere between1-5x EBITDA provides a good return simply on a DCF basis. However, the group can add revenue by reusing the content, which then flows through at high margin, such that the overall profit is greater. The acquisition of Imagine provided a step-up in scale, which made the Magazine business more efficient. The purchases of Team Rock and Home Interest were different. The former was bought at an attractive price and Future has added digital revenue. Home Interest brought in a strong portfolio of events brands that can be developed further, with a print business bought on a low valuation. The content within this is being reused in bookazines and in licensing, as well as in the newly launched website, www.realhomes.com that will generate greater audience and bring in e-commerce revenues.
Future was founded in 1985 but underwent substantial changes to its leadership, strategy and activities over recent years. Following a period of considerable churn at the top of the organisation from October 2011, the current leadership team of CEO Zillah Byng-Thorne and CFO Penny Ladkin-Brand has been in place since June 2015; Zillah joined in November 2013 as CFO and was appointed CEO in April 2014. She was previously CFO at Trader Media (the owner of Auto Trader) from 2009-12 and interim CEO there from 2012-13. Prior to Trader Media, Zillah was commercial director and CFO at Fitness First and CFO of Thresher. Penny also has a background in digital media and digital monetisation and was previously commercial director at Auto Trader Group, working alongside Zillah. Penny is a chartered accountant. Chairman Peter Allen is to step down at the AGM in February 2018 after more than six years with the group.
A global platform for specialist media driven by strong brands
|
Exhibit 1: FY17 revenue by segment/activity |
Exhibit 2: FY17 revenue by geography |
|
|
|
Source: Future accounts, Edison Investment Research |
Source: Future accounts |
|
Exhibit 1: FY17 revenue by segment/activity |
|
|
Source: Future accounts, Edison Investment Research |
|
Exhibit 2: FY17 revenue by geography |
|
|
Source: Future accounts |
The group reports its financial results in two segments, Media and Magazines, which are described in detail below, while the broad segmentation within those segments is shown in Exhibit 1, above. Management’s objective is to be “a global platform for specialist media with scalable, diversified brands”. While the group’s infrastructure and content generation is primarily located in the UK, the US is a substantial market for the group and content is appropriately localised.
The technology platform, built in-house, has an integrated proprietary content management system and e-commerce functionality, and is designed to be scalable. The content itself – and, crucially, the data that are derived from its consumption – is focused on specialist (and high-value) segments, particularly gaming and entertainment; technology; field sports; creative and photography; music; knowledge and science; and home interest.
The five largest brands accounted for 47% of FY17 pro forma revenues (ie assuming that the acquisition had been in for a full year). Home Building & Renovating, acquired with Home Interest, is the largest, followed by TechRadar, GamesRadar+, PC Gamer and TeamRock.
Redefining and reorientation of the portfolio
Growth has primarily been through acquisition as the scale and reach has quickly been scaled up. Over the last three years, Future has undergone significant change, first narrowing and simplifying the portfolio and activities, then expanding through acquisition and organic brand development. It has considerably broadened its revenue streams. The acquisitions have been:
■
July 2015: Net Communities, a B2B technology media publisher with expertise in third-party ad sales (price undisclosed).
■
April 2016: Noble House Media, a multi-platform publishing company specialising in the technology sector, with particular focus on mobile and wireless. This added key events: Mobile Choice Awards and Mobile Industry Awards. Price: £0.245m.
■
May 2016: various magazine and events assets from Blaze, in the music and field sports sectors. These were purchased for £0.480m plus £0.320m deferred, dependent on profit margin achievement. This included 10% of the National Game Fair, an event to complement the field sports content.
■
June 2016 (completed October 2016): Miura (Holdings), but announced as Imagine Publishing. This was a significant scaling up of the publishing interests and was funded by the issue of 179,567,841 shares (1,197,118 post 15:1 share consolidation in February 2017). The value of the total consideration was £15.5m. £5.3m of net debt was refinanced as part of this transaction.
■
August 2016: Next Commerce, an Australian price comparison network reaching across South-East Asia. This expands the in-house, e-commerce capabilities built with the Hawk platform. An initial consideration of £286k was paid, with an additional payment of £700k made in January 2017 after 2016 revenue targets were met.
■
January 2017: assets of Team Rock (out of administration) for £0.8m (including £0.2m goodwill).
■
July 2017: Acquisition of Home Interest for a cash consideration of £30.25m, representing 2.5x historical (2016) revenues and 8.2x pro forma historical EBITDA. The purchase was part-funded through a placing at 250p raising £22m gross, with the balance debt-funded (similar terms to existing arrangements) and consolidated from 1 August 2017.
Media division (41% of FY17 revenues)
The media segment includes the group’s consumer and ‘prosumer’ websites, along with the associated e-commerce and the events business, which includes major shows such as The Home Building & Renovating Show (acquired with Home Interest) and The Photography Show (the UK’s largest photography event). The segment will represent a higher proportion of group revenues going forward as a result of the acquisitions. Edison’s model shows Media revenues rising from 40% of the FY17 total to 52% in FY19e and the gross contribution already being above that of Magazines in FY18e.
Future hosts a range of B2C and B2B websites, the most prominent of which are its core brands TechRadar (the number one UK consumer technology site; in the top 10 in the US), GamesRadar+, PC Gamer (a leading gaming authority worldwide, now with associated events and a membership club), and Creative Bloq, which combines content on creative design and technology. Digital display advertising is the largest source of revenue for the segment (over 50% of FY17 in our modelling), with e-commerce at around a quarter, and the balance coming from Events and a smaller element of licensing, subscriptions and memberships.
The group’s online audience has built well, with organic growth of 9% year-on-year boosted to +16% by the acquisitions, giving 53.3 million monthly online users in Q417.
There are a number of opportunities identified by management to drive both revenue and margins, leveraging the brands, shown in Exhibit 3 below. The e-commerce opportunity is self-evidently an attractive path to develop, with the bulk of the group’s e-commerce revenues effectively derived from affiliate marketing. Data management is crucial, driving the optimisation of the digital content (optimising natural search rather than necessitating purchase of keywords), driving advertising revenues and in linking to transactions, directly through the group’s proprietary e-commerce platform, ‘Hawk’. Hawk is a price comparison engine, which serves up relevant product, based on an algorithm. It ingests more than 160m product offerings per day in North America and western Europe, with pricing updated four times daily. Brands such as TechRadar are typically very close to the point of purchase as people investigate their options and Hawk generated £78m of revenues for Future’s e-commerce affiliate partners in the year to March 2017 (including £14m on Black Friday alone). Future earned commission of £6.0m on these transactions. Hawk has been built in such a way as to make expansion straightforward across multiple brands. Future also owns GetPrice, an Australian e-commerce platform that is complementary to Hawk in offering other retailers a self-serve platform (Amazon is reportedly launching, including Marketplace, in Australia this week). The technology underlying GetPrice is licensed internally, including to TechRadar.
The group is also developing brand extensions, such as T3Baby (launched January 2017), which are proving that the concept can be rolled out into other product areas. This bodes well for the earning potential of Home Interest. As well as these brand extensions, the website platform allows for new websites to be launched quickly and at low cost, especially with the level of content being generated across the group and with the ability to incorporate the e-commerce from the off. New websites launched include www.digitalcameraworld.com, www.theradar.com and www.realhomes.com. Realhomes.com is the launch of a new umbrella Home Interest content site, while TheRadar agglomerates content across a wider range of consumer products in one hub.
Exhibit 3: Key Media growth areas
Revenue growth range |
Gross Margin range |
|
Ads & integrated marketing |
0-10% |
80%+ |
E-commerce |
25%+ |
80%+ |
Content marketing |
0-10% |
70%+ |
Events |
0-10% |
60%+ |
Licensing |
0-10% |
80%+ |
Source: Future, Edison Investment Research
Events are also a good growth area for Future, with obviously attractive working capital characteristics. The Home Interest purchase has scaled up this aspect of group activity and brings in additional expertise that can be shared across other shows and events for group brands. Home Building & Renovating Show is the largest brand in the Home Interest portfolio, accounting for roughly £9.7m (76%) of its revenues in 2016, of which two-thirds was from exhibitions across seven annual events. In total, nine annual events were acquired during the year.
Future has also identified opportunities for digital licensing of content and franchising of brands, as well as licensing the technology platform, to third parties. Ten new digital and print licences have been signed in the past year, expanding the geographic reach to Spain, China and the Middle East. Strategic content and technology partnerships have been signed with parties in India and in the Gulf.
Magazine division (59% of FY17 revenues)
The division publishes over 60 specialist publications, across sectors such as technology, games and entertainment, music, creative and photography, field sports, knowledge and home interest. These include core brands such as Digital Camera Magazine (the best-selling photography magazine in the UK), Classic Rock, How it Works, Homebuilding & Renovating, Official PlayStation, T3, Total Film and All About History. As with the Media division, there has been a focus on driving a diversification of the revenue streams to improve the quality of the earnings. The largest element of divisional revenue is the news trade sales, where the acquisitions of Imagine and Home Interest have contributed to the top line progress. We estimate that print advertising revenues were under 10% of FY17 group revenues. Within the extant Future portfolio, there has been an emphasis on building the subscriber base and, at the year-end, there were 462,000 global subscribers across group titles. Subscriptions accounted for around one-third of content revenues.
2016’s purchase of Imagine introduced a range of bookazines to the portfolio, with much longer shelf lives and retailing in the £10-20 range. The titles were focused on the technology and knowledge/science markets across print, online and digital formats. This range and production capability has since been expanded, with over 430 published in FY17, with global circulation of over one million. Bookazines provide a particularly efficient way of testing out market demand in particular niches on a lower-risk basis than a full magazine launch and take advantage of trending subject areas. They also allow Future to take secondary monetisation of magazine content.
The recent acquisitions have led to a substantial scaling up of the magazine division, which has allowed for considerable operational efficiencies to be realised. The Imagine and Team Rock acquisitions have been fully integrated and good progress has already been made on folding in the Home Interest purchase, which is expected to be fully integrated by the end of December 2017.
Good growth in targeted areas
Digital ad spend continues positive trend
The UK digital ad spend market continues to grow strongly as consumers increase their online content consumption. The latest IAB/PwC study, covering H117, shows digital revenues at £5.65bn, ahead by 13.8% over the comparative period, with search accounting for just over half. Display accounted for 36%, with mobile the dominant engine of growth. Print advertising continues to fall away, with readers continuing to move to digital alternatives. Industry statistics that particularly refer to magazines are not particularly relevant to Future’s prospects due to their weighting toward celebrity culture and ‘women’s’ interests publications. In any event, the print advertising proportion of Future’s group revenues is now well below 10%.
|
Exhibit 4: UK ad spend 2016-18e |
Exhibit 5: US ad spend 2016-18e |
|
|
|
Source: AA/WARC |
Source: Magna Global |
|
Exhibit 4: UK ad spend 2016-18e |
|
|
Source: AA/WARC |
|
Exhibit 5: US ad spend 2016-18e |
|
|
Source: Magna Global |
E-commerce builds share
The US and the UK are the world’s second and third largest e-commerce markets behind China, valued at $340bn and $99bn, respectively (source: Shopify), with Nielsen estimating that online purchases accounted for 12.5% of UK and 8.1% of total retail sales in 2016. This will obviously vary widely by sector vertical, but the consumer tech arena, in which Future has an especially strong presence, is one of those with the highest e-commerce penetrations. Nielsen is currently projecting that online retail in the US will grow by a 12.2% CAGR through to 2020. Globally it projects growth of 20% over the same timescale to reach a retail value of $4tn as less developed markets accelerate.
Events build engagement
The UK exhibitions sector has good momentum, with the latest UFI Barometer showing 71% of companies expecting to increase their turnover in H217 and 90% in FY18, although only 44% expect their operating profits to be moving ahead in FY17. The pattern is not uniform, though, and in general terms, larger exhibitions have been outperforming the smaller ones. However, the statistics include both B2B and B2C. Live B2C events have gained good traction, particularly with ‘millennials’, where the opportunity to participate in some form is particularly attractive. The high profiles of Future’s brands give a clear marketing edge in its chosen verticals. One of the highest profile organisations, MCM (the owner of the Comic Con franchise), has just been bought out by ReedPOP (part of RELX) for an undisclosed price, which market observers have put at over £17.5m.
Sensitivities
Future is a consumer-facing media business and many of its sensitivities relate to broader markets. In particular, we identify:
■
Economic backdrop. A downturn in consumer confidence or even prolonged uncertainty about the outlook tends to lead to reduced advertising spend. With digital marketing and the increased ability to audit the returns on advertising spend, there should be greater resilience as spend is focused on optimised channels results. Where the advertising is targeted, directly relatable to the content and near the point of purchase, this should increase the attractiveness to those controlling the budgets.
■
Maintaining credibility/competition. Future has brands that are either number one or number two in their verticals. In order to retain this status, the content, relevance and engagement need to stay at the highest levels. IP management is key – ensuring that IP created either within the content or its associated data is leveraged to best advantage. In fast-moving consumer markets, maintaining credibility is crucial, as is reacting and shaping the product to the shifting needs of the market. Some markets may fragment; others may disappear over short time frames.
■
IT/platform risk, data protection/privacy, fraud. The IT risk covers a number of separate potential issues, principally those of platform risk, where some sort of failure affects the ability of the group to function, or of data risk. A number of high-profile incidents of data breaches in other organisations have shown the reputational risk, as well as the direct data security risk.
■
Shift to digital. This has been a fact of life for media companies for so long now that business models are predicated on falling print copy revenues and on falling print advertising. The sensitivity is more to do with a sharper deviation from trend than has been built into the model, particularly with respect to the alignment of overhead.
■
Delivery of acquisition integration benefits. Future has built up a considerable bank of experience in corporate transactions, initially focused on sales and more recently on purchases. To date, the record on achieving integration benefits to the budget and timescale anticipated has been strong. The purchase of Imagine Publishing was on a larger scale than the previous transactions, with a more complex integration. However, this has also been integrated to plan and to schedule. The addition of Home Interest may generate additional benefits to those currently built into our forecasts as capabilities such as e-commerce are added in.
■
Failure to capitalise on new business model. New approaches to monetisation, such as the e-commerce income stream, may not continue to build as they have to date, or commission rates may come under pressure. Events revenues may not prove sustainable in the face of changed patterns of consumer spend or as competitive events are staged.
■
Currency. Sterling weakness should be a net benefit to the group, with the translation of overseas earnings on a predominantly UK-based infrastructure. Transactions are in local currencies wherever possible and assets and liabilities are matched as far as practicable. Debt is denominated in sterling. As e-commerce revenues build, currency management becomes more complex.
Valuation
We have looked at Future’s valuation in the context of peers on a sum-of-the-parts basis. We have also sense checked with a reverse DCF based on a range of medium-term revenue growth assumptions and EBITDA margins.
Peer group based on sum-of-the-parts
Future has a growing range of revenue streams and we have tried to capture this in our peer group comparison. We have grouped together consumer-facing media stocks (which may also have substantial proportions of online-derived income), quoted events-based companies and purer e-commerce/marketing performance-driven quoted businesses. The ratings accorded to these business segments vary considerably, particularly on a traditional P/E basis, which disadvantages the e-commerce companies.
Exhibit 6: Peer groups across group activities
Name |
Price - reporting currency |
Market cap (m) |
EV/ EBITDA last (x) |
EV/ EBITDA 1FY (x) |
EV/ EBITDA 2FY (x) |
P/E last (x) |
P/E 1FY (x) |
P/E 2FY (x) |
Hist EV/Sales -1FY (x) |
Div yield last (x) |
EBITDA margin last (%) |
Consumer media |
|||||||||||
Bloomsbury Pub. (£/p) |
181 |
136 |
8.6 |
8.6 |
7.5 |
16.8 |
14.3 |
13.5 |
0.9 |
3.7 |
9.8 |
Time Out Group (£/p) |
1.40 |
187 |
-ve |
-ve |
-ve |
-ve |
-ve |
-ve |
6.1 |
0.0 |
-ve |
Reworld (€)* |
1.96 |
71 |
16.6 |
8.6 |
5.0 |
34.5 |
13.7 |
0.4 |
0.0 |
4.6 |
|
Axel Springer (€) |
62.02 |
6,693 |
10.6 |
12.9 |
11.5 |
26.6 |
24.0 |
21.3 |
2.1 |
3.1 |
24.0 |
Stroeer (€) |
59.56 |
3,296 |
15.8 |
12.2 |
10.8 |
40.6 |
19.1 |
17.2 |
4.2 |
1.8 |
22.2 |
Schibsted (NOK) |
237.30 |
51,874 |
28.3 |
22.3 |
17.2 |
77.9 |
49.9 |
33.0 |
4.4 |
0.7 |
12.7 |
Meredith Corp ($) |
54.25 |
2,419 |
8.5 |
9.7 |
8.6 |
12.8 |
16.0 |
13.9 |
1.8 |
3.7 |
21.2 |
Time Inc ($) |
12.65 |
1,260 |
15.5 |
5.4 |
5.1 |
10.8 |
11.7 |
9.9 |
0.7 |
6.0 |
4.5 |
Average |
14.8 |
11.4 |
9.4 |
30.9 |
24.2 |
17.5 |
2.6 |
2.4 |
14.2 |
||
Events |
|||||||||||
Ascential (£/p) |
349 |
1,398 |
21 |
14 |
12 |
49.6 |
19.8 |
18.3 |
5.4 |
1.3 |
26 |
ITE Group (£/p) |
178 |
478 |
18.8 |
18.3 |
33.2 |
21.9 |
21.6 |
3.2 |
2.5 |
7.0 |
|
UBM (£/p) |
734 |
2,892 |
11.6 |
11.5 |
31.9 |
14.7 |
14.7 |
3.7 |
3.0 |
23.7 |
|
Tarsus Group (£/p) |
306 |
346 |
21.7 |
10.4 |
13.9 |
37.4 |
11.5 |
16.9 |
3.3 |
3.0 |
29.3 |
Informa (£/p) |
7.41 |
6,102 |
22.8 |
13.1 |
12.5 |
23.7 |
16.0 |
14.9 |
4.0 |
2.6 |
25.1 |
Average |
21.7 |
13.5 |
13.7 |
35.2 |
16.8 |
17.3 |
3.9 |
2.5 |
22.2 |
||
E-commerce/Performance marketing |
|||||||||||
XLMedia (£/p) |
210 |
325 |
11.6 |
9.6 |
9.1 |
17.5 |
15.0 |
14.0 |
2.1 |
5.4 |
32.8 |
Gear4Music (£/p)* |
738 |
154 |
42.0 |
38.4 |
30.8 |
63.5 |
73.8 |
55.3 |
2.7 |
0.0 |
6.5 |
BOOHOO.COM (£/p) |
187 |
2,152 |
58.1 |
38.9 |
28.3 |
90.9 |
66.9 |
52.0 |
2.1 |
0.0 |
11.9 |
ASOS (£/p) |
5,675 |
4,746 |
27.2 |
21.4 |
73.6 |
58.4 |
46.7 |
2.5 |
0.0 |
6.3 |
|
Zalando (€) |
4,069 |
10,071 |
35.3 |
32.6 |
26.2 |
92.2 |
75.1 |
60.0 |
2.7 |
0.0 |
7.0 |
Yoox Net-A-Porter (€) |
29.13 |
3,903 |
26.9 |
22.4 |
17.0 |
68.1 |
67.3 |
46.8 |
3.2 |
0.0 |
7.7 |
NAHL Group (£/p) |
1.48 |
68 |
4.4 |
5.3 |
5.3 |
5.7 |
6.2 |
7.7 |
2.1 |
12.8 |
34.9 |
Ingenta (£/p) |
1.56 |
26 |
20.3 |
19.4 |
14.8 |
17.6 |
30.0 |
18.6 |
1.4 |
0.6 |
8.1 |
Average |
28.4 |
24.2 |
19.1 |
53.6 |
49.1 |
37.6 |
2.3 |
2.4 |
14.4 |
||
Weighted average |
17.3 |
13.2 |
11.1 |
34.2 |
26.4 |
19.9 |
2.7 |
2.4 |
15.1 |
||
Future |
350.0 |
159 |
15.8 |
10.4 |
9.7 |
16.7 |
15.9 |
15.2 |
2.1 |
0.0 |
13.0 |
Rating discount |
-8% |
-21% |
-12% |
-51% |
-40% |
-24% |
-24% |
-100% |
-14% |
||
Parity share price implied |
397 |
464 |
416 |
||||||||
Source: Bloomberg, Edison Investment Research. Notes: *Edison Investment Research forecasts. Prices as at 20 November 2017.
For ease of comparison, we have then weighted the resulting figures by the proportion of Future revenues anticipated for each type of activity within our FY18 modelling (so as to smooth out the impact of the timing of acquisitions). The e-commerce/performance marketing stocks are clearly more highly valued by the markets than the consumer media companies, with the quoted events sector falling between the two. Exhibit 6 shows that Future’s faster EBITDA growth puts it at a discount on the multiple to the weighted peers for the current year and one year out of 21% and 12% respectively, narrowed to 14% and 5% respectively with the pre-results rally to 384p. Parity on year two would imply a share price of 416p.
DCF sense check
We have also looked at the current valuation in the context of a reverse DCF, where we work with a fixed WACC of 8.0% and a terminal growth rate of 2%, then look at the variance under a range of EBITDA margin and medium-term growth rate scenarios. Medium-term in this context is defined as FY20-24e, ie beyond our published forecast period. For FY19, our modelled EBITDA margin is just below 20%. If we were to assume further modest expansion as the platform is leveraged across more brands to 23% on conservative top-line growth of 3% (and by that stage, the revenue contribution from media would clearly outstrip that of magazines – assuming no further acquisitions), then the implied share price derived is 415p, still around 8% higher than the current level despite the further rally in the share price to 384p.
Exhibit 7: Reverse DCF
Medium term growth rate |
||||||
1% |
2% |
3% |
4% |
5% |
||
EBITDA mgn |
19% |
3.03 |
3.16 |
3.29 |
3.43 |
3.58 |
20% |
3.22 |
3.36 |
3.51 |
3.66 |
3.81 |
|
21% |
3.42 |
3.57 |
3.72 |
3.88 |
4.04 |
|
22% |
3.62 |
3.77 |
3.94 |
4.10 |
4.28 |
|
23% |
3.82 |
3.98 |
4.15 |
4.33 |
4.51 |
|
24% |
4.01 |
4.19 |
4.37 |
4.55 |
4.75 |
|
25% |
4.21 |
4.39 |
4.58 |
4.78 |
4.98 |
|
Implied margin |
23.1% |
22.3% |
21.6% |
20.8% |
20.1% |
|
Source: Edison Investment Research. Note: Prices in pounds sterling.
Financials
Reaching the gross contribution tipping point
Future’s earnings story centres on the imminent shift in balance between the two divisions, with the scaling up in Magazines and the acquisitions partially masking the good progress being made in the Media division. This is further layered with the combination of acquired and organic growth in the mix. The effect is easiest to visualise at the gross contribution level as the contribution margins between the two divisions vary.
Exhibit 8: Divisional breakdown history and forecasts
Year-end Sept |
FY16 |
FY17 |
growth |
FY18e |
growth |
FY19e |
growth |
Media revenue (£m) |
23.9 |
34.1 |
43% |
43.7 |
28% |
48.2 |
10% |
Magazine revenue (£m) |
35.1 |
50.3 |
43% |
47.7 |
-5% |
43.9 |
-8% |
Total revenue (£m) |
59.0 |
84.4 |
43% |
91.4 |
8% |
92.1 |
1% |
Media gross profit (£m) |
19.1 |
27.6 |
44% |
36.5 |
32% |
41.3 |
13% |
Magazine gross profit (£m) |
23.4 |
33.4 |
42% |
31.6 |
-5% |
29.2 |
-8% |
Total gross profit (£m) |
43.0 |
61.0 |
43% |
68.2 |
12% |
70.5 |
3% |
Media gross margin |
80.1% |
80.9% |
83.5% |
85.8% |
|||
Magazine gross margin |
66.8% |
66.4% |
66.4% |
66.4% |
|||
Overheads (£m) |
(37.4) |
(50.0) |
(51.5) |
(52.5) |
|||
EBITDA (£m) |
5.2 |
11.0 |
112% |
16.7 |
52% |
17.9 |
7% |
EBITDA margin |
8.8% |
13.0% |
18.3% |
19.5% |
Source: Future accounts, Edison Investment Research
The acquisitions obviously bring a greater degree of complexity into the comparisons, with Imagine effectively in for a full year, Team Rock from January 2017 and with two months from 1 August 2017 of Home Interest. Within Media, the acquisitions accounted for 9% of the revenue growth, with underlying revenues up by 34%. Around 10% of the growth is attributable to currency movements, giving a like-for-like growth figure of 24%, which is clearly a very strong performance.
|
Exhibit 9: Gross profit by activity (£m) |
|
|
Source: Future accounts, Edison Investment Research. Note: Green represents Media. |
The magazine market is in structural decline and this is built into our modelling. However, this does not mean that it does not have attractive attributes for Future’s business. It brings well-positioned brands with loyal audiences and furnishes the group with extensive and expert content. For FY17, magazine revenues were ahead by 43% as the acquisitions brought substantial additional volume. Stripping these out, the underlying rate of decline was 9% over the prior year.
In Exhibit 9, above, we have shown our assumptions on the underlying elements which make up the divisions. This shows how the media revenues will increase as a proportion of the whole, particularly buoyed by the growth potential for e-commerce revenues as the number of websites grows, broadening the reach. The quality of the earnings is also improving. The group’s definition of recurring revenue streams is “revenue that is predictable and has annuity-like characteristics”, which clearly includes the subscription revenues but also some elements of the e-commerce. Management estimates that these revenues represented 27% of the FY17 total (FY16: 25%).
Under our modelled scenario, for every £1 of revenue earned in the Media division, the group could afford to drop £1.24 in revenue from the Magazine division without having any impact on the group’s gross revenue.
Headcount obviously increased with the acquisitions, rising from 449 to 634 employees. Management continues to work to contain the operating costs, with total overheads increasing by 34% (compared to top-line growth of 43%). The economies of scale are being buoyed further by migrating onto a common content management system, which allows new brands and websites to be added much more easily. For FY18e, our model suggests overheads increasing by 3% while top line increases 10%, leading to an expansion of EBITDA margin from 13.0% to 18.7%. The following year we anticipate a further improvement to just below 20%.
Exceptional costs of £3.7m in FY17 included restructuring costs of £1.1m, a vacant property provision of £1.2m (mainly relating to surplus property in the US) and £1 .4m of acquisition and integration-related costs. The FY17 earnings per share figure benefited from a deferred tax credit of £2.2m, mostly arising from the recognition of losses in the US in prior years. The adjusted, fully diluted EPS of 21.0p compares to 9.2p in FY16, despite the issue of shares to part-fund the acquisition programme. A more standard tax position is expected for FY18 and this, together with an increase in the number of shares as new shares are issued as a result of incentive schemes, will restrain the progress at the EPS level in FY18e to 10% on EBITDA ahead by 57%. For the following year, forecast EBITDA growth of 10% translates into an increase in EPS of 6%.
Strong underlying cash flow
A good performance on working capital (an inflow of £4.7m) contributed to a strong net operating cash inflow, despite exceptional and tax items totalling £5.1m.
Capex was £1.8m (FY16: £2.5m) and we assume that it runs at £3.0m for the current year and FY19e. The shape of the cash flow in FY17 mostly reflects the impact of the acquisitions at a cost of £31.8m (Home Interest was bought for £30.25 cash), part-funded by the issue of equity amounting to £21.0m.
The group has an outstanding settlement with HMRC relating to a one-off transaction dating back to 2003. This has involved paying £85k per month in capital plus interest over five years from July 2013. This will therefore cease in the current financial year, when there will also be a final instalment of £2m. This obviously will improve the group’s cash profile from the last two months of FY18e onwards.
Future’s management is now considering paying a dividend from FY18e onwards. In our modelling we have assumed a payout for the year of 0.5p, payable as a final in FY18e and thereafter one-third as an interim, two-thirds as a final, with an ongoing progressive policy.
Balance sheet with plenty of capacity
Net debt at the year-end just reported was £10.0m, representing gearing of 16%, consisting of total debt of £20.1m partially offset by cash of £10.1m.
Despite the commencement of dividend payments that we have assumed, our modelling indicates that the positive cash flow will bring this figure down to £4.3m by end FY18e and push the group back into a net cash position the following year.
The group had facilities of £26.0m at the balance sheet date, renegotiated at the time of the Home Interest acquisition (with £0.6m repaid in October 2017). These consist of a £12.0m term loan, £11.4m of revolving credit and an uncommitted overdraft facility of £2.0m, with both term and revolving loans bearing a coupon of 2.8%.
Exhibit 10: Financial summary
£m |
2015 |
2016 |
2017 |
2018e |
2019e |
||
30 September |
IFRS |
IFRS |
IRFS |
IRFS |
IRFS |
||
INCOME STATEMENT |
check |
||||||
Revenue |
|
|
59.8 |
59.0 |
84.4 |
91.4 |
92.1 |
Cost of Sales |
(40.6) |
(16.0) |
(23.4) |
(23.2) |
(21.6) |
||
Gross Profit |
19.2 |
43.0 |
61.0 |
68.2 |
70.5 |
||
EBITDA |
|
|
3.6 |
5.2 |
11.0 |
16.7 |
17.9 |
Operating profit (before except.) |
|
|
0.8 |
2.8 |
8.9 |
14.2 |
15.0 |
Amortisation on acquired intangibles |
(2.3) |
0.0 |
(2.3) |
(6.2) |
(6.2) |
||
Exceptionals |
(2.5) |
(16.5) |
(3.7) |
(1.0) |
0.0 |
||
Share-based payments |
0.0 |
(0.5) |
(2.1) |
(2.5) |
(2.5) |
||
Reported operating profit |
(4.0) |
(14.2) |
0.8 |
4.5 |
6.3 |
||
Net Interest |
(0.6) |
(0.5) |
(0.6) |
(0.6) |
(0.5) |
||
Joint ventures & associates (post tax) |
0.0 |
0.0 |
0.0 |
0.0 |
0.0 |
||
Profit before tax (norm) |
|
|
0.2 |
2.3 |
8.3 |
13.6 |
14.6 |
Profit before tax (reported) |
|
|
(2.3) |
(14.9) |
0.2 |
3.9 |
5.9 |
Reported tax |
0.3 |
0.5 |
1.4 |
(1.9) |
(1.1) |
||
Profit after tax (norm) |
0.5 |
2.3 |
8.6 |
11.0 |
11.8 |
||
Profit after tax (reported) |
(2.0) |
(14.4) |
1.6 |
2.0 |
4.8 |
||
Minority interests |
0.0 |
0.0 |
0.0 |
0.0 |
0.0 |
||
Discontinued operations |
0.7 |
0.2 |
0.0 |
0.0 |
0.0 |
||
Net income (normalised) |
0.6 |
2.3 |
8.6 |
11.0 |
11.8 |
||
Net income (reported) |
(1.3) |
(14.2) |
1.6 |
2.0 |
4.8 |
||
Basic average number of shares outstanding (m) |
22 |
24 |
37 |
45 |
47 |
||
EPS - basic normalised (p) |
|
|
2.7 |
9.5 |
23.2 |
24.3 |
25.4 |
EPS - normalised, fully diluted (p) |
|
|
2.7 |
9.2 |
21.0 |
22.1 |
23.1 |
EPS - basic reported (p) |
|
|
(5.9) |
(58.8) |
4.3 |
4.4 |
10.2 |
Dividend per share (p) |
0.0 |
0.0 |
0.0 |
0.5 |
1.0 |
||
Revenue growth (%) |
(9.4) |
(1.3) |
43.1 |
8.3 |
0.7 |
||
Gross margin (%) |
32.1 |
72.9 |
72.3 |
74.6 |
76.6 |
||
EBITDA margin (%) |
6.0 |
8.8 |
13.0 |
18.3 |
19.5 |
||
Normalised operating margin (%) |
1.3 |
4.7 |
10.5 |
15.6 |
16.3 |
||
BALANCE SHEET |
|||||||
Fixed assets |
|
|
44.9 |
36.1 |
97.9 |
92.2 |
86.1 |
Intangible assets |
43.8 |
33.2 |
92.3 |
85.6 |
78.5 |
||
Tangible assets |
0.6 |
0.5 |
1.0 |
2.0 |
3.0 |
||
Investments & other |
0.5 |
2.4 |
4.4 |
5.4 |
4.4 |
||
Current assets |
|
|
19.5 |
15.8 |
24.5 |
30.0 |
40.2 |
Stocks |
0.5 |
0.4 |
0.7 |
0.7 |
0.7 |
||
Debtors |
15.3 |
12.4 |
13.6 |
16.0 |
18.4 |
||
Cash & cash equivalents |
2.5 |
2.9 |
10.1 |
13.2 |
21.0 |
||
Other |
1.2 |
0.1 |
0.1 |
0.1 |
0.1 |
||
Current liabilities |
|
|
(25.9) |
(25.1) |
(36.4) |
(37.0) |
(37.6) |
Creditors |
(20.7) |
(21.4) |
(29.9) |
(30.5) |
(31.1) |
||
Tax and social security |
(0.9) |
(1.4) |
(3.2) |
(3.2) |
(3.2) |
||
Short-term borrowings |
(4.3) |
(2.3) |
(3.2) |
(3.2) |
(3.2) |
||
Other |
0.0 |
0.0 |
(0.1) |
(0.1) |
(0.1) |
||
Long-term liabilities |
|
|
(7.1) |
(5.6) |
(24.7) |
(19.4) |
(16.0) |
Long-term borrowings |
0.0 |
(0.1) |
(16.9) |
(14.3) |
(10.9) |
||
Other long-term liabilities |
(7.1) |
(5.5) |
(7.8) |
(5.1) |
(5.1) |
||
Net assets |
|
|
31.4 |
21.2 |
61.3 |
65.8 |
72.7 |
Minority interests |
0.0 |
0.0 |
0.0 |
0.0 |
0.0 |
||
Shareholders' equity |
|
|
31.4 |
21.2 |
61.3 |
65.8 |
72.7 |
CASH FLOW |
|||||||
Operating cash flow before WC and tax |
0.8 |
5.2 |
11.0 |
16.7 |
17.9 |
||
Working capital |
(8.0) |
(2.1) |
4.7 |
(1.8) |
(1.8) |
||
Exceptional & other |
(0.4) |
0.0 |
(3.7) |
(1.0) |
0.0 |
||
Tax |
(0.5) |
(0.7) |
(1.4) |
(4.6) |
(1.1) |
||
Net operating cash flow |
|
|
(8.1) |
2.4 |
10.6 |
9.3 |
15.0 |
Capex |
(2.0) |
(2.5) |
(2.6) |
(3.0) |
(3.0) |
||
Acquisitions/disposals |
1.3 |
(0.3) |
(31.8) |
0.0 |
0.0 |
||
Net interest |
(0.6) |
(0.4) |
(0.6) |
(0.6) |
(0.5) |
||
Equity financing |
0.0 |
3.1 |
21.0 |
0.0 |
0.0 |
||
Dividends |
0.0 |
0.0 |
0.0 |
0.0 |
(0.4) |
||
Other |
0.0 |
(0.1) |
0.2 |
0.0 |
0.0 |
||
Net cash flow |
(9.4) |
2.2 |
(3.2) |
5.7 |
11.2 |
||
Opening net debt/(cash) |
|
|
(7.5) |
1.8 |
(0.5) |
10.0 |
4.3 |
FX |
0.1 |
0.1 |
0.0 |
0.0 |
0.1 |
||
Other non-cash movements |
0.0 |
0.0 |
(7.3) |
0.0 |
0.0 |
||
Closing net debt/(cash) |
|
|
1.8 |
(0.5) |
10.0 |
4.3 |
(7.0) |
Source: Future accounts, Edison Investment Research
|
|||||||||||||||||||||||||||||||||||||||||||||||||
|
|
Lotto24 extended its market leadership in 2016, with market share up from 26% to 31%. This demonstrates its core USPs: first mover advantage in the German online lottery market, management experience and marketing know-how. Despite a weak Q3, top-line growth remains strong (FY17 guidance of 10-15% billings growth). After heavy investment in technology and marketing, the business should reach FY17 EBIT break-even, with future profitability flexed according to jackpot opportunities. The stock has performed well but, in our view, there is plenty of upside, as online lottery continues to take a bigger slice of the overall German lottery market.