Last close As at 05/08/2026
—
— 0.00 (0.00%)
Market capitalisation
—
Research: Industrials
PIERER Mobility is a leading manufacturer of powered two wheelers (PTWs) focused on premium markets through the KTM, HUSQVARNA and GASGAS motorcycle brands. It looks set to add a new organic growth stream to its established track record as e-mobility markets continue to develop. The acquisition of the outstanding majority of PEXCO e-bikes and the development of new products focused on premium urban e-mobility markets addresses a new segment for the group, alongside continued expansion of the traditional core.
Written by
PIERER Mobility |
Pedal power combination |
Initiation of coverage |
Automobiles & parts |
4 February 2020 |
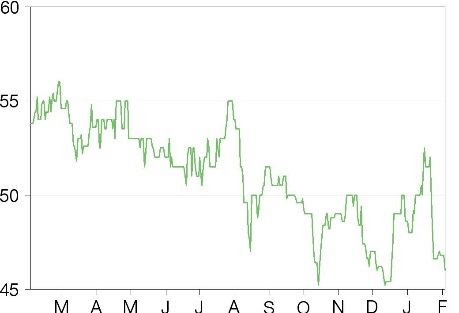
Share price performance
Business description
Next events
Analyst
PIERER Mobility is a research client of Edison Investment Research Limited |
|||||||||||||||||||||||||||||||||||||||||||||||||||||
PIERER Mobility is a leading manufacturer of powered two wheelers (PTWs) focused on premium markets through the KTM, HUSQVARNA and GASGAS motorcycle brands. It looks set to add a new organic growth stream to its established track record as e-mobility markets continue to develop. The acquisition of the outstanding majority of PEXCO e-bikes and the development of new products focused on premium urban e-mobility markets addresses a new segment for the group, alongside continued expansion of the traditional core.
Year end |
Revenue* (€m) |
EBIT* |
EPS* |
DPS |
P/E |
Yield |
12/18 |
1,462.2 |
128.7 |
1.82 |
0.30 |
25.3 |
0.7 |
12/19 |
1,520.1 |
132.0 |
2.42 |
0.30 |
19.0 |
0.7 |
12/20e |
1,658.1 |
115.5 |
1.75 |
0.30 |
26.3 |
0.7 |
12/21e |
1,756.7 |
142.1 |
2.25 |
0.30 |
20.4 |
0.7 |
Note: *Revenues, EBIT and EPS are continuing business, excluding amortisation of acquired intangibles, exceptional items, share-based payments. FY19 preliminary figures.
A strong and expanding brand leader
Based in Austria, PIERER Mobility (formerly KTM Industries) once again achieved record volumes of motorcycle sales in FY19, with 280k unit sales representing a 7% y-o-y increase. The company has set medium-term targets to grow core motorcycle volumes to 400,000 by 2022, achieving EBIT margins of 8–10% and the addition of the GASGAS brand should be a modest increment to that ambition. Growth will predominantly come from India, where the company enjoys a strong partnership with Bajaj Auto, and in other emerging markets including China, where low-rate production of new branded models should start this year with local partner CFMOTO. Continued market share gains in its historic markets where it targets premium and off-road segments provide a solid platform for organic growth.
Urban e-mobility adds further growth potential
PIERER Mobility is focusing on developing its e-mobility offering, looking to leverage its technology, know-how and commercial channels to establish itself as a global player in this market and take advantage of the strong structural growth trend in e-mobility. Management is primarily targeting the premium urban mobility (e-bikes, e-scooters) segment. We believe the recent acquisition of the remaining shares in PEXCO (e-bike manufacturer) shows the importance of the segment for the group. Although the segment is likely to be competitive, the development of a new potentially significant earnings stream should be incremental to the development of the core motorcycle business in the medium to long term.
Valuation: E-mobility potential yet to be reflected
Despite the strong track record of market share growth that has driven positive revenue and earnings development, PIERER Mobility continues to trade at a modest EBITDA discount to its PTW peer group. Our DCF-calculated fair value is €65.2 excluding our conservative e-bike market assumptions (as it is a new markets segment in an early phase of growth with execution risks attached), which we believe could potentially lift the value by 15% if successful.
Investment summary: Leveraging urban e-mobility
Leading motorcycle brand targets urban e-bike market
As of 22 October 2019, PIERER Mobility is the new name for the former KTM Industries headquartered in Wels, Austria. The company listed on the SIX Swiss Exchange in November 2016. It is also listed in Vienna, although this is likely to be terminated once an additional listing on the Frankfurt Stock Exchange (General Standard) completes in Q120 that may improve liquidity. The name change partly reflects an evolving growth strategy that now also targets penetration and growth of urban two-wheeler e-mobility markets. In December 2019 the company took full control of its e-bike division PEXCO, following the purchase of the remaining 60% majority stake previously held by the parent company Pierer Industrie. In 2020 GASGAS in Spain will be added as a third core motorcycle brand following the joint venture (60%) and industrial cooperation agreement.
Growing the core motorcycle business
At the core of its activities, PIERER Mobility is Europe’s largest manufacturer of motorcycles historically focused on the KTM and HUSQVARNA brands, and is adding the Spanish GASGAS brand in 2020. The group has an established track record of strong growth with a product range that emerged from the traditional off-road and sporting roots of the business that still represent around 40% of volumes. It has consistently gained market share with its premium products in developed markets and achieved record unit sales volumes of 280.9k in 2019.
Expanding presence in emerging markets
Historic exposure to massive PTW demand in emerging markets such as India and China was limited due to pricing levels and large domestic competitors. However, there is an increasing demand for premium products, which is being addressed through established high-quality partners. Joint ventures with Bajaj Auto in India and CFMOTO in China should lead to significant additional sales volume of HUSQVARNA and KTM products over the next two years as licensed production of further models starts in both countries, although the Chinese ramp up will likely be slow. These will provide the bulk of the growth to the targeted 400k annual group motorbike registrations in 2022.
Urban e-mobility provides an incremental growth opportunity
The move into urban e-mobility markets is a natural progression from the group’s PTW base. Using its branding, third-party manufacture based on efficient and reliable off the shelf technology including motors, sales of e-bikes, electric scooters and eventually electric motorcycles will be targeted at the premium end of the rapidly growing market. The increasing use of internally developed and specified components developed by PIERER Mobility should progressively provide a differentiating factor. Volumes should be incremental to the traditional activities providing significant additional revenue streams from already established European e-bike markets that are growing at well into double-digit rates.
Discount to peers looks anomalous
Despite displaying stronger growth dynamics than its PTW peer group, PIERER Mobility continues to trade at a modest discount on an EV/EBITDA basis although it is more closely aligned on an EV/sales multiple and trades at a premium on EV/EBIT. Our DCF valuation of €65.2/share is based on the core business together with the e-motorcycle potential. At present, it takes no account of the e-bike business of PEXCO, which we believe could add a further 15% to the value if our incremental (but conservative) estimates are achieved in the medium to long term.
Emerging markets, e-mobility drive long-term growth
PIERER Mobility is the PTW subsidiary of Pierer Industrie, which retains a 60.9% stake in the group. Pierer Industrie is an industrial holding company with interests in other well-known specialised engineering activities such as Pankl and SHW, as well as other electronics and software activities. The shares of PIERER Mobility have been listed on the SIX Swiss Exchange since 14 November 2016 and an additional listing in Frankfurt is expected in Q120, following which the listing on the Vienna Stock Exchange is likely to be terminated.
The largest sports motorcycle manufacturer in Europe
PIERER Mobility is a leading manufacturer of PTWs, focusing on premium motorcycles and two-wheeled electric vehicles. It is the largest sports motorcycle manufacturer in Europe. The company owns a 51.7% stake in KTM (the remaining 48.3% stake is owned by Bajaj Auto), which operates the motorcycles brands KTM, HUSQVARNA Motorcycles (acquired in 2013 from BMW) and the recently acquired GASGAS (in 2019, PIERER Mobility signed an industrial cooperation agreement with the owners of GASGAS Motorcycles; the GASGAS brand will be integrated with PIERER’s commercial platform over 2020). PEXCO is the fully owned e-bike business of the group, which operates with the R RAYMON and HUSQVARNA Bicycles brands.
|
Exhibit 1: Group structure |
Exhibit 2: 2019 revenues by geography |
|
|
|
Source: Company data, Edison Investment Research |
Source: Company data |
|
Exhibit 1: Group structure |
|
|
Source: Company data, Edison Investment Research |
|
Exhibit 2: 2019 revenues by geography |
|
|
Source: Company data |
KTM is the global leader in the off-road motorcycle market segment, where it has a market share of c 70%; this is the market segment where KTM built its reputation and track record. However, over the years, the group has expanded into other segments with the HUSQVARNA and KTM brands; nowadays off-road units represent c 50% of total sales (50% on-road). Overall, the company has a 12% share of its target markets in Europe and 9% in the US (both steadily increasing over time). Its key competitive advantage is the superior technology and quality of the products, well recognised by clients and reflected in strong brands that have been developed with extensive racing activities. The premium quality of the products is reflected in higher prices than competition (c 10%). The company operates globally with sales that are geographically diversified thanks to an ongoing process of internationalisation, with the core European market representing c 40% of the units sold, the US c 20% and India c 25% (as of FY19).
PIERER Mobility has experienced strong sales growth over the last several years and sold 280k units in FY19. The medium-term (2022) company target is to grow volumes to 400k units.
|
Exhibit 3: PIERER Mobility sales volumes by channel |
|
|
Source: PIERER Mobility |
The company’s headquarters are in Wels, Austria and it had an estimated 4,400 employees at the end of 2019. Its manufacturing capacity includes two production sites, one in Austria (Mattighofen) and one in India (Pune, owned and operated by Bajaj Auto). In 2019, 76% of the units sold were produced in Austria and 24% in India by Bajaj Auto. In addition, seven complete knocked-down or complete built-up facilities are operated in China, the Philippines, Malaysia, Brazil, Argentina and Colombia. The company has an extensive commercial global network of 2,956 dealers at the end of 2019 of which more than 2,165 (73%) related to KTM and the rest to HUSQVARNA. In total, 1,200 are in Europe with 650 in North America and around 500 KTM dealers in India and Indonesia.
Strategic focus is on emerging market growth and e-mobility
PIERER Mobility’s strategy is focused on strongly developing its presence in emerging markets (with India as a primary focus) and continuing to strengthen its market share in developed markets (mainly in North America, where its market share has been growing for a number of years, and in Europe, its largest market). To extend the product range, the company continues to invest significantly in R&D activities and leverage its racing know-how and technologies and incorporate it into serial production models. It has accelerated its growth plans in emerging markets thanks to important commercial, manufacturing and technology partnerships with local players. The most important is PIERER's strategic partnership with Bajaj Auto in India (units produced by Bajaj are targeted to grow by a CAGR of 17% in 2017–2022 to 200k). Bajaj Auto, the flagship company of the Bajaj Group, is the second largest motorbike manufacturer in the world and the largest three-wheeler manufacturer, with a total 5.0m units sold between April 2018 and March 2019. In China PIERER Mobility has created a JV with CF Moto that appears well positioned to take advantage of strong growth in the high-end motorcycle market (PIERER Mobility expects 20% pa growth rates in the overall Chinese market).
Longer term, PIERER Mobility is focusing on developing its e-mobility offering, looking to leverage its technology, know-how and commercial channels to establish itself as a global leader in this market and to take advantage of the transition to e-mobility, a strong structural growth trend for the industry. With certain electric models already available and many more to follow, PIERER Mobility is primarily targeting the premium urban mobility (e-bikes, e-scooters) segment, with 3–10kW power range. We believe the recent acquisition of the outstanding majority interest in PEXCO (an e-bicycle manufacturer) shows the importance of this business for the group.
Management team: An entrepreneurial story
PIERER Mobility is the result of the entrepreneurial career of Stefan Pierer, who founded the PIERER Mobility Group in 1987; he is CEO, majority shareholder and member of the executive board. Friedrich Roithner was appointed CFO in 2010 and has been part of the management team since 2007 after holding various auditing, finance and accounting roles at a leading auditing firm and at Austria Metall. Josef Blazicek, chairman of the supervisory board since 2008, is an entrepreneur and brings a wealth of expertise in capital markets, thanks to his experience in sales, trading and investment banking management at various banks and investment firms.
Industry overview and growth drivers
The global PTW market is estimated by PIERER Mobility to be around 56m units, split broadly evenly between motorcycles and scooters (where PIERER Mobility does not yet participate). Geographically, demand is skewed towards the high populous countries of the emerging markets especially India and China.
|
Exhibit 4: Global PTW market by region (millions of units) – total 56m in 2018 |
Exhibit 5: PIERER Mobility addressable PTW market (millions of units) – total six million in 2018 |
|
|
|
Source: PIERER Mobility |
|
Exhibit 4: Global PTW market by region (millions of units) – total 56m in 2018 |
|
|
Source: PIERER Mobility |
|
Exhibit 5: PIERER Mobility addressable PTW market (millions of units) – total six million in 2018 |
|
|
Source: PIERER Mobility |
PIERER Mobility’s target PTW market has been for motorcycles greater than 120cc that retail for over €2,500. The segment represents six million units accounting for only around 11% of the total global PTW market. The company had a market share of around 9.5% of this market in 2019 with registrations totalling 280.9, up 10% on 2018 and of which 66.2k were through Bajaj.
Exhibit 6: Motorcycle registrations 2019 by region (units)
Market |
Growth |
PIERER (KTM + HUSQVARNA) |
Growth |
Share |
||||
2018 |
2019 |
2018 |
2019 |
2018 |
2019 |
|||
Europe |
563,629 |
614,004 |
8.9% |
67,900 |
72,578 |
6.9% |
12.0% |
11.8% |
North America |
431,943 |
420,084 |
(2.7%) |
39,431 |
40,848 |
3.6% |
9.1% |
9.7% |
India |
1,032,231 |
867,542 |
(16.0%) |
46,261 |
63,380 |
37.0% |
4.5% |
7.3% |
Oceania |
67,793 |
62,491 |
(7.8%) |
9,477 |
9,877 |
4.2% |
14.0% |
15.8% |
Total |
2,095,596 |
1,964,121 |
(6.3%) |
163,069 |
186,683 |
14.5% |
7.8% |
9.5% |
Source: PIERER Mobility. Note: Motorcycles >120cc in markets where PIERER has a presence.
In 2019, PIERER Mobility’s main markets were less favourable than in 2018, falling by 6.3% overall. North America was down again modestly by 2.7% and India registrations fell by 16.0%.
PIERER Mobility outperformed all regions except Europe where growth in registrations of 6.9% was healthy but slightly below market growth of 8.9%. The company grew registrations in North America, but the main driver of volume growth was in India with a 37.0% increase in registrations. PIERER Mobility’s market shares were 11.8% in Europe (down 20bp), 9.7% in North America (up 60bp) and 7.3% in India up 280bp.
|
Exhibit 7: Motorcycles registrations and market shares 2019 (12 months rolling) |
|
|
Source: PIERER Mobility |
The introduction of Euro 5 emissions regulations from 1 January 2020, equivalent to automotive Euro 6 standards, is a challenge for PTW manufacturers. All new model road-going mopeds and motorcycles registered in Europe from 1 January 2020 must meet these standards, as must existing models from 1 January 2021 although off-road sports bikes have a dispensation until 2025. PIERER Mobility’s product range should prove to be compliant with these requirements.
Electric growth: Preparing for e-mobility revolution
PIERER Group was early in developing technologies for the e-mobility industry (the first commercial model, the high-performance Freeride E 16kW, was introduced to the market in 2014), but the company has been waiting for the markets to mature before accelerating its commercial and production efforts in this business. As several first movers in the e-bike and e-motorcycle/scooter markets have been accumulating losses while waiting to reach critical mass, PIERER Mobility’s strategy has paid off in our view as the experience of several first-movers makes clear that the challenge for EV manufacturers is to grow profitably, rather than just accelerating the top line. We believe PIERER Mobility is now ready to take on the huge opportunities (and challenges) posed by the largest driver of transformation of the industry in decades.
Several trends drive e-mobility market take-off
The adoption of e-bikes and scooters is increasing strongly in Europe, with high growth rates for both markets supported by structural long-term trends. Several drivers support the development of the industry: increased environmental awareness, the need to improve urban traffic, the adoption of environmental policies supporting cleaner transport means and the potential for cost savings compared to combustion engine vehicles and technological improvements.
In particular, regulation is likely to play a key role: in 2011 the European Commission published its Transport White Paper, which included key goals such as achieving virtually CO2-free city logistics by 2030 and phasing out conventionally fuelled cars in urban transport by 2050. The EU has also co-funded several projects to build fast-charging infrastructure. In China regulators have set an ambitious target of electric cars representing 60% of new sales by 2035 (although recently the country experienced a slowdown in electric car sales). In India the announced second phase of ‘Faster Adoption and Manufacturing of Electric Vehicles in India’ introduces incentives for the purchase of electric vehicles, focusing on two/three wheelers and public transportation. It has also proposed (but not yet approved) a target to achieve 100% electric sales for the three-wheeler segment by 2023 and for the two-wheeler market by 2025. This target would drive huge growth for the industry although it appears unrealistic, in our view.
In addition, we believe technology advancements and declining production costs for electric vehicles will support the transition to e-mobility: according to Harley Davidson, electric motorcycles will achieve cost parity with international combustion engine motorcycles as early as 2030. The key driver is the declining cost of batteries thanks to improvements in battery chemistry, new materials and economies of scale and other production efficiencies as the industry matures. Our analysis of battery chemistry and capacity investment suggests that reductions in battery prices are likely to continue. Even conservatively assuming a 10% pa fall in cost (nearly half the historical rate), EVs should reach price parity in most markets by 2024, spurring demand acceleration. We forecast a 10-fold growth in annual battery capacity by 2030 (a 23% CAGR), driven primarily by transport (90% of demand in 2030).
E-bikes: A large and booming market
E-bike sales have boomed over the last couple of years and growth forecasts have been revised up significantly. A 2017 forecast by the European Cyclists’ Federation (ECF) for 50 million e-bike sales in the EU in the period 2018–20 has been revised to 150 million for 2019–30 by Cycling Industries Europe, a federation recently founded by ECF. While historically e-bikes have been particularly popular among people over the age of 65, there is now growing demand from younger users, particularly commuters.
The e-bike market is an already well-developed industry (2.6m units sold in Europe in 2018, according to the German industry association, ZIV), which has experienced very strong growth rates (31% CAGR 2006–18). The largest European market, Germany, experienced a 22% CAGR in the period 2015–18 to almost one million units sold in 2018. Despite the recent growth, e-bike sales continue to represent a relatively small percentage of total European bicycles sales, 13% on our estimates. However, there are signs the percentage is likely to increase much more. In the large Dutch market, e-bike sales were higher than traditional bikes sales for the first time in 2018. Many industry experts expect this percentage to continue to increase: Claus Fleischer, CEO of Bosch eBike Systems, anticipates that by 2027 over 50% of new bikes sales in the EU will be e-bikes (>65% in Germany).
In addition to the European e-bike market, on which we expect PIERER Mobility to primarily focus, e-bike sales will continue to grow significantly elsewhere and the size of the potential market is extremely large. According to Deloitte more than 130 million e-bikes will be sold globally over 2020–23 (cumulative).
PEXCO: Taking advantage of booming e-bike sales
We consider the e-bike industry very competitive and characterised by low barriers to entry, with a high number of new entrants and incumbents competing against each other. In such an environment, we believe the players with strong brands that offer highly differentiated premium products and have well-established distribution channels offer the most compelling investment opportunities. As such, we see PIERER Mobility as relatively well positioned in the industry as we believe it can leverage on its brands, its global dealer network, its reputation and track record of quality products and its focus on market segments where it is recognised as the global leader (off-road).
In December 2019 PIERER Mobility announced the takeover of the remaining 60% of the shares of PEXCO (it owned a 40% stake previously) for €22m. PEXCO was founded by the Puello family in July 2017 and focuses on manufacturing bikes and e-bikes. It operates through the two brands, R RAYMON and HUSQVARNA Bicycles. The two brands offer several models, from urban to high-performance e-mountain bikes, although the main focus is on high-performance e-bikes. The retail prices range between c €600 for a city bike to c €11,000 for the most advanced e-mountain bike. PIERER Mobility targets very strong growth with c €100m sales in FY20, up from €29m in FY18 (when it sold more than 30,000 units).
While most components of the e-bikes are purchased from external sources (including Shimano and Yamaha drive units and Yamaha and Simplo batteries), we expect the company will internalise more components over the next few years. We see this strategy positively as it should drive a reduction in bottlenecks (in a period of booming demand) and shipping times, an improvement in profitability for PIERER Mobility and an opportunity to leverage the technical know-how of the company and further differentiate the product from the competition.
We have modelled the growth potential assuming strong top-line growth (2019–22 CAGR +24%), driven by rising volumes. However, our revenue estimate for FY23 is around half of the expectation indicated by management and thus we feel our overall assessment is conservative. At a time when most e-mobility players are loss making, we expect PEXCO to break even in FY20 and contribute positively to group EBIT from FY21. We assume EBIT margins gradually converge to average group levels in the medium term (2025).
Exhibit 8: Key financial estimates for PEXCO
PEXCO |
2018 |
2019 |
2020 |
2021 |
2022 |
2023 |
2024 |
2025 |
Revenues (€m) |
29 |
70 |
100 |
120 |
134 |
151 |
169 |
189 |
Average price (€) |
935 |
1,400 |
1,400 |
1,400 |
1,400 |
1,400 |
1,400 |
1400 |
Volumes |
31,000 |
50,000 |
71,429 |
85,714 |
96,000 |
107,520 |
120,422 |
134,873 |
Gross margin (€m) |
2.9 |
10.5 |
15 |
22 |
27 |
38 |
51 |
57 |
Gross margin % |
10% |
15% |
15% |
18% |
20% |
25% |
30% |
30% |
EBITDA (€m) |
1 |
2 |
4 |
11 |
13 |
17 |
20 |
25 |
EBITDA margin |
5% |
3% |
4% |
9% |
10% |
11% |
12% |
13% |
D&A (€m) |
1 |
4 |
5 |
6 |
7 |
8 |
8 |
9 |
EBIT (€m) |
- |
-2 |
0 |
5 |
7 |
9 |
12 |
15 |
EBIT margin |
2% |
-3% |
0% |
4% |
5% |
6% |
7% |
8% |
Source: Edison Investment Research
Now is the time to get into electric motorcycles
Compared to e-bikes, the e-scooter/motorcycle market is at an earlier stage of development. According to the EIA, China is by the far the largest electric motorcycle market, with the large majority of the electric two/three wheelers in the world (300 million on the road) estimated to be in China. In China electric two-wheeler sales were 27 million in 2017 according to China Investment Corporation (CIC), ‘hundreds of times larger than any other market in the world’, the EIA said. Compared to China, the other markets are small and the growth potential is very large in our view. Indeed, in Europe there were fewer than 50,000 electric moped/motorcycle registrations in 2018 (source: European Association of Motorcycle Manufacturers (ACEM)); in India electric motorcycles accounted for only 0.2% of total 2017 motorcycles sales (source: CIC); we estimate fewer than 10,000 registrations in the US.
The e-motorcycle market in its early stage of development has significantly fewer units sold than e-bikes (European e-bike volumes were >65x e-motorcycle volumes in 2018). However, although electric two-wheeler sales are low in Europe, they are growing strongly (+27% CAGR for the e-scooter and e-motorcycle market over 2011–18) and already represent a bigger portion of registrations than electric cars (c 4% vs c 2%).
|
Exhibit 9: Sales penetration of e-bikes in Europe is higher than e-scooters and e-cars (2018) |
|
|
Source: Edison Investment Research, ACEM |
|
Exhibit 10: EU sales of electric motorcycles and mopeds |
Exhibit 11: EU e-motorcycle/moped registrations by country |
|
|
|
Source: ACEM, Edison Investment Research |
Source: ACEM |
|
Exhibit 10: EU sales of electric motorcycles and mopeds |
|
|
Source: ACEM, Edison Investment Research |
|
Exhibit 11: EU e-motorcycle/moped registrations by country |
|
|
Source: ACEM |
Significant growth potential as urban e-mobility requires radical transformation
In our view, the largest growth potential for electric motorcycles is driven by the need to modernise and convert the ageing fleet of combustion-engine vehicles to electric. In addition, the transition to urban e-mobility may attract new customers to the two-wheeler market, such as car users looking for more sustainable solutions as well as a higher number of female customers, who historically represented a much smaller percentage of motorcycle users. Based on our assessment of the growth potential, the review of the various growth forecasts and the historical trends, we believe it is realistic to assume global electric motorcycles fleet will expand at least at c 5% per year until 2030. In the immature markets of Europe and North America volumes are likely to expand at double-digit rates. In India, volume growth rates could be significantly stronger due to the current low sales and depending on the upcoming regulatory targets. Below we provide a list of growth forecasts for the various regions relevant for PIERER Mobility from publicly available sources.
As new products are launched and the market develops, it is also increasingly clear that in many cases the e-bike and e-scooter markets are serving the same type of clients. The boundaries between the two industries, which are already blurred, are likely to come down in the not-so-distant future.
Exhibit 12: E-motorcycle sales growth outlook
Geography |
Sales/volumes |
CAGR |
Period |
Source |
China |
Volumes |
5% |
2017–22 |
CIC / NIU |
India |
Sales |
57% |
2017–22 |
CIC / NIU |
South-East Asia |
Sales |
33% |
2017–22 |
CIC / NIU |
Europe |
Sales |
15% |
2017–22 |
CIC / NIU |
North America and Europe - urban lightweight |
Volumes |
10-20% |
2017–20 |
Harley Davidson |
North America and Europe - mid and high power |
Volumes |
50% |
2017–20 |
Harley Davidson |
Global |
Sales |
6% |
2019–30 |
Navigant Research |
Global |
Sales |
5% |
2018–24 |
Global Market Insights |
Source: CIC, Harley Davidson, Navigant Research, Global Market Insights
Competitive landscape: The challenge is not volume growth but profitable growth
With the exclusion of China, the electric scooter/motorcycle market is a niche industry and new entrant manufacturers play a significant role. However, although many new start-ups have accessed the market, most have not yet proved their ability to generate adequate returns and several have not yet reached breakeven. NIU, the largest listed player, did not achieve breakeven in 2018 (negative 3.3% net profit margin) despite strong revenue growth and considerable volumes (340k units sold in 2018), although breakeven is likely to have been achieved in 2019. In Europe the Italian electric two-wheeler manufacturers Askoll EVA and Energica Motorcycles (listed companies offering urban lightweight e-scooters and high-performance e-motorcycles) also did not reach breakeven in 2019.
We believe traditional players such as PIERER will find it easier to achieve economies of scale as they can integrate new e-mobility products with existing operations. Their size combined with existing distribution channels, established brands and the fact that they access the market when it is more mature is likely to help their profitability. Finally, as the market develops, larger players enter the market and technological solutions converge, we expect consolidation in the sector. PIERER Mobility has the ambition to play a key role in this process.
The opportunity for PIERER: Accessing a new market segment
We believe PIERER Mobility is well positioned for developing a new e-mobility business without cannibalising its existing products. This is because PIERER plans to focus mostly on a new market segment, urban e-mobility solutions – this is the segment we expect to be affected the most by the transition to e-mobility in the coming years. We do not expect a swift transition for PIERER’s existing core off-road offering as we believe it will take time to convince the majority of current customers that the quality of the experience (less noise, etc) is comparable to internal combustion engine vehicles. Within the urban-mobility market, we expect competition among manufacturers to be very intense in the low-end segment of the market, which includes large volume orders such as corporate fleets, sharing networks, etc. We expect PIERER to leverage its brands focusing instead on premium higher-margin market segments, consistent with its business model for internal combustion engine units and to focus on the 3–10kW power range. For modelling purposes we have assumed an average price of €5,000 per unit, which looks rather conservative based on the market pricing. The manufacturing will be concentrated in India, hence providing competitive pricing conditions and limiting investments by PIERER Mobility, in accordance with the strategic cooperation agreement with Bajaj Auto that starts in 2022.
We have forecast what we believe is a reasonable scenario of growth for PIERER Mobility in this market. We show in Exhibit 13 the potential revenue and profit uplift for PIERER Mobility from the entry into the e-motorcycle market. The visibility is low and our forecasts are subject to very high risks, considering the regulatory uncertainty, the fact that the bulk of the PIERER Mobility e-mobility products have not yet been launched and that industry data are scarce. Our forecasts are based on the following key assumptions:
■
European e-scooter and e-motorcycles market expands at 15% CAGR until 2030;
■
the European share of sales for PIERER remains constant at 52%;
■
PIERER Mobility achieves a market share of 10% in Europe, roughly in line with its current market share in its core business; and
■
EBIT and EBITDA margins to converge to average group levels starting from 2025 (we expect margins to be lower in the previous years).
Exhibit 13: E-motorcycle growth potential for PIERER Mobility
Industry volumes - e-scooters and e-motorcycles |
2018 |
2025 |
2030 |
Europe |
47,179 |
125,497 |
252,419 |
CAGR (2018–25, 2018–30) |
15% |
15% |
|
PIERER Mobility - e-scooters & e-motorcycles volumes |
2018 |
2025 |
2030 |
Europe |
0 |
12,550 |
25,242 |
PIERER Mobility - e-scooters & e-motorcycles market share |
2018 |
2025 |
2030 |
Europe |
0% |
10% |
10% |
Assumed price, € |
5,000 |
5,000 |
5,000 |
PIERER Mobility - P&L impact |
2018 |
2025 |
2030 |
European revenues, €m |
0 |
63 |
126 |
ROW revenues, €m |
0 |
87 |
174 |
Total Revenues |
0 |
149 |
300 |
EBITDA margin |
17.9% |
17.9% |
|
EBITDA |
27 |
54 |
|
% uplift vs. 2019 EBITDA |
10% |
20% |
|
EBIT margin |
9.1% |
9.1% |
|
EBIT |
14 |
27 |
|
% uplift vs. 2019 EBIT |
10% |
20% |
|
Tax rate |
24% |
24% |
|
Net income |
10 |
21 |
|
% uplift vs. 2019 net income |
22% |
40% |
Source: Edison Investment Research
As set out in the exhibit above, we believe the e-mobility opportunity could be a very large driver of the group’s earnings growth, with this segment potentially generating c 50% of the current net income of the group. As a sensitivity, in the following table we show the variation to EBIT uplift, if we adjust one of our key assumptions (market share), by using 5% and 15% instead of 10%.
Exhibit 14: E-motorcycle potential impact on EBIT (vs 2019 group EBIT)
2025 |
2030 |
|
EBIT uplift – 5% market share |
5% |
10% |
EBIT uplift – 10% market share |
10% |
20% |
EBIT uplift – 15% market share |
15% |
31% |
Source: Edison Investment Research
Management
The growth of the PIERER Mobility group is the outcome of the entrepreneurial career of DI Stefan Pierer. He founded the group in 1987 and is CEO, majority shareholder and member of the executive board. He has been a shareholder and member of the management board of KTM since 1992. He graduated from the Montan-University in Leoben, Austria, with a degree in business and energy management.
Mag. Friedrich Roithner, was appointed CFO in 2010 and has been part of the management team since 2007. After graduating in business administration from the Johannes Kepler University of Linz, he started his career as an auditing assistant at one of the big four leading tax consultancy and auditing companies in Austria. In 1992 he joined Austria Metall and was a member of the management board from 2002 until 2006.
Josef Blazicek has been chairman of the supervisory board since 2008. He is an entrepreneur and held several sales, trading and investment banking managerial positions at GIRO Credit Bank der Österreichischen Sparkassen, Erste Bank, Investmentbank Austria and ICE Securities. He was managing shareholder at Ocean Equities until 2003 and has been working for QINO Group and Ocean Consulting in various leading positions since 2000.
The remuneration of the management team is composed of a fixed and a variable component; the variable part is linked to EBIT, PBT and free cash flow generation of the companies of the group.
Sensitivities
We believe the key upside and downside risks to our forecasts and valuation are:
■
Stronger or weaker volumes and sales as a result of the economic cycle or weaker or stronger intensity of the competition. Economic cycles have historically been significant drivers of motorcycle sales. Current issues such as the coronavirus health crisis are indicative of unexpected events that can influence global economic performance. Our forecasts assume the company achieves management targets for sales in 2022. We forecast 9% revenue CAGR 2019–22, which translates into 18% EBIT CAGR over the same period. We estimate 1% higher or lower revenues would increase or decrease group EBIT by almost 3%.
■
Higher or lower profit margins as a result of a different business mix, cost control and intensity of the competition. We assume the EBIT margin recovers to c 9% in FY22 following a dip in FY20. If we assume no recovery, our 9% EBIT CAGR 2019–22 would fall to 1%.
■
FX: stronger or weaker currencies versus the euro may have a significant impact on the group’s business. In FY18, 44% of sales were from outside Europe, with US the largest export market (25% of FY18 sales).
■
Regulation, as well as the improvements in battery capacity, is a key driver of the transition to electric vehicles. In India, a key market for PIERER Mobility, a proposal to introduce a target to achieve 100% electric sales for the two-wheeler market by 2025 has been discussed (but not yet approved), which would create a very large growth opportunity for the group, in our view. Similarly, in other countries environmental regulations are likely to affect the pace of the transition to electric as well as the efforts required to reduce emissions from traditional vehicles (eg Euro 5 compliance will be mandatory in the EU from 1 January 2021).
■
Corporate governance: as Pierer Industrie owns 60% of the shares of PIERER Mobility, investors are exposed to the usual risks of a minority shareholding, due to their limited voting rights. The parent company is also owned and run by the CEO, along with several other common management team members, so there may be potential issues surrounding shareholder protection and governance.
Financials: Building on its track record of growth
Overview of 2019 preliminary results
PIERER Mobility has developed a strong track record of growth of c 13% revenue CAGR and c 18% EBIT CAGR in 2011–19.
Exhibit 20: PIERER Mobility 2019 preliminary results key metrics
Year to December (€m) |
2018 |
2019 |
% change |
Revenues |
1,462.2 |
1,520.1 |
4.0% |
|
EBITDA |
211.0 |
240.8 |
14.1% |
EBITDA margin |
14.4% |
15.8% |
|
EBIT |
128.7 |
131.7 |
2.3% |
EBIT margin |
8.8% |
8.7% |
|
Net income |
41.1 |
54.5 |
32.6% |
EPS (€) |
1.82 |
2.42 |
|
Net debt |
323.3 |
395.8 |
22.4% |
Net debt/EBITDA (x) |
1.5 |
1.6 |
|
Free cash flow |
-16.7 |
92.1 |
Source: Company reports
Revenues in 2019 were another record, growing 4% to €1.52bn. The slower rate of growth reflected the outperformance of subdued motorcycle markets with the exception of Europe where PIERER modestly underperformed the stronger market.
EBITDA also grew by an impressive 14% to €240.8m (FY18 €211.0m) although this benefited from a one-off IFRS adjustment of €10.4m related to the PEXCO buy-out. The same benefit was seen in the EBIT increase of 2.3% to €131.7m. Excluding the consolidation effect, underlying EBIT was €121.3m, down €7.4m or 5.7% below the prior year, representing an underlying EBIT margin of 8.0%.
Net income grew by 32.6% benefiting from lower interest, tax and minorities. EPS increased by a similar amount to €2.42 (FY18 €1.82). Stripping out the consolidation effect would reduce EPS growth to 7.3% at €1.96.
FCF was much improved at an inflow of €92.1m (FY18 outflow €16.7m) mainly due to a significantly improved working capital movement as well as lower cash tax payments. Investment in PPE, R&D and tooling reduced to €164.5m from €183.6m, exceeding deprecation and amortisation by €55m. Net debt increased to €395.8m (FY18 €323.3m), largely due to the application of IFRS 16, which capitalised c €39m of lease exposures, and the additions of PEXCO and the Australian motorbike distributor, which added around €84m to net debt levels. Net debt/EBITDA remained a comfortable 1.6x.
Outlook
FY20 guidance
Management has issued guidance for FY20 but withdrawn the medium-term outlook for the time being. PEXCO will be fully consolidated in FY20, adding around €100m of sales and achieving an expected break-even EBIT performance as it fully integrates its brands, including HUSQVARNA e-bikes. In addition, GASGAS brand revenues should begin and these two factors should account for the bulk of the guided top-line growth of 8–10% in FY20. Although the Chinese joint venture starts production in H220, initial volumes will be low with little contribution to the group. The core business is expected generate revenues of €1.64bn to €1.72bn.
EBIT margins are expected to fall to a 6–8% range in FY20, slightly below the normal 8–10%. There are two main reasons for the expected temporary contraction in profitability. The newly acquired businesses will require additional marketing investment and integration expenses that mean the contribution to EBIT will be low, with PEXCO only expected to break even. In addition, the introduction of Euro 5 emissions on existing models from 1 January 2020 may mean the core business has to assist its European dealership network clear existing stock, which is likely to have some impact on selling prices and wholesale volumes, although retail sales should be slightly higher. We expect a return to the more normal EBIT margin range of 8–10% from FY21.
Exhibit 21: PIERER Mobility FY20 guidance (€m)
Guidance range |
Revenue growth |
||
8% |
10% |
||
Implied revenue |
1,642 |
1,672 |
|
EBIT Margin |
Low end 6% |
98.5 |
100.3 |
Upper end 8% |
131.3 |
133.8 |
|
EBITDA Margin |
Low end 14% |
229.8 |
234.1 |
Upper end 16% |
262.7 |
267.5 |
|
Capex |
~160 |
||
Other guidance |
Min |
Max |
|
FCF |
45 |
55 |
|
Net debt/EBITDA (x) |
1.6 |
1.8 |
|
Gearing (%) |
55 |
65 |
|
Dividend |
Stable and conservative |
||
Source: PIERER Mobility and Edison Investment Research calculations
The implied ranges for EBITDA and EBIT are thus €230–268m and €99–134m respectively. Our FY20 estimates are €245m for EBITDA and €115m for EBIT.
Despite predicting a lower FCF in FY20 than guidance of €37m, we forecast net debt to decline modestly in the current year to €378m, a net debt/EBITDA ratio of 1.6x.
Longer-term prospects
We expect growing volumes in developed markets (launch of new HUSQVARNA models, GASGAS re-launch), expansion in emerging markets and development of the e-bikes business to drive further growth and we forecast a sales CAGR of 9% FY19–22e. A key driver of the growth in the period is the increase in production volumes in India (according to the Bajaj Auto cooperation agreement) where the company expects volumes to grow to over 200,000 units by 2022 (vs 110,500 in 2019), which includes the transfer of production of HUSQVARNA model line 401 to Chakan in India in Q419.
Following the anticipated dip in FY19, we expect an EBIT margin of 8–10% generating 17% three-year EBIT CAGR. The stable margins are supported by several factors. Production in India generates a lower margin as a percentage of the product price (c 4-5% licence fee (effectively 100% gross margin) for the units produced and distributed by Bajaj vs 30% gross margin for the units produced in India and distributed by PIERER), but the licence fee is fully included in the revenues; hence the EBIT margin is close to 100%. In addition, we expect the revenue growth associated with the expansion of the HUSQVARNA production to drive economies of scale: GASGAS and PEXCO should improve margins from FY20. As set out in Exhibit 23, we expect improving returns on capital.
|
Exhibit 22: EBIT margin evolution |
Exhibit 23: ROCE evolution |
|
|
|
Source: Company data, Edison Investment Research |
|
Exhibit 22: EBIT margin evolution |
|
|
Source: Company data, Edison Investment Research |
|
Exhibit 23: ROCE evolution |
|
|
Source: Company data, Edison Investment Research |
In terms of comparative performance it can be seen from Exhibit 24 that many PTW peers make healthy returns, with PIERER Mobility’s FY21 EBIT margin just within its normal target range of 8–10%, the midpoint of which appears to be aligned with the average of the peer group shown.
|
Exhibit 24: FY1 EBIT margin for PIERER Mobility and peers |
|
|
Source: Refinitiv, Edison Investment Research |
Cash flow generation on the rise
After significant investment in new capacity and infrastructure in previous years, PIERER expects company defined free cash flow/sales to improve to 3–5% pa (we forecast 2/3/5% in FY20/21/22). In 2019 a decrease in the rather high level of inventory allowed for a significant improvement in the cash flow generation.
Exhibit 25: Free cash flow generation pre and post growth capex
Free cash flow generation (€m) |
|
2018 |
2019e |
2020e |
2021e |
2022e |
|
Operating cash flow |
|
|
85.5 |
257.9 |
196.6 |
236.0 |
257.0 |
|
• Maintenance capex |
|
|
(73.1) |
(76.0) |
(72.9) |
(72.2) |
(72.2) |
|
• Dividend to minorities |
|
|
(11.8) |
(13.4) |
(11.9) |
(15.3) |
(18.6) |
Free cash flow (before growth capex) |
|
|
0.5 |
168.5 |
111.7 |
148.5 |
166.1 |
Market cap |
|
|
1037 |
1037 |
1037 |
1037 |
1037 |
FCF yield (before growth capex) |
|
|
0% |
16% |
11% |
14% |
16% |
Growth capex |
|
|
(93.9) |
(88.5) |
(87.1) |
(87.8) |
(87.8) |
Other Investment |
(5.6) |
(1.2) |
|
|
|
||
Free cash flow (after all capex and dividend to minorities) |
|
|
(98.9) |
78.8 |
24.7 |
60.7 |
78.3 |
FCF yield (after all capex and dividend to minorities) |
|
|
-10% |
8% |
2% |
6% |
8% |
FCF to sales |
|
|
-7% |
5% |
1% |
3% |
4% |
Source: Edison Investment Research
We assume capex of c €160m per year on average in the period FY20–FY22 (company guidance €150–160m) and relatively stable working capital variation of c €5m per year. The company does not provide a split between maintenance and growth capex, but we assume growth capex is around 5–6% to support development meaning a slight reduction in absolute maintenance capex levels. We estimate a double-digit and growing FCF yield, pre-growth capex. We expect positive and growing total free cash flow after growth capex.
Robust balance sheet
We calculate 1.3x FY21 net debt/EBITDA for PIERER Mobility, which is broadly consistent with the average for the peer group (c 1.5x). We believe such a level of gearing combined with the expected cash flow generation leaves room for small acquisitions over the next few years (such as the recent acquisitions of GASGAS and the majority stake in PEXCO) although larger acquisitions (which we would not rule out, based on the company’s aspiration to participate in the consolidation of the sector) would require new equity, in our view.
Exhibit 26: Financial summary
Accounts: IFRS; Year end 31 December (€m) |
|
|
2017 |
2018 |
2019 |
2020e |
2021e |
2022e |
Income statement |
|
|
|
|
|
|
|
|
Total revenues |
|
|
1,354 |
1,462 |
1,520 |
1,658 |
1,757 |
1,929 |
Cost of sales |
|
|
(945) |
(1,029) |
(1,066) |
(1,180) |
(1,251) |
(1,374) |
Gross profit |
|
|
409 |
433 |
454 |
478 |
506 |
554 |
SG&A (expenses) |
|
|
(128) |
(166) |
(150) |
(167) |
(157) |
(167) |
R&D costs |
|
|
(34) |
(27) |
(33) |
(35) |
(36) |
(38) |
Other income/(expense) |
|
|
(28) |
(29) |
(30) |
(31) |
(33) |
(34) |
Depreciation and amortisation |
|
|
(97) |
(82) |
(109) |
(129) |
(137) |
(147) |
Reported EBIT |
|
|
122 |
129 |
132 |
115 |
142 |
169 |
Finance income/(expense) |
|
|
(11) |
(15) |
(13) |
(15) |
(14) |
(12) |
Other income/(expense) |
|
|
(2) |
(1) |
(1) |
(1) |
0 |
0 |
Reported PBT |
|
|
109 |
112 |
118 |
100 |
128 |
157 |
Income tax expense |
|
|
(30) |
(27) |
(22) |
(24) |
(31) |
(38) |
Minorities |
|
|
(39) |
(44) |
(41) |
(36) |
(47) |
(57) |
Reported net income (post-minorities) |
|
|
40 |
41 |
54 |
40 |
51 |
62 |
Basic average number of shares, m |
|
|
225 |
23 |
23 |
23 |
23 |
23 |
Basic EPS (€) |
|
|
1.98 |
2.99 |
2.42 |
1.75 |
2.25 |
2.74 |
Dividend per share (€) |
|
|
0.30 |
0.30 |
0.30 |
0.30 |
0.30 |
0.35 |
Adjusted EBITDA |
|
|
219 |
211 |
241 |
245 |
279 |
316 |
Adjusted EBIT |
|
|
122 |
129 |
132 |
115 |
142 |
169 |
Adjusted PBT |
|
|
109 |
112 |
118 |
100 |
128 |
157 |
Adjusted EPS (€) |
|
|
1.77 |
1.82 |
2.42 |
1.75 |
2.25 |
2.74 |
Adjusted diluted EPS (€) |
|
|
1.77 |
1.82 |
2.42 |
1.75 |
2.25 |
2.74 |
|
|
|
|
|
|
|
|
|
Balance sheet |
|
|
|
|
|
|
|
|
Property, plant and equipment |
|
|
357 |
283 |
380 |
411 |
433 |
447 |
Goodwill |
|
|
117 |
96 |
146 |
146 |
146 |
146 |
Intangible assets |
|
|
280 |
327 |
345 |
345 |
345 |
345 |
Other non-current assets |
|
|
28 |
39 |
17 |
17 |
17 |
17 |
Total non-current assets |
|
|
782 |
745 |
888 |
919 |
941 |
955 |
Cash and equivalents |
|
|
169 |
89 |
161 |
159 |
193 |
244 |
Inventories |
|
|
297 |
287 |
324 |
341 |
343 |
358 |
Trade and other receivables |
|
|
216 |
220 |
235 |
249 |
259 |
277 |
Other current assets |
|
|
1 |
13 |
8 |
8 |
8 |
8 |
Total current assets |
|
|
683 |
609 |
728 |
757 |
803 |
887 |
Non-current loans and borrowings |
|
|
373 |
339 |
477 |
457 |
437 |
417 |
Other non-current liabilities |
|
|
89 |
95 |
110 |
110 |
110 |
110 |
Total non-current liabilities |
|
|
461 |
435 |
587 |
567 |
547 |
527 |
Trade and other payables |
|
|
178 |
191 |
205 |
227 |
240 |
264 |
Current loans and borrowings |
|
|
171 |
73 |
80 |
80 |
80 |
80 |
Other current liabilities |
|
|
125 |
104 |
116 |
116 |
116 |
116 |
Total current liabilities |
|
|
475 |
368 |
401 |
423 |
436 |
460 |
Equity attributable to company |
|
|
318 |
297 |
334 |
355 |
383 |
420 |
Non-controlling interest |
|
|
211 |
253 |
295 |
331 |
378 |
435 |
|
|
|
|
|
|
|
|
|
Cash flow statement |
|
|
|
|
|
|
|
|
Profit for the year |
|
|
84 |
114 |
96 |
76 |
97 |
119 |
Taxation expenses |
|
|
33 |
29 |
22 |
24 |
31 |
38 |
Net finance expenses |
|
|
4 |
(16) |
(16) |
16 |
14 |
12 |
Depreciation and amortisation |
|
|
86 |
91 |
109 |
129 |
137 |
147 |
Movements in working capital |
|
|
(23) |
(83) |
70 |
(9) |
1 |
(9) |
Interest paid / received |
|
|
(13) |
(15) |
(12) |
(16) |
(14) |
(12) |
Income taxes paid |
|
|
(10) |
(36) |
(10) |
(24) |
(31) |
(38) |
Cash from operations (CFO) |
|
|
161 |
85 |
258 |
197 |
236 |
257 |
Capex |
|
|
(182) |
(167) |
(165) |
(160) |
(160) |
(160) |
Acquisitions & disposals net |
|
|
28 |
70 |
0 |
0 |
0 |
0 |
Other investing activities |
|
|
0 |
(6) |
(1) |
0 |
0 |
0 |
Cash used in investing activities (CFIA) |
|
|
(154) |
(102) |
(166) |
(160) |
(160) |
(160) |
Movements in debt |
|
|
(96) |
(38) |
0 |
(20) |
(20) |
(20) |
Dividends paid |
|
|
(20) |
(19) |
(20) |
(19) |
(22) |
(25) |
Other financing activities |
|
|
(2) |
(6) |
(1) |
0 |
0 |
0 |
Cash from financing activities (CFF) |
|
|
(118) |
(63) |
(21) |
(39) |
(42) |
(45) |
Currency translation differences and other |
|
|
(4) |
0 |
0 |
0 |
0 |
0 |
Increase/(decrease) in cash and equivalents |
|
|
(115) |
(80) |
72 |
(2) |
34 |
52 |
Cash and equivalents at end of period |
|
|
169 |
89 |
161 |
159 |
193 |
244 |
Net (debt)/cash |
|
|
(375) |
(323) |
(396) |
(378) |
(324) |
(252) |
Movement in net (debt)/cash over period |
|
|
(375) |
52 |
(73) |
18 |
54 |
72 |
Source: Company data, Edison Investment Research. Note: Figures for 2017 and 2018 are continuing operations with the exception of the cash flow statement. *FY19 represents preliminary figures.
|
|||||||||||||||||||||||||||||||
|
|
Research: Industrials
Broader exposure to more defensive sectors, European projects and Indian development has stood Severfield in good stead to attain its FY20 PBT target. The UK general election result may also see some return of confidence in the weaker sentiment sectors. The company is positioned for the next phase in its strategic development, although continues to be perceived as a cyclical UK construction company in our view.