Last close As at 05/08/2026
GBP3.17
▲ 1.50 (0.48%)
Market capitalisation
GBP2,914m
Research: Investment Companies
Templeton Emerging Markets Investment Trust (TEMIT) aims to generate long-term capital growth from a portfolio of emerging market equities that is diversified by geography and sector. Carlos Hardenberg took over as lead manager on 1 October 2015, since when there has been a noticeable improvement in performance. TEMIT has outperformed its MSCI Emerging Markets Index benchmark by c 11pp over the last 12 months and has the best performance versus its peers by a considerable margin. Due to its substantial revenue reserves, the trust was able to maintain its FY17 annual dividend at 8.25p per share and a change in expense allocation will boost revenue returns from FY18; its current yield is 1.1%.
Templeton Emerging Markets Inv. Trust |
New manager oversees improved performance |
Investment trusts |
8 November 2017 |
Share price/discount performance
Three-year performance vs index
Gearing
Analysts
Templeton Emerging Markets Investment Trust is a research client of Edison Investment Research Limited |
|||||||||||||||||||||||||||||||||||||||||||||||||||||||||||||||||||||||||||||||||||||||||||||
Templeton Emerging Markets Investment Trust (TEMIT) aims to generate long-term capital growth from a portfolio of emerging market equities that is diversified by geography and sector. Carlos Hardenberg took over as lead manager on 1 October 2015, since when there has been a noticeable improvement in performance. TEMIT has outperformed its MSCI Emerging Markets Index benchmark by c 11pp over the last 12 months and has the best performance versus its peers by a considerable margin. Due to its substantial revenue reserves, the trust was able to maintain its FY17 annual dividend at 8.25p per share and a change in expense allocation will boost revenue returns from FY18; its current yield is 1.1%.
12 months ending |
Share price |
NAV |
MSCI Emerging Markets (%) |
MSCI World |
FTSE All-Share (%) |
31/10/13 |
5.1 |
6.2 |
7.2 |
26.8 |
22.8 |
31/10/14 |
0.4 |
(1.3) |
1.4 |
9.7 |
1.0 |
31/10/15 |
(25.2) |
(22.7) |
(11.1) |
6.0 |
3.0 |
31/10/16 |
46.6 |
49.8 |
38.7 |
28.8 |
12.2 |
31/10/17 |
27.5 |
24.9 |
16.7 |
13.5 |
13.4 |
Source: Thomson Datastream. Note: All % on a total return basis in pounds sterling.
Investment strategy: A rigorous five-step approach
Hardenberg is able to draw on Templeton’s well-resourced global emerging market team to select a portfolio that is diversified both by geography and sector. The five-step process involves: valuation-based stock screening; in-depth fundamental analysis; team peer review; portfolio allocation; and portfolio evaluation and attribution analysis. An assessment of a company’s corporate governance track record is an important consideration before the manager makes an investment. While TEMIT historically ran a small cash balance, in January 2017 it entered into a new £150m credit facility; if fully drawn down, it would take gross gearing to c 6.0% of net assets, compared with 2.0% at end-September 2017.
Market outlook: Higher growth and lower valuation
The outlook for emerging market economic growth remains higher than for developed economies due to factors including the rising importance of the technology sector, increasing consumer demand, relatively low levels of debt and a better commodity price environment. The valuation of emerging market equities is also relatively attractive across a range of metrics. Investors looking to gain exposure to emerging markets may be attracted to a diversified fund that is actively managed and has a strong recent track record.
Valuation: Discount has moderately narrowed
TEMIT’s board actively addresses the discount via regular share repurchases. The trust’s current 12.4% share price discount to cum-income NAV is narrower than the 13.2% average of the last 12 months and has been narrowing since mid-July 2017. The current discount compares with the 9.4% to 12.6% range of averages of the last three, five and 10 years. While TEMIT aims to generate capital growth, it pays regular annual dividends, which have been maintained at 8.25p for the last three years; the current dividend yield is 1.1%. A change in expense allocation will boost revenue income and the prospective dividend payment from FY18.
Exhibit 1: Trust at a glance
Investment objective and fund background |
Recent developments |
|||||||||||||||||||||||||||||||||||||||||||||||||||||||||||||||||||
Launched in June 1989, Templeton Emerging Markets Investment Trust (TEMIT) was one of the first emerging markets funds in the UK. The trust seeks long-term capital appreciation through investment in companies operating in emerging markets, or listed on the stock markets of such countries. This may include companies that have a significant amount of their revenues in emerging markets, but which are listed on stock exchanges in developed countries. Performance is benchmarked against the MSCI Emerging Markets Index. |
■ 13 July 2017: Retirement of directors Christopher Brady and Peter Harrison at AGM. ■ 7 June 2017: 12-month report ending 31 March 2017. NAV TR +47.8% versus benchmark TR +35.2%. Share price TR +48.3%. ■ 7 June 2017: 8.25p annual dividend for FY17 declared, in line with FY16. ■ 31 January 2017: Announcement of £150m three-year, unsecured multicurrency revolving loan facility with the Bank of Nova Scotia. |
|||||||||||||||||||||||||||||||||||||||||||||||||||||||||||||||||||
Forthcoming |
Capital structure |
Fund details |
||||||||||||||||||||||||||||||||||||||||||||||||||||||||||||||||||
AGM |
July 2018 |
Ongoing charges |
1.20% |
Group |
Templeton Asset Management |
|||||||||||||||||||||||||||||||||||||||||||||||||||||||||||||||
Interim results |
November 2017 |
Net gearing |
1.0% |
Manager |
Carlos Hardenberg |
|||||||||||||||||||||||||||||||||||||||||||||||||||||||||||||||
Year end |
31 March |
Annual mgmt fee |
0.85-1.0% of net assets (see page 7) |
Address |
5 Morrison Street, Edinburgh, |
|||||||||||||||||||||||||||||||||||||||||||||||||||||||||||||||
Dividend paid |
July |
Performance fee |
None |
|||||||||||||||||||||||||||||||||||||||||||||||||||||||||||||||||
Launch date |
12 June 1989 |
Trust life |
Indefinite |
Phone |
+44 (0)871 384 2505 |
|||||||||||||||||||||||||||||||||||||||||||||||||||||||||||||||
Continuation vote |
Five yearly (last in 2014) |
Loan facilities |
£150m |
Website |
||||||||||||||||||||||||||||||||||||||||||||||||||||||||||||||||
Dividend policy and history (financial years) |
Share buyback policy and history (financial years) |
|||||||||||||||||||||||||||||||||||||||||||||||||||||||||||||||||||
Dividends are paid annually in July. The maintained dividend in FY16 and FY17 follows five consecutive years of dividend increases. |
TEMIT is authorised to repurchase up to 14.99% and allot up to 5% of its issued ordinary shares. |
|||||||||||||||||||||||||||||||||||||||||||||||||||||||||||||||||||
|
|
|||||||||||||||||||||||||||||||||||||||||||||||||||||||||||||||||||
Shareholder base (as at 17 October 2017) |
Portfolio exposure by geography (ex-gearing as at 31 October 2017) |
|||||||||||||||||||||||||||||||||||||||||||||||||||||||||||||||||||
|
|
|||||||||||||||||||||||||||||||||||||||||||||||||||||||||||||||||||
Top 10 holdings (as at 31 October 2017) |
||||||||||||||||||||||||||||||||||||||||||||||||||||||||||||||||||||
|
||||||||||||||||||||||||||||||||||||||||||||||||||||||||||||||||||||
Source: Templeton Emerging Markets Investment Trust, Edison Investment Research, Bloomberg, Morningstar. Note: *N/A where not in October 2016 top 10.
Market outlook: Relative valuation remains attractive
In its October 2017 World Economic Outlook, the International Monetary Fund reiterated its above-average growth estimates for emerging markets and developing economies of 4.6% and 4.9% for 2017 and 2018, respectively, versus 2.2% and 2.0% for advanced economies. Factors behind the higher growth include robust demand as a result of rising consumer incomes, relatively low levels of debt and more stable commodity prices. Against this backdrop, emerging markets remain attractively valued versus world equities (Exhibit 2, RHS). Investors seeking exposure to emerging markets may find appeal in an actively managed, diversified fund that has a meaningfully improved recent investment track record.
|
Exhibit 2: Market performance and valuation |
|
Performance of indices in £ (last 10 years) |
Valuation metrics (as at 6 November 2017) |
|
|
|
Source: Thomson Datastream, Edison Investment Research, MSCI |
|
Fund profile: Diversified portfolio of EM equities
TEMIT was launched in June 1989 and is quoted on the London and New Zealand stock exchanges. The trust is managed by Templeton, which has more than 30 years’ experience of investing in emerging markets. The Templeton Emerging Markets Group (TEMG) comprises more than 50 portfolio managers and analysts, based in 21 countries around the world. TEMIT aims to generate long-term capital growth from a diversified portfolio of companies listed in emerging markets or companies listed in developed markets that generate a significant percentage of their revenues in emerging markets. The trust primarily invests in equities, but may also invest in equity-related vehicles such as convertibles; it is benchmarked against the MSCI Emerging Markets Index. At the time of investment, a maximum 10% of assets is permitted in a single issuer. Gearing of up to 10% of net assets is also permitted; at end-September 2017, net gearing was 1.0%. (Historically, the trust has run a small cash balance.) Since 1 October 2015, TEMIT’s lead portfolio manager has been Carlos Hardenberg; he is supported by Deputy Portfolio Manager Chetan Sehgal and former lead manager Dr Mark Mobius, who is executive chairman of TEMG.
The fund manager: Carlos Hardenberg
The manager’s view: Opportunities in smaller markets
The manager comments that emerging markets have appreciated somewhat over the past one to two years on the back of a broad-based improvement in corporate earnings across most of the developing economies. He says that margins have expanded, helping to boost earnings from depressed levels. Hardenberg notes that while emerging market currencies have recovered to a certain degree, they remain undervalued versus developed currencies. He suggests that Asian economies are continuing to decouple from the rest of the world as Asian companies become more competitive – he believes that this trend is sustainable, particularly in sectors such as technology. In recent years this industry has gone through a significant period of consolidation, which has led to a more robust pricing environment, and some Asian companies have been able to establish dominant global positions, such as Samsung Electronics and Taiwan Semiconductor Manufacturing.
Hardenberg has been adding exposure to frontier markets, which he says are the next generation of fast-growing countries. As these markets mature, company business models can become more stable, while offering higher growth and exposure to underpenetrated populations. He acknowledges that investing in these countries requires an extra level of due diligence to ensure that potential investments fit within Templeton’s risk profile. Hardenberg highlights TEMIT’s Kenyan exposure: two banks (Equity Group and KCB Group) and a brewer (East African Breweries), which he reports are performing well.
The manager has been researching potential investments in Vietnam. He says that there has been an explosion in foreign direct investment and the economy is very vibrant; the country is now running a trade surplus, having historically run at a deficit. The manager is attracted by rising household income in Vietnam and says that per-capita GDP has increased tenfold in the last 15 years. However, Hardenberg highlights a number of risks, including the immaturity of the banking system, corruption and a real estate bubble, which means that he remains very cautious about making his first investment in the country.
Hardenberg sees the Philippines as an interesting smaller emerging market, which has a negligible index weighting, so its stocks are not widely held. The country has a huge and growing population and while the president has been criticised for his candid approach, reforms are being implemented and GDP growth has accelerated. The manager says that the Philippines has one of the most underdeveloped financial systems in the world, which provides considerable growth opportunities for the banks over the long term. TEMIT currently has positions in BDO Unibank and Security Bank.
Asset allocation
Investment process: A rigorous five-step investment approach
The manager seeks undervalued companies with strong fundamentals and growth potential that he can hold for the long term. He follows Templeton’s rigorous five-step investment process: valuation-based stock screening; in-depth fundamental analysis; team peer review; portfolio allocation; and portfolio evaluation and attribution analysis. When researching companies for potential inclusion in the portfolio, the manager puts significant emphasis on an assessment of its corporate governance track record. He tends to favour mid-sized companies, seeking those with strong management teams that can adapt to a rapidly changing business environment. While not an activist investor, TEMIT engages in active dialogue with investee companies. Since taking the role as lead manager, Hardenberg has broadly doubled the number of holdings to more than 90: increasing the trust’s technology, smaller-cap company and frontier markets exposures. However, he is looking to place more of an emphasis on his higher-conviction ideas and envisages that the number of positions is likely to be reduced to 70-75 over time.
Current portfolio positioning
At end-October 2017, TEMIT’s top 10 positions comprised 42.2% of the portfolio, which was a modest increase in concentration from 40.1% at end-October 2016; seven positions were common to both periods (Exhibit 1). The trust’s sector and geographic exposures are shown in Exhibits 3 and 4. Over the last 12 months, the largest increases in sector exposure were technology (+5.6pp) and financials (+5.1pp), while the greatest decreases were consumer staples (-2.5pp) and materials (-1.7pp).
Exhibit 3: Portfolio sector exposure vs benchmark (% unless stated)
Portfolio end-October 2017 |
Portfolio end-October 2016 |
Change (pp) |
Index weight |
Active weight |
Trust weight/ index weight (x) |
|
Information technology |
32.0 |
26.4 |
5.6 |
28.5 |
3.5 |
1.1 |
Financials |
22.5 |
17.4 |
5.1 |
23.0 |
(0.5) |
1.0 |
Consumer discretionary |
20.5 |
21.5 |
(1.0) |
10.2 |
10.3 |
2.0 |
Consumer staples |
7.1 |
9.6 |
(2.5) |
6.2 |
0.9 |
1.1 |
Energy |
7.1 |
7.3 |
(0.2) |
6.9 |
0.2 |
1.0 |
Materials |
5.6 |
7.3 |
(1.7) |
7.2 |
(1.6) |
0.8 |
Industrials |
2.7 |
3.8 |
(1.1) |
5.5 |
(2.8) |
0.5 |
Healthcare |
1.8 |
1.7 |
0.1 |
2.3 |
(0.5) |
0.8 |
Real estate |
0.6 |
0.6 |
0.0 |
2.8 |
(2.2) |
0.2 |
Telecommunication services |
0.5 |
0.5 |
0.0 |
4.9 |
(4.4) |
0.1 |
Utilities |
0.2 |
0.3 |
(0.1) |
2.5 |
(2.3) |
0.1 |
Other net assets |
(0.6) |
3.6 |
(4.2) |
0.0 |
(0.6) |
N/A |
100.0 |
100.0 |
100.0 |
Source: Templeton Emerging Markets Investment Trust, Edison Investment Research
Exhibit 4: Portfolio geographic exposure (% unless stated)
Portfolio end-October 2017 |
Portfolio end- October 2016 |
Change (pp) |
|
China/Hong Kong |
22.0 |
19.9 |
2.1 |
South Korea |
14.8 |
12.4 |
2.4 |
Taiwan |
10.7 |
9.5 |
1.2 |
Brazil |
9.4 |
10.2 |
(0.8) |
Russia |
7.9 |
6.1 |
1.8 |
India |
5.7 |
6.2 |
(0.5) |
South Africa |
5.7 |
4.9 |
0.8 |
Thailand |
5.0 |
5.2 |
(0.2) |
Indonesia |
4.0 |
5.2 |
(1.2) |
Other |
14.8 |
20.4 |
(5.6) |
100.0 |
100.0 |
Source: Templeton Emerging Markets Investment Trust, Edison Investment Research
Over the last 12 months, TEMIT’s Russian exposure has increased due to share price appreciation. The manager comments that due to investor concerns about sanctions, he was able to take a contrarian view, buying positions in quality companies at attractive prices. This includes Sberbank, which has a similar growth rate to Indian banks, but trades at a significant valuation discount. The manager cites Sberbank’s high-tech operations, quality workforce, low non-performing loans and ambitious multi-year cost-cutting programme, which includes reducing the branch network and outsourcing non-core operations. He says that the impact of sanctions and tighter regulation for financial service companies has benefited Sberbank as consumers have migrated towards high-quality banks.
TEMIT’s higher exposure to China/Hong Kong includes Hardenberg’s first purchase of a Chinese bank. Ping An Bank is a subsidiary of Ping An Insurance (which is also held in the portfolio). While the manager remains cautious about Chinese banks due to increased competition and high levels of corporate and consumer debt, he is confident in the outlook for Ping An Bank. He says that the company has a transparent business model, with relatively low levels of corporate lending, and a high-quality management team that communicates well with investors.
TEMIT participated in the July 2017 initial public offering (IPO) of FIT Hon Teng, which is a subsidiary of Taiwanese electronic component manufacturer Hon Hai Precision Industry (Foxconn). FIT Hon Teng is an electronic connector and cable manufacturer that is benefiting from growth in wireless charging and electric vehicles. Since the IPO to end-October 2017, its share price has nearly doubled.
Performance: Improvement under new manager
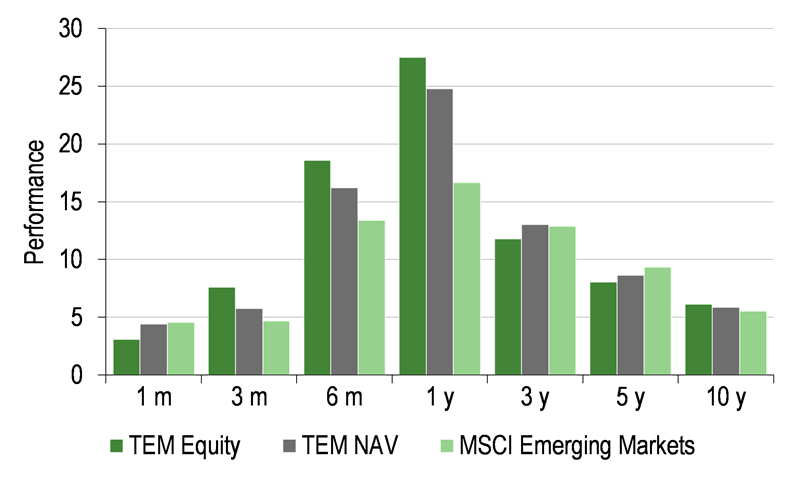
As shown in Exhibit 5 (RHS), over the last 12 months, TEMIT’s NAV and share price total returns of 24.9% and 27.5%, respectively, are considerably ahead of the benchmark’s 16.7% total return. The greatest positive contributor to TEMIT’s performance was current number two position Brilliance China Automotive, generating a total return in the 12 months to end-October 2017 of c 115%.
|
Exhibit 5: Investment trust performance to 31 October 2017 |
|
Price, NAV and benchmark total return performance, one-year rebased |
Price, NAV and benchmark total return performance (%) |
|
|
|
Source: Thomson Datastream, Edison Investment Research. Note: Three, five and 10-year performance figures annualised. |
|
TEMIT’s relative performance is shown in Exhibit 6; its NAV total return is meaningfully above the benchmark total return over the last year. It is broadly in line over three years, lags over five years and is ahead over 10 years. Over the last 12 months, TEMIT’s share price total return is higher than its NAV total return, which has led to a narrower discount.
Exhibit 6: Share price and NAV total return performance, relative to indices (%)
|
One month |
Three months |
Six months |
One year |
Three years |
Five years |
10 years |
Price relative to MSCI Emerging Markets |
(1.4) |
2.8 |
4.6 |
9.3 |
(2.8) |
(5.7) |
5.7 |
NAV relative to MSCI Emerging Markets |
(0.1) |
1.0 |
2.5 |
6.9 |
0.4 |
(3.2) |
3.2 |
Price relative to MSCI World |
0.1 |
3.8 |
10.9 |
12.3 |
(9.8) |
(31.6) |
(26.7) |
NAV relative to MSCI World |
1.4 |
2.0 |
8.7 |
9.9 |
(6.8) |
(29.8) |
(28.5) |
Price relative to FTSE All-Share |
1.2 |
4.6 |
12.0 |
12.5 |
6.7 |
(9.3) |
6.1 |
NAV relative to FTSE All-Share |
2.5 |
2.9 |
9.7 |
10.0 |
10.2 |
(6.9) |
3.5 |
Source: Thomson Datastream, Edison Investment Research. Note: Data to end-October 2017. Geometric calculation.
Exhibit 7 clearly illustrates TEMIT’s improved investment performance under the new manager. Hardenberg took on the role of lead manager on 1 October 2015; since then the trust has outperformed the benchmark by c 15pp.
|
Exhibit 7: NAV total return performance relative to benchmark over three years |
|
|
Source: Thomson Datastream, Edison Investment Research |
Discount: Narrower since mid-July 2017
TEMIT’s current 12.4% share price discount to cum-income NAV is modestly narrower than the 13.2% average of the last 12 months (range of 10.2% to 14.7%). It compares to the averages of the last three, five and 10 years of 12.6%, 11.4% and 9.4%, respectively.
As shown in Exhibit 8, TEMIT’s discount has narrowed since mid-July 2017. The board buys back shares at a discount to NAV when it considers it is in the interests of shareholders, and repurchases were made on most trading days in FY17. In aggregate 16.4m shares (5.5% of shares in issue at the end of FY16) were repurchased during the financial year at discounts between 10.9% and 14.7% and prices of 435p to 674p; the repurchases were 0.8% accretive to NAV.
As illustrated in Exhibit 1, TEMIT has continued to buy back shares actively in FY18. Historically, repurchased shares were cancelled. However, at the July 2017 AGM, a resolution was approved allowing the board discretion to allot repurchased shares from treasury. This will allow quick and low-cost reissuance of shares if TEMIT’s shares trade at a premium to NAV.
|
Exhibit 8: Share price discount to NAV (including income) over three years (%) |
|
|
Source: Thomson Datastream, Edison Investment Research |
Capital structure and fees
TEMIT is a conventional investment trust with one class of share; there are currently 276.5m shares in issue. On 31 January 2017, TEMIT announced that it had entered into a three-year, £150m, unsecured, multicurrency, revolving loan facility with The Bank of Nova Scotia, which may be drawn down in sterling, US dollars and Chinese renminbi (with a maximum £30m equivalent). If the debt facility was fully drawn down, it would take gross gearing to c 6% of net assets, which compares with a maximum permitted 10%. At end-September 2017, net gearing was 1.0%.
With effect from 1 July 2017, the annual management fee paid to Templeton is 1.0% of net assets up to £2bn and 0.85% of net assets above that level; the previous fee was 1.1% of net assets. Effective 1 April 2017, 70% of the annual management fee and 70% of borrowing costs will be allocated to the capital rather than revenue account. If this policy had been in place in FY17, revenue earnings would have been 11.72p rather than 6.59p. The 70:30 split between the capital and revenue account reflects the board’s assessment of the likely ratio between long-term capital and revenue returns. In FY17, the ongoing charges ratio was 1.20%, which was a 2bp reduction on FY16, due to the increase in average net assets, and a meaningful reduction from 1.32% 10 years ago. TEMIT is subject to a five-year continuation vote; the next vote is due in July 2019.
Dividend policy and record
In FY17, revenue earnings per share were 6.59p, 6.5% lower than in FY16. However, the annual dividend was again maintained at 8.25p, as TEMIT had substantial revenue reserves. At the end of financial year, after taking the FY17 dividend payment into account, revenue reserves were more than three times the annual dividend. TEMIT’s current dividend yield is 1.1%. There is a higher prospective dividend from FY18 due to the reallocation of expenses noted above.
Peer group comparison
Exhibit 9 shows trusts in the AIC Global Emerging Markets sector with market caps above £50m and a track record of more than one year. TEMIT is by far the largest fund and has the best performance over one year by some margin; its NAV total return is c 11pp ahead of the second ranked trust and 18pp above the average. Over longer periods, it ranks third out of 11 trusts over three years, fifth out of 10 over five years and fifth out of eight over 10 years. TEMIT’s discount is wider than average, while it has a lower ongoing charge and no performance fee is payable. The trust has lower than average gearing, and befitting its focus on capital growth, a lower than average dividend yield.
Exhibit 9: Selected peer group as at 6 November 2017*
% unless stated |
Market cap £m |
NAV TR |
NAV TR |
NAV TR |
NAV TR |
Discount (ex-par) |
Ongoing charge |
Perf. |
Net gearing |
Dividend yield (%) |
Templeton Emerging Markets IT |
2,176.1 |
33.2 |
50.0 |
52.7 |
87.5 |
(11.1) |
1.2 |
No |
101 |
1.0 |
Aberdeen Emerging Markets |
326.4 |
22.4 |
47.8 |
52.3 |
45.3 |
(11.4) |
1.1 |
Yes |
100 |
3.1 |
Aberdeen Frontier Markets IT |
54.9 |
3.1 |
5.5 |
40.8 |
42.9 |
(5.7) |
2.0 |
Yes |
100 |
2.3 |
Africa Opportunity |
53.6 |
(0.5) |
14.7 |
35.0 |
73.5 |
(22.7) |
4.5 |
Yes |
100 |
0.0 |
BlackRock Frontiers |
288.3 |
18.5 |
44.2 |
110.7 |
|
7.7 |
1.4 |
Yes |
113 |
3.3 |
Fundsmith Emerging Equities Trust |
282.1 |
6.4 |
18.6 |
|
|
(2.7) |
1.9 |
No |
100 |
0.0 |
Genesis Emerging Markets Fund |
969.7 |
18.8 |
37.7 |
45.0 |
107.5 |
(10.6) |
1.4 |
No |
100 |
1.5 |
JPMorgan Emerging Markets |
1,052.1 |
20.8 |
53.3 |
62.6 |
99.6 |
(12.0) |
1.1 |
No |
102 |
1.3 |
JPMorgan Global Emerging Markets |
394.3 |
16.5 |
34.4 |
47.1 |
|
(0.6) |
1.3 |
No |
111 |
3.7 |
Terra Capital |
59.3 |
12.6 |
56.5 |
86.1 |
95.8 |
(19.8) |
2.0 |
Yes |
100 |
0.0 |
Utilico Emerging Markets |
485.2 |
15.1 |
36.8 |
67.5 |
100.7 |
(10.2) |
0.9 |
Yes |
111 |
3.0 |
Group average (11 trusts) |
558.4 |
15.2 |
36.3 |
60.0 |
81.6 |
(9.0) |
1.7 |
103 |
1.7 |
|
TEM rank in peer group |
1 |
1 |
3 |
5 |
5 |
7 |
8 |
5 |
8 |
Source: Morningstar, Edison Investment Research. Note: *Performance data to 3 November 2017. TR=total return. Net gearing is total assets less cash and equivalents as a percentage of net assets.
The board
There are currently six directors on TEMIT’s board; five of whom are non-executive and independent of the manager. Chairman Paul Manduca was appointed in August 2015 and assumed his current role in November 2015. Hamish Buchan was appointed in June 2008, and Beatrice Hollond in April 2014. The two newest board members are Simon Jeffreys (appointed July 2016) and David Graham (appointed September 2016). Gregory Johnson was appointed in December 2007. He is chairman and CEO of TEMG’s parent Franklin Resources, so is considered to be non-independent. Peter Harrison and Christopher Brady retired at the July 2017 AGM and Hamish Buchan has announced his intention to retire at the July 2018 AGM; the board will commence the search for a new director in Q118.
|
|
We are initiating coverage on ASLAN Pharmaceuticals, a clinical-stage drug developer focusing on in-licensing drugs with a high prevalence in Asia that are orphan indications in the West. The company’s lead asset is the pan-HER inhibitor varlitinib, which is in clinical trials for biliary tract cancer (BTC, pivotal) and gastric cancer (GC, Phase II/III), both of which are widely prevalent in Asia. The company has also planned a Phase II trial of ASLAN003 targeting AML via the novel mechanism of inducing blast differentiation. We initiate at NT$9.5bn or NT$72.87 per share.