National Grid
Written by
National Grid |
Focus on growth with shareholder returns |
H1 results |
Utilities |
18 November 2015 |
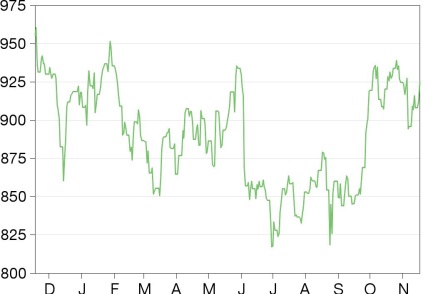
Share price performance
Business description
Next event
Analysts
National Grid is a research client of Edison Investment Research Limited |
|||||||||||||||||||||||||||||||||||||||||||||
Aside from H1 results that demonstrated strong operational execution in the UK and reiteration of US rate filing prospects, National Grid has announced the intended sale of a majority stake in its UK gas business. The prospect of shareholder returns and long-term stronger growth outlook from the deal underpins the attraction of the company’s combination of growth and yield. The deal also lifts the bottom of our valuation range. Our new valuation range is 874-1,067p per share.
Year end |
Revenue (£m) |
PBT* |
EPS* |
DPS |
P/E |
Yield |
03/14 |
15,002 |
2,584 |
54.0 |
42.0 |
17.1 |
4.5 |
03/15 |
15,201 |
2,876 |
58.1 |
42.9 |
15.9 |
4.6 |
03/16e |
15,668 |
2,970 |
59.8 |
43.7 |
15.5 |
4.7 |
03/17e |
16,318 |
3,148 |
62.7 |
44.8 |
14.8 |
4.8 |
Note: *PBT and EPS are normalised, excluding intangible amortisation, exceptional items and share-based payments.
Strong results
National Grid has reported strong H1 results with operating profit of £1,836m, PBT of £1,371m, EPS of 28.4p and DPS of 15p. Net debt stood at £24.6bn. The UK-regulated business delivered performance in line with expectations, while other activities, chiefly property and the French Interconnector, drove an 8% outperformance against consensus operating profit. We have made small adjustments to our forecasts to reflect the stronger prospects of these businesses but, given their size, the overall impact on our group earnings forecast is minimal.
Disposal of UK gas distribution
The company has announced the potential disposal of a majority stake in its UK gas distribution business. According to management, this represents a rebalancing of the group portfolio to shift it to an asset mix that delivers higher growth. We acknowledge that UK gas distribution is one of the businesses with the lowest growth rates in the company’s portfolio, with 1-2% growth. However, we also note that it is a very stable cash flow business. The sale will increase exposure to the US and possibly volatility of earnings due to timing issues. Underlying earnings should maintain stability. National Grid argues that the sale will allow it to pursue stable dividend growth for the foreseeable future, and that the bulk of the net proceeds will be returned to shareholders. That prospect, which again demonstrates the company’s commitment to the dividend and to shareholder returns, is positive.
Valuation: M&A justifies lift in the range
Our previous valuation range was 796-1,067p per share, with the low end based on a regulated asset value (RAV) based SOTP and the high end based on M&A multiples. Now that there is a defined transaction for one business on the horizon, we find it reasonable to include that at an M&A multiple. We believe the chances that National Grid can achieve a strong multiple for its UK gas distribution business are good, and therefore lift the low end of our range to 874p/share.
Results
Strong UK-regulated business performance
H1 results were above expectations: group operating profit was £1,836m (consensus £1,719m). Pre-tax profit was £1,371m (consensus £1,223m), EPS came in at 28.4p (consensus 25p). Management has reiterated guidance for the regulated activities and increased its capex guidance to £3.7bn. It expects group asset growth to be between 4% and 5%, which is a step up from the 3% achieved in 2014/15 and still a touch below the long term 5% asset growth target.
■
UK Electricity Transmission earnings were driven by stable totex performance and capital efficiencies. Management sees stable incentive performance and similar returns ahead.
■
UK Gas Transmission: overall returns were down year-on-year due to the expiry of permit income and legacy allowances. Totex spend of £150m was in line with the regulatory allowances. Totex is likely to be in line with Ofgem’s allowance for the year.
■
UK Gas Distribution benefited from higher recovery of regulatory allowances, which was partially offset by increased depreciation and opex. However, totex efficiencies were stable and the company expects outperformance similar to last year.
■
Other activities were the single most important driver of better than expected performance, accounting for £160m of operating profit outperformance vs consensus. However, not all of that will be recurring: property and the French Interconnector delivered strong y-o-y operating profit growth, which will not carry through to the same extent in H2. Property was much stronger than expected, following the disposal of large assets.
Exhibit 1: H1 operating profit
£m |
H116 |
H115 |
Consensus H116 |
Edison FY16e |
UK Electricity Transmission |
610 |
687 |
669 |
1,229 |
UK Gas Transmission |
159 |
110 |
129 |
431 |
UK Gas Distribution |
428 |
434 |
431 |
850 |
US Regulated |
351 |
273 |
368 |
1,164 |
Other activities |
288 |
107 |
122 |
259 |
Operating profit |
1,836 |
1,611 |
1,719 |
3,932 |
Source: National Grid, Edison Investment Research
US rate cases to be filed soon
In the US, capex trackers and additional revenues under current rate plans, particularly concerning Niagara Mohawk, led to higher revenues. Additionally, controllable operating costs have been reduced. However, the US operations are still expected to deliver returns of just 8%, which is below the potential ROE that the US assets could generate. The company is addressing this through additional rate case filings. It filed a full rate case for Massachusetts Electric last week, in which it is asking for US$143m of incremental revenues. Results should come through later in 2016 and new rates become effective in October 2016. Rate filings for the New York KEDLI and KEDNY businesses – c 25% of the US business – are in preparation to lift ROE. Management has reiterated that it expects the new rates to be available from early 2017. With a step-up in investment, the company is looking for c 7% rate base growth from the business.
Potential majority sale of the UK gas distribution business
National Grid has announced that it intends to sell a majority stake in its UK gas distribution business. By and large, all of the net proceeds will be returned to shareholders. The process is due to be completed in early 2017. Dividend growth seems to be one of the motivations of the disposal. We believe a special dividend is a strong possibility. In terms of strategic grounds, management rationalises the transaction in terms of portfolio rebalancing. Gas Distribution is a mature business and the disposal will lift the overall group asset growth rate towards its long-term target of 5%. Clearly, growth of the business is fairly low, at c 1-2% pa. However, it is also a stable cash flow business. There is risk that longer term dividends may become more volatile, as a stable source of covering earnings will no longer be available. US exposure will increase. There is potential for higher growth from the US, but that depends on the upcoming rate cases and opex execution. Our RAV-based valuation of the business suggests a value of £8.8bn, but market transactions can achieve higher valuations. On an M&A valuation basis, we estimate the gas distribution business to be worth c £11.8bn.
New CEO
National Grid has recently announced that its longstanding CEO Steve Holliday will retire at the end of March 2016. John Pettigrew, the current executive director of UK operations, will succeed Mr Holliday. Mr Pettigrew has held various senior roles with the company over the past 25 years and joined the board last year. He has experience with the US operations from his tenure as executive VP for the US Electricity Distribution & Generation business, which is important for the company’s target to improve US returns. This is a well-planned succession that illustrates the company’s quality of execution. We expect continuation of the company’s strategic direction and execution on operational priorities as currently defined.
Small increase to forecasts
Our forecast remains unchanged for most of the businesses as H1 performance and stable guidance confirm our views. In particular, as far as the strong UK Electricity performance is concerned, we note that there can be strong fluctuations in the year, and our 2016 forecast assumes stable totex outperformance y-o-y, in line with current management expectations. We retain our expectation for marginal totex underspend for the Gas Transmission business. Our forecast also incorporates continued good operational performance in the US, with flat operating profits y-o-y. As for other activities which largely drove the outperformance against consensus (but essentially in line with our estimate), we have updated our forecast to reflect the performance delivered in H1, especially in property. In any case, other activity operating profit accounts for less than 2% of the group total. We have further updated our expected number of shares, which also contributes to our EPS increasing for 2016e and 2017e.
Exhibit 2: Updated forecasts
£m |
2016e |
2017e |
Operating profit old |
3,932 |
4,219 |
Operating profit new |
3,967 |
4,254 |
EPS old (p) |
57.8 |
60.6 |
EPS new (p) |
59.8 |
62.7 |
Source: Edison Investment Research
Valuation: M&A justifies lift of the low end of the range
Our valuation range remains largely unchanged, at 796-1,067p/share, with our RAV-based SOTP representing the low end and an M&A-based SOTP the high end of the range. However, including the Gas Distribution business at an M&A valuation lifts the low end of the range to 854p. We believe that is reasonable, given there is now a defined transaction on the horizon for that business.
Exhibit 3: Financial summary
£'m |
2014 |
2015 |
2016e |
2017e |
2018e |
2019e |
2020e |
2021e |
||
31 March |
IFRS |
IFRS |
IFRS |
IFRS |
IFRS |
IFRS |
IFRS |
IFRS |
||
PROFIT & LOSS |
||||||||||
Revenue |
|
|
15,002 |
15,201 |
15,668 |
16,318 |
16,829 |
17,310 |
17,790 |
18,274 |
Cost of Sales |
(9,922) |
(9,856) |
(10,149) |
(10,430) |
(10,704) |
(10,974) |
(11,260) |
(11,535) |
||
Gross Profit |
5,080 |
5,345 |
5,519 |
5,888 |
6,125 |
6,336 |
6,530 |
6,739 |
||
EBITDA |
|
|
5,080 |
5,345 |
5,519 |
5,888 |
6,125 |
6,336 |
6,530 |
6,739 |
Operating Profit (before amort. and except.) |
3,664 |
3,863 |
3,967 |
4,254 |
4,408 |
4,531 |
4,639 |
4,762 |
||
Intangible Amortisation |
0 |
0 |
0 |
0 |
0 |
0 |
0 |
0 |
||
Exceptionals |
71 |
(83) |
0 |
0 |
0 |
0 |
0 |
0 |
||
Operating Profit |
3,735 |
3,780 |
3,967 |
4,254 |
4,408 |
4,531 |
4,639 |
4,762 |
||
Associated company |
28 |
46 |
47 |
48 |
49 |
51 |
52 |
53 |
||
Exceptionals |
93 |
(165) |
0 |
0 |
0 |
0 |
0 |
0 |
||
Net Interest |
(1,108) |
(1,033) |
(1,044) |
(1,154) |
(1,212) |
(1,272) |
(1,333) |
(1,388) |
||
Profit Before Tax (norm) |
|
|
2,584 |
2,876 |
2,970 |
3,148 |
3,245 |
3,310 |
3,358 |
3,427 |
Profit Before Tax (IFRS) |
|
|
2,748 |
2,628 |
2,970 |
3,148 |
3,245 |
3,310 |
3,358 |
3,427 |
Tax |
(581) |
(695) |
(713) |
(756) |
(779) |
(794) |
(806) |
(822) |
||
Profit After Tax (norm) |
2,003 |
2,181 |
2,257 |
2,393 |
2,466 |
2,515 |
2,552 |
2,604 |
||
Profit After Tax (IFRS) |
2,167 |
1,933 |
2,257 |
2,393 |
2,466 |
2,515 |
2,552 |
2,604 |
||
Average Number of Shares Outstanding (m) |
3,729.0 |
3,766.0 |
3,787.5 |
3,827.6 |
3,865.5 |
3,904.7 |
3,945.4 |
3,987.5 |
||
EPS - normalised (p) |
|
|
54.0 |
58.1 |
59.8 |
62.7 |
64.0 |
64.6 |
64.9 |
65.5 |
EPS - (IFRS) (p) |
|
|
58.4 |
51.5 |
59.8 |
62.7 |
64.0 |
64.6 |
64.9 |
65.5 |
Dividend per share (p) |
42.0 |
42.9 |
43.7 |
44.8 |
45.9 |
47.1 |
48.2 |
49.5 |
||
Gross Margin (%) |
33.9 |
35.2 |
35.2 |
36.1 |
36.4 |
36.6 |
36.7 |
36.9 |
||
EBITDA Margin (%) |
33.9 |
35.2 |
35.2 |
36.1 |
36.4 |
36.6 |
36.7 |
36.9 |
||
Operating Margin (before GW and except.) (%) |
24.4 |
25.4 |
25.3 |
26.1 |
26.2 |
26.2 |
26.1 |
26.1 |
||
BALANCE SHEET |
||||||||||
Fixed Assets |
|
|
43,164 |
47,398 |
49,428 |
51,820 |
54,273 |
56,834 |
59,304 |
61,638 |
Intangible Assets |
5,263 |
5,947 |
5,947 |
5,947 |
5,947 |
5,947 |
5,947 |
5,947 |
||
Tangible Assets |
37,266 |
40,803 |
42,866 |
45,293 |
47,781 |
50,378 |
52,886 |
55,257 |
||
Investments |
635 |
648 |
614 |
580 |
545 |
508 |
471 |
433 |
||
Current Assets |
|
|
10,027 |
7,005 |
8,042 |
8,265 |
8,440 |
8,604 |
8,769 |
8,935 |
Stocks |
268 |
340 |
550 |
573 |
591 |
608 |
625 |
642 |
||
Debtors |
2,855 |
2,836 |
2,923 |
3,044 |
3,140 |
3,229 |
3,319 |
3,409 |
||
Cash |
4,760 |
1,992 |
2,675 |
2,675 |
2,675 |
2,675 |
2,675 |
2,675 |
||
Other |
2,144 |
1,837 |
1,893 |
1,972 |
2,034 |
2,092 |
2,150 |
2,208 |
||
Current Liabilities |
|
|
(10,792) |
(11,284) |
(13,588) |
(15,334) |
(17,062) |
(18,884) |
(20,625) |
(22,227) |
Creditors |
(7,281) |
(7,773) |
(8,035) |
(8,550) |
(9,049) |
(9,549) |
(10,055) |
(10,570) |
||
Short term borrowings |
(3,511) |
(3,511) |
(5,553) |
(6,784) |
(8,013) |
(9,335) |
(10,570) |
(11,657) |
||
Long Term Liabilities |
|
|
(30,480) |
(31,145) |
(31,996) |
(32,194) |
(32,409) |
(32,643) |
(32,896) |
(33,169) |
Long term borrowings |
(22,439) |
(22,396) |
(22,529) |
(22,701) |
(22,878) |
(23,060) |
(23,246) |
(23,437) |
||
Other long term liabilities |
(8,041) |
(8,749) |
(9,468) |
(9,493) |
(9,531) |
(9,583) |
(9,650) |
(9,732) |
||
Net Assets |
|
|
11,919 |
11,974 |
11,885 |
12,557 |
13,241 |
13,911 |
14,552 |
15,176 |
CASH FLOW |
||||||||||
Operating Cash Flow |
|
|
4,419 |
5,350 |
4,716 |
5,448 |
5,704 |
5,919 |
6,114 |
6,322 |
Net Interest |
(866) |
(789) |
(911) |
(981) |
(1,035) |
(1,091) |
(1,147) |
(1,198) |
||
Tax |
(400) |
(343) |
(352) |
(373) |
(384) |
(392) |
(398) |
(406) |
||
Capex |
(3,441) |
(3,469) |
(3,616) |
(4,060) |
(4,205) |
(4,402) |
(4,399) |
(4,348) |
||
Acquisitions/disposals |
318 |
195 |
0 |
0 |
0 |
0 |
0 |
0 |
||
Financing |
1,268 |
(2,399) |
(52) |
(90) |
(92) |
(95) |
(97) |
(99) |
||
Dividends |
(1,059) |
(1,270) |
(1,277) |
(1,346) |
(1,394) |
(1,443) |
(1,494) |
(1,548) |
||
Net Cash Flow |
239 |
(2,725) |
(1,492) |
(1,403) |
(1,407) |
(1,503) |
(1,421) |
(1,277) |
||
Opening net debt/(cash) |
|
|
21,429 |
21,190 |
23,915 |
25,407 |
26,810 |
28,217 |
29,720 |
31,141 |
HP finance leases initiated |
0 |
0 |
0 |
0 |
0 |
0 |
0 |
0 |
||
Other |
0 |
0 |
0 |
0 |
0 |
0 |
(0) |
(0) |
||
Closing net debt/(cash) |
|
|
21,190 |
23,915 |
25,407 |
26,810 |
28,217 |
29,720 |
31,141 |
32,418 |
Source: National GriD, Edison Investment Research
|