Last close As at 05/08/2026
GBP8.23
▲ 24.00 (3.00%)
Market capitalisation
GBP802m
Research: TMT
In H125, discoverIE used its flexible operating model and ongoing efficiency initiatives to drive underlying operating profit growth despite a 5% revenue decline. Customer destocking has abated during H1 and order intake was 7% higher year-on-year and 1% higher on an organic basis. Strong design win activity positions the company for growth as customer demand returns. Management maintained its earnings outlook for FY25 and in addition to improving customer demand, lower interest rates should start to benefit the company from H225. With strong cash generation reducing gearing, we expect further M&A to boost growth and margins.
discoverIE Group |
Moving in the right direction |
H125 results |
Electrical components |
11 December 2024 |
Share price performance
Business description
Next events
Analyst
discoverIE Group is a research client of Edison Investment Research Limited |
|||||||||||||||||||||||||||||||||||||||||||||
In H125, discoverIE used its flexible operating model and ongoing efficiency initiatives to drive underlying operating profit growth despite a 5% revenue decline. Customer destocking has abated during H1 and order intake was 7% higher year-on-year and 1% higher on an organic basis. Strong design win activity positions the company for growth as customer demand returns. Management maintained its earnings outlook for FY25 and in addition to improving customer demand, lower interest rates should start to benefit the company from H225. With strong cash generation reducing gearing, we expect further M&A to boost growth and margins.
Year |
Revenue |
PBT* |
Diluted EPS* |
DPS |
P/E |
Yield |
03/23 |
448.9 |
46.3 |
35.2 |
11.45 |
20.5 |
1.6 |
03/24 |
437.0 |
48.2 |
36.8 |
12.00 |
19.6 |
1.7 |
03/25e |
431.9 |
49.9 |
37.3 |
12.50 |
19.3 |
1.7 |
03/26e |
444.7 |
52.4 |
39.0 |
13.00 |
18.5 |
1.8 |
Note: *PBT and EPS as per discoverIE’s underlying metric (excludes amortisation of acquired intangibles and exceptional items).
Beating FY25 13.5% margin target in H125
discoverIE reported a 5% revenue decline in H125 due to customer destocking and a 10% decline on an organic constant exchange rate (CER) basis. Despite this, underlying operating profit was up 2% y-o-y (4% CER) with a 0.9pp increase in underlying operating margin to 13.8%. Higher net interest costs due to higher interest rates resulted in underlying EPS down 4% y-o-y. The interim dividend of 3.9p was 4% higher year-on-year. The company maintained its earnings expectations for FY25 and our EPS forecasts for FY25 and FY26 are unchanged. Net debt reduced by 5% from the end of FY24 and gearing reduced to 1.45x.
Orders up led by Sensors & Connectivity
H125 orders increased 7% y-o-y, 5% h-o-h and were 1% higher y-o-y on an organic basis resulting in a book-to-bill of 0.98x. The Sensing & Connectivity division, which is around six months ahead of Magnetics & Controls in terms of customer destocking, saw a 20% organic increase in bookings year-on-year and a book-to-bill of 1.08x, helped by its strong base of design wins. Design win activity at the group level was up 8% y-o-y (and up 33% over two years), providing a strong foundation for future production orders.
Valuation: Accretive M&A to drive upside
The stock rebounded on news that FY25 guidance had been maintained and order intake had turned positive, but still trades at a 13% discount to its broader UK industrial technology peer group on FY25 P/E and at a larger discount to peers with a similar decentralised operating model (such as Halma and Spirax). Considering that the earnings outlook has been maintained and the company continues to make excellent progress towards its margin targets, we believe this discount is overdone. With an active M&A pipeline and c £70m of debt headroom, we expect further acquisitions to boost growth and earnings.
Investment summary
Designing and manufacturing innovative electronics for industry
discoverIE is a leading designer and manufacturer of customised electronic components for industrial applications. Over the last 14 years, the company has broadened its product range, customer base and geographical presence via a series of acquisitions. It designs and manufactures differentiated products and expansion along the supply chain has helped the company to grow operating margins. discoverIE continues to target growth both organically and via acquisition with a focus on higher-margin businesses. To grow revenues well ahead of GDP, it is focused on five structural growth markets: renewable energy, electrification of transportation, medical, security and industrial automation & connectivity. Its capital-light business model supports strong cash flow generation, with the aim of increasingly self-funding acquisitions.
Financials: EPS forecasts maintained
While ongoing customer destocking resulted in a 4% CER revenue decline in H125, ongoing efficiency measures and flexible manufacturing resulted in a 4% CER increase in underlying operating profit and a 0.9pp increase in operating margin to 13.8%. The company has already beaten its FY25 margin target of 13.5% and is well on the way to its FY28 target of 15%. Net debt/EBITDA stood at 1.45x at end-H125 and we expect this to reduce to 1.2x by end-FY25. Management anticipates delivering underlying earnings in line with board expectations for FY25; we maintain our earnings forecasts for FY25 and FY26.
Valuation: Accretive acquisitions to accelerate earnings growth
The stock rebounded on news that FY25 guidance had been maintained and order intake had turned positive, but still trades at a 13% discount to its broader UK industrial technology peer group on FY25 P/E and at a larger discount to peers with a similar decentralised operating model (such as Halma and Spirax). Considering that the earnings outlook has been maintained and the company continues to make excellent progress towards its margin targets, we believe this discount is overdone. With an active M&A pipeline and debt headroom, we expect further acquisitions to boost growth and earnings.
Sensitivities: Economy, currency, pricing and acquisitions
Our estimates and discoverIE’s share price will be sensitive to the following factors. Customer demand: demand will be influenced by the economic environment in Europe and increasingly in North America and Asia. Supply chain: raw materials and components are sourced globally so the company must manage around availability. Currency: with c 90% of revenues generated in currencies other than sterling, discoverIE is exposed to the translation of euro, US dollar and Nordic-denominated subsidiary results into sterling. Pricing: discoverIE’s revenues and profitability are sensitive to its ability to include in price quotes engineering time spent on designing customer solutions. The company normally passes through supplier price increases and tariffs. Acquisitions: discoverIE expects to make further acquisitions, which could add integration risk, and larger deals may require equity funding.
Company description: Innovative custom electronics
discoverIE designs and manufactures customised electronics for industry, with operations throughout Europe and increasingly outside Europe. The last 14 years have seen the integration of a series of acquisitions and a focus on growing the percentage of higher-margin specialist products, resulting in higher profitability.
Company history
discoverIE was founded in 1986 and was admitted to the official list of the London Stock Exchange in 1994 as a pure distributor of electronic components. After a change in management in 2009, through its strategy of specialisation the company has transitioned to become a designer and manufacturer of customised electronics with operations in Europe, Asia and North America. The company has made a series of design and manufacturing acquisitions since 2011 – we provide further detail in Exhibit 10. discoverIE sold its Custom Supply distribution business in FY22 and is now fully focused on higher-margin design and manufacturing. The group has c 4,500 employees across 20 countries.
Business model
discoverIE specialises in the design and manufacture of technically demanding, bespoke electronics for industrial applications and is focused on five target markets comprising 80% of group sales – renewables, electrification of transportation, medical, security and industrial automation & connectivity – all of which are long-term structural growth markets. The market for niche electronic components, worth c $30bn, is very fragmented and discoverIE mainly competes against small, privately owned, country-specific manufacturers in one or two technology areas. The company expects to continue its active role in consolidating this market.
Industrial focus leads to longer product cycles, robust margins
discoverIE’s components tend to be a small but essential part of the systems they are designed into and as such, tend not to commoditise, supporting robust margins. discoverIE’s engineers work with customers throughout their product development process, from design concept to volume manufacturing. A customer will typically take six to 24 months to move a product from design to volume production, at which point the company should earn revenues for the life of the product, typically five to seven years.
We highlight that discoverIE is focused on industrial original equipment manufacturers (OEMs) and does not serve the consumer electronics market (which tends to be highly commoditised with short lifetime products and often highly cyclical sales) or the semiconductor equipment market (which is highly cyclical). It also does not have high customer concentration.
Manufacturing footprint optimised for cost and flexibility
discoverIE’s custom electronic products are either designed uniquely or modified from an existing product. The large majority of products are manufactured at 38 sites across 20 countries, with the remainder manufactured by third-party contractors. This enables the company to support customers operating internationally and provides flexibility if a customer wishes to relocate production. Due to smaller batch sizes, production is either manual or semi-automated, which provides flexibility and results in a capital-light model. discoverIE spends less than 2% of revenue per annum on its manufacturing facilities to support organic growth and another 2% on R&D (all expensed).
Raw materials comprise the largest proportion of product cost
The majority of products are manufactured in-house from raw materials and base components. Energy costs represent less than 1% of group revenue, as operations are mainly manual or semi-automated.
Diverse range of custom electronic products
Mainly through acquisition, discoverIE has built up its design and manufacturing capability in four areas of technology: sensors, magnetics, controls and connectivity. discoverIE reports through two divisions: Magnetics & Controls (M&C) and Sensing & Connectivity (S&C). Exhibits 1 and 2 show the companies and brands reported within each division. M&C consists of two clusters plus two further businesses across 17 countries with 21 manufacturing sites (main facilities in China, India, Mexico, Poland, Sri Lanka, Thailand, the UK and the US). S&C consists of four clusters and three further businesses across nine countries with 15 manufacturing sites (main facilities in Hungary, the Netherlands, Norway, Slovakia, the UK and the US).
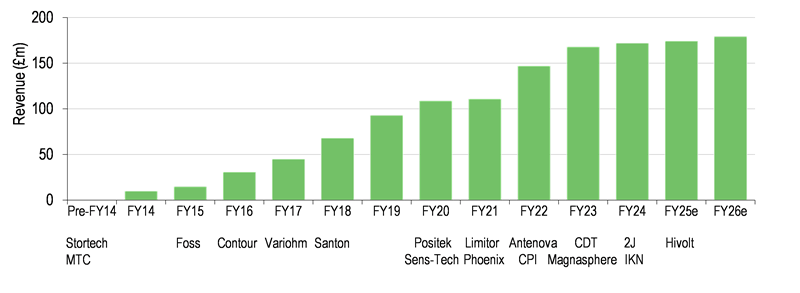
Exhibits 3 and 4 show the progression of revenue in each division and the timing of acquisitions.
|
Exhibit 1: Sensing & Connectivity |
|
|
Source: discoverIE |
|
Exhibit 2: Magnetics & Controls |
|
|
Source: discoverIE |
|
Exhibit 3: M&C – revenue and acquisitions |
|
|
Source: discoverIE, Edison Investment Research |
|
Exhibit 4: S&C – revenue and acquisitions |
|
|
Source: discoverIE, Edison Investment Research |
Group strategy
The group is focused on markets with sustainable growth prospects and increasing electronic content where there is an essential need for its products. It invests in initiatives and businesses that enhance design opportunities for customised products in targeted long-term structural growth markets.
Management has transformed the company into a technology led provider of customised electronics for industrial applications with design and manufacturing capabilities. The company has the following strategic objectives:
■
Grow sales well ahead of GDP over the economic cycle by focusing on the structural growth markets that form the company’s target markets.
■
Improve operating margins by generating efficiencies through clustering and moving up the value chain into higher-margin products.
■
Acquire highly differentiated businesses with attractive growth prospects and strong operating margins.
■
Reduce impact on the environment by achieving net zero carbon emissions.
This is underpinned by the objectives of generating strong cash flows from a capital-light model and delivering long-term sustainable returns.
For more than 10 years, the company has tracked progress with these objectives by setting key strategic indicators (KSIs) and key financial performance indicators (KPIs). From this year, it has simplified this process, setting seven KSIs to monitor the business through its next stage of development. We discuss these in more depth below.
Capital allocation – self-funding M&A
At the start of its journey to build the group into a designer and manufacturer of custom electronics, the company depended heavily on equity funding for M&A. As the group has grown and cash generation has increased, the company has moved more to debt funding of acquisitions. The chart below shows the sources and use of funds since FY18.
|
Exhibit 5: discoverIE capital allocation since FY18 |
|
|
Source: discoverIE |
As the company still has the ambition to grow the group further through M&A and has an active pipeline of targets, we expect that cash generation will continue to be channelled into acquisitive growth. If at some point in the future the company has excess cash, it would consider share buybacks. However, we do not expect this in the medium term.
Experienced board supports growth ambitions
To support its growth ambitions, discoverIE has constructed a board with substantial experience in acquisitions and international growth. Executive directors are Nick Jefferies (CEO since 2009) and Simon Gibbins (CFO since 2010). The board is chaired by Bruce Thompson (non-executive director (NED) at discoverIE since 2018, ex-Diploma CEO 1996–2018, non-executive chairman at Avon Technologies). Other non-executive directors include Clive Watson, the audit committee chair (ex-group FD of Spectris 2006–19, NED at Breedon Group, Kier Group and Trifast, ex-audit chair of Spirax Sarco for nine years), Rosalind Kainyah, the sustainability committee chair(runs ESG consultancy Kina Advisory, NED at GEM Diamonds, WE Soda and EnQuest, previously VP external affairs and CSR at Tullow Oil) and Celia Baxter, the remuneration committee chair (previously group HR director at Bunzl for 13 years; currently NED at DS Smith and Dowlais Group).
Group executive management includes the CEO and CFO supported by, among others, group commercial directors for S&C (Paul Hill) and M&C (Martin Pangels), group head of corporate development (Jeremy Morcom), group development director (Neale Sutton) and group general counsel and company secretary (Greg Davidson).
Tracking strategic progress
Exhibit 6 summarises the new KSIs and tracks progress since FY14. Two previously tracked KSIs have been substantially achieved so will no longer be tracked: 1) sales outside of Europe are now at 43% up from 5% in FY14, close to the 45% target; 2) target market sales are now at 80% versus the 85% target and up from c 40% in FY14. Dividend growth was previously included as a KPI; while this is longer the case the company is maintaining its progressive dividend policy. We discuss the return on capital employed (ROCE), EPS and cash flow generation performance in the Financials section.
Exhibit 6: Key strategic indicators (KSIs)
FY14 |
FY18 |
FY19 |
FY20 |
FY21 |
FY22 |
FY23 |
FY24 |
H124 |
H125 |
Target |
|
Increase underlying operating margin |
3.4% |
6.3% |
7.0% |
8.0% |
10.2% |
10.9% |
11.5% |
13.1% |
12.9% |
13.8% |
13.5% (FY25), 15% (FY28) |
Sales growth: CER |
17% |
11% |
14% |
8% |
(1%) |
28% |
15% |
1% |
4% |
(4%) |
Well ahead of GDP |
Sales growth: continuing organic |
3% |
11% |
10% |
5% |
(4%) |
18% |
10% |
-1% |
1% |
(10%) |
|
Underlying EPS growth |
20% |
16% |
22% |
11% |
(8%) |
31% |
20% |
5% |
8% |
(4%) |
>10% |
ROCE* |
15.2% |
13.7% |
15.4% |
16.0% |
14.5% |
14.7% |
15.9% |
15.7% |
15.1% |
15.2% |
>15% |
Operating cash flow generation** |
100% |
85% |
93% |
106% |
128% |
80% |
94% |
103% |
91% |
115% |
>85% of underlying operating profit |
Free cash flow generation** |
107% |
78% |
94% |
104% |
136% |
77% |
95% |
102% |
85% |
126% |
>85% of underlying profit after tax |
Reduce Scope 1 & 2 carbon emissions |
35% |
47% |
47% |
50% |
65% |
Source: discoverIE. Note: FY14–FY20 are for total operations before disposals, as reported. *ROCE is calculated as underlying operating profit (acquisitions annualised) as a percentage of net assets excluding net debt, deferred consideration for discontinued operations and legacy defined pension asset/liability. **Last 12 months.
Expanding operating margins
discoverIE started life as a pure distributor of electronic components, but through a strategy of specialisation and acquisition it has transitioned to become a designer and manufacturer of customised electronic solutions. Since 2011, the company has acquired 27 businesses with design and manufacturing capabilities; these are typically much higher margin than the original distribution business, with recent acquisitions generating operating margins of 20% plus.
The charts below show the financial performance of the continuing business over the last five years and our forecasts for FY25–26. FY21 results were affected by pandemic-related demand weakness, although the underlying operating margin remained flat in FY21. The margin increased 0.9pp y-o-y in H125 to 13.8% and was 0.7pp higher than the 13.1% achieved in FY24. From FY18 to FY24, the margin expanded from 6.3% to 13.1%, with a 3.0pp increase from organic improvement, a 2.5pp increase from higher-margin acquisitions and a 1.3pp increase from the disposal of lower-margin businesses.
The target is for a 13.5% underlying operating margin by FY25 (already achieved in H125) and a 15% margin in the medium term (by FY28), to be achieved, roughly 50/50, through a combination of organic growth and higher-margin acquisitions.
|
Exhibit 7: Revenue, FY20–26e |
Exhibit 8: Underlying operating profit, FY20–26e |
|
|
|
Source: discoverIE, Edison Investment Research |
|
Exhibit 7: Revenue, FY20–26e |
|
|
Source: discoverIE, Edison Investment Research |
|
Exhibit 8: Underlying operating profit, FY20–26e |
|
|
Source: discoverIE, Edison Investment Research |
The company noted that one lever of organic margin growth has been optimisation of its manufacturing capacity. Many acquired businesses bring their own manufacturing facilities to the group. In recent years, the company has reduced the number of sites in similar locations (eg reducing from three to one site in Mexico) and developed shared production capacity in certain geographies, resulting in annual savings of c £4m. It has also relocated production, for example, from the UK and Western Europe to Hungary, resulting in lower labour costs, volume efficiencies and in some cases moving production closer to the customer. This has generated c £2.3m in annual cost savings. Other levers include creating clusters of businesses in similar product areas (discussed further in the section on acquisitions) and collaboration across the group (see our note on the September capital markets day for more detail).
Targeting high-growth markets to drive organic revenue growth
As part of the group’s goal to grow revenue well ahead of GDP on an organic basis, operating companies are tasked with growing revenue at 10% per annum. To achieve this, discoverIE targets higher-growth markets. These are markets that exhibit structural growth and depend on technology for product development, resulting in increasing electronic content. discoverIE aims to supply essential products to OEMs in these markets. With the increasing focus on ESG by investors and consumers alike, the company is keen that its target markets also align with the United Nations’ Sustainable Development Goals (SDGs).
The table below illustrates the five target markets, the growth prospects of each market and examples of products that discoverIE provides for each market.
In H125, the business generated 80% of its revenues from these five areas. Typically, growth from target markets materially exceeds other markets (target market sales grew 80% organically from FY17 to FY24 compared to 19% growth from other markets). While the company does not actively stop supplying customers in non-target markets, it encourages each business to focus its sales efforts on target markets and builds this approach into acquired companies’ three-year plans. As target markets typically grow faster than non-target markets, over time the contribution from target markets should grow as a percentage of total revenue.
|
Exhibit 9: Targeted growth markets |
|
|
Source: discoverIE, Edison Investment Research |
Acquisitions core to growth strategy
From 2011 discoverIE started to make a series of acquisitions of companies with design and manufacturing capabilities (see Exhibit 10 below). The company has a dedicated M&A team focused on developing and pursuing opportunities.
Criteria for acquisition targets
discoverIE’s focus for future acquisitions is to target design and manufacturing companies with commercially viable technologies that can be applied to its target markets or with complementary product(s) and/or geographical capability supplying common markets and customers. The preference is to buy businesses that are successful and profitable, with good growth prospects, good margins and similar long-term growth drivers to discoverIE’s focus markets, but which need scaling up.
Management considers two types of acquisition: ‘platform’ to create a new position in a technology and/or geography and ‘bolt-on’ to expand the position of an existing business. The company’s M&A director is focused on sourcing new acquisition targets in discoverIE’s key technological and geographical markets, namely companies with design and manufacturing capabilities in any of the group’s technology areas, located in Europe, North America or Asia.
Integration strategy: Retain entrepreneurial approach
The acquired businesses are led by entrepreneurial managers and discoverIE is keen to retain this culture. To support this, acquired businesses typically continue to operate under their own brands and management, working towards agreed business plans. discoverIE has created technology clusters, where smaller businesses are taken under the wing of a larger business operating in the same product area (see Exhibits 1 and 2).
Acquired businesses can take advantage of being part of the larger group, with access to the wider discoverIE customer base, support for product development and manufacturing, centralised finance and administrative support. Efficiency improvements are achieved through knowledge-sharing among the businesses and group guidance on best practices. Where appropriate, manufacturing is rationalised to make the most efficient use of the group’s network of manufacturing facilities.
Acquisition track record
The table below summarises the acquisitions the group has made since FY12.
Exhibit 10: Acquisition timeline
Company |
Date |
Product areas |
Operations |
Sales |
Cost (£m) |
Hectronic |
Jun 11 |
Embedded computing |
Sweden |
Nordic region, US |
1.2 |
MTC |
Oct 11 |
Electro-magnetic shielding |
Germany, South Korea |
Europe and Asia |
2.7 |
Myrra SAS |
Apr 13 |
Transformers, coils, cores and inductors |
France, Poland, China |
Europe, Asia, North America, Africa |
9.9 |
Noratel |
Jul 14 |
Low-, medium- and high-power transformers and inductors |
Nordic region, China, US, India, Poland, Sri Lanka |
Europe, Asia, North America |
73.5 |
Foss |
Jan 15 |
Customised fibre-optic solutions |
Norway, Slovakia |
Norway, Eastern Europe |
12 |
Flux |
Nov 15 |
Customised magnetic components |
Denmark, Thailand |
Denmark |
4 |
Contour |
Jan 16 |
Custom cable assemblies and connectors |
UK |
UK |
17.5 |
Plitron |
Feb 16 |
Custom toroidal transformers |
Canada |
North America |
1.8 |
Variohm |
Jan 17 |
Electronic sensors, switches and motion measurement systems |
UK, Germany |
UK, France, Germany, US |
13.3 |
Santon |
Feb 18 |
DC and AC switches and switchgear |
Netherlands, UK |
Europe, Asia, US |
23.7 |
Cursor Controls Group |
Oct 18 |
Human-to-machine interface technology |
UK, Belgium |
UK, Europe, North America, Asia |
19.0 |
Hobart |
Apr 19 |
Customised transformers, inductors, magnetics |
US, Mexico |
North America |
11.7 |
Positek |
Apr 19 |
Sensors |
UK |
UK, Europe, North America, Asia Pacific |
4.2 |
Sens-Tech |
Oct 19 |
Specialist sensing and data acquisition modules for X-ray and optical detection applications |
UK |
US, Europe, Asia, UK |
58.0 |
Phoenix |
Oct 20 |
Magnetically actuated sensors, encoders and related products |
US |
US |
8.5 |
Limitor |
Feb 21 |
Custom thermal safety components including temperature and current sensors, limiters and thermal switches |
Germany, Hungary |
Europe, US, Asia |
13.2 |
CPI |
May 21 |
Custom, rugged sensors and switches |
US |
US |
8.1 |
Beacon EmbeddedWorks |
Sep 21 |
Custom system-on-module embedded computing boards and related software |
US |
US |
58.8 |
Sep 21 |
Antennas and RF modules |
UK, Taiwan, US |
Europe, US, Asia |
18.2 |
|
CDT |
Jul 22 |
Customised plastic enclosures for circuit boards and membrane keypads |
UK |
UK |
5.0 |
Magnasphere |
Jan 23 |
High-performance magnetic sensors and switches for industrial electronics |
US |
US |
19.1 |
Silvertel |
Aug 23 |
Power-over-ethernet modules |
UK |
>70 countries |
21.0 |
2J Antennas Group |
Sep 23 |
High-performance antennas for industrial connectivity |
Slovakia, UK, US |
50 countries |
45.0 |
Shape |
Jan 24 |
Specialty transformer equipment |
US |
US |
7.9 |
DTI |
Mar 24 |
Customised data collection products |
US |
US |
6.6 |
IKN |
Mar 24 |
Products and services for data centres, networking and cabling systems |
Norway |
Norway |
2.5 |
Hivolt |
Jul 24 |
Specialist capacitors |
Northern Ireland |
UK/Europe |
3.3 |
Total |
493.3 |
Source: discoverIE
The company has taken a disciplined approach to M&A; based on initial consideration, it has paid an average of 8.6x trailing PBT and 1.5x trailing sales for businesses with average PBT margins of 18.6%.
Seeking accretive targets
The company is currently tracking more than 400 companies and has identified a pipeline of 250 potential targets. It is in the active outreach phase and in live deal negotiation with a number of these. The chart below shows the areas in which discoverIE already has some presence as well as areas that it is interested in but has yet to penetrate.
|
Exhibit 11: Target areas for acquisitions |
|
|
Source: discoverIE |
Despite the current higher interest rate environment, we expect discoverIE to continue to make accretive acquisitions to drive growth. As deals in the pipeline can take a while to come to fruition, the timing of deals is difficult to forecast and discoverIE wants to take advantage of good deals when they present themselves.
At the end of H125, the company had a net debt position of £98.7m and gearing of 1.45x EBITDA. The company has a £240m revolving credit facility (RCF) due in August 2027. It also has access to an £80m accordion facility; the RCF can be used for acquisitions and working capital. The company targets a gearing range of 1.5–2.0x, suggesting c £70m headroom for further acquisitions based on our forecast for gearing of 1.2x by end FY25.
Carbon emissions reduction
In FY23, discoverIE set net zero carbon emission targets, including a 65% reduction in absolute Scope 1 and 2 emissions from the level in CY21 by the end of CY25. By the end of CY23, the company had reduced absolute emissions by 47% compared to CY21, helped by solar panel installation projects at manufacturing sites in Sri Lanka and Thailand and switching electricity supply to zero carbon energy sources, and the reduction now stands at c 50%. We discuss discoverIE’s approach to ESG in more depth below.
Well established ESG strategy
At the start of 2020, the board and group executive committee initiated a review of the company’s approach to ESG matters, with the aim of further improving discoverIE’s approach to sustainability.
Governance structure in place
The company has a non-executive director, Rosalind Kainyah, with in-depth ESG experience. She established and chairs the sustainability committee, which includes all board members, to help set the group’s overall strategy and ensure the board has access to the knowledge and skills required in this area. Below this, the group sustainability team drives initiatives throughout the group and liaises with operating companies to consider what is practical and feasible. In FY24, a dedicated ESG manager was appointed.
Each member of the group executive committee has a specific ESG responsibility and targets within their personal objectives relating to ESG, with a proportion of annual bonus dependent on achievement of those targets. The company has also rolled out ESG objectives to the management of individual operating businesses.
Three overarching aims
The company has set three primary aims for its ESG strategy:
■
make a positive impact on the environment;
■
keep staff safe and happy; and
■
ensure the reliability and sustainability of products.
As well as ongoing initiatives in each area (eg increasing diversity, development and training plans for staff, supplier audits, responsible sourcing policies, enhancing cyber security controls), measurable targets have been set to work towards achieving each aim. See Exhibit 12 for targets and progress to date. We note that the reduction in carbon emissions is a key strategic indicator for the group.
Exhibit 12: Specific ESG targets
Aim |
How measured |
Targets |
Progress |
Minimise negative impact on the environment |
Carbon emissions – scope 1&2 |
65% reduction against CY21 emissions |
End CY23 -47%, now -50% |
ISO14001 accreditations |
>80% of group’s operations (by revenue) to be covered by an ISO14001 accreditation by 2025 |
69% by end CY23 (59% by end CY22) |
|
Energy audits conducted at group sites |
>80% of all group sites to have been subject to an energy audit within the last five years |
81% by end CY23 (63% by end CY22) |
|
Company cars |
50% to be electric or hybrid by 2025 |
40% by end CY23 (33% by end CY22) |
|
Keep staff safe |
Proportion of workforce covered by ISO45001 compliant occupational health & safety (H&S) system |
>80% to be covered by 2025 |
60% by end CY23 (48% by end CY22) |
No. of H&S representatives and trained H&S staff across the group |
Maintain a ratio of at least 1:50 trained H&S staff to total employees |
1:20 end CY23 (1:21 end CY22) |
|
Staff turnover |
Unplanned staff turnover ≤15% pa |
9% in CY23 (10% in CY22) |
|
Ensure the quality and reliability of products |
Share of group products covered by an ISO9001 system |
Ensure that at least 80% of all products are built in accordance with ISO9001 accredited processes |
98% at end CY23 (92% at end CY22) |
Source: discoverIE. Note: All historic figures adjusted to exclude discontinued operations and include acquisitions since 1 January 2020.
Net zero targets set; scope 3 analysis undertaken
In FY23, the company set net zero carbon emission targets (Science Based Targets initiative (SBTi)-aligned). Based on scope 1 and 2 carbon emissions, the company is aiming to reach net zero carbon emissions by 2030, and including scope 3 emissions, by 2040. Of the 7,948t carbon dioxide equivalent (CO2e) scope 1 and 2 emissions in CY21 (actual rather than like-for-like), 94% came from four emissions sources: purchased electricity (73%), natural gas (13%), company-owned vehicles (7%) and refrigerants (1%). To track progress, the company has set the following milestones:
■
electricity 80% from zero emission sources by 2025 and 100% by 2030 (end CY23 72% from renewable or clean energy, up from 67% at end CY22);
■
90% of gas heating to be replaced with lower-emission alternatives by 2029;
■
all company vehicles to be fully electric by 2030;
■
all refrigerants removed where possible by 2025;
■
energy intensity (kWh/£m revenue) reduced by 10% by 2030. In 2023, energy consumption was 6% lower y-o-y, resulting in energy intensity falling 11% y-o-y and 30% versus CY21, well ahead of the target; and
■
invest in carbon removal projects to remove residual emissions from 2030 onwards.
In FY23, the company completed its first analysis of scope 3 emissions and calculated that CY22 emissions totalled c 70,000t CO2e, making up more than 90% of group emissions across all scopes. In FY24, the company introduced a new carbon reporting system across the group and completed a more detailed calculation of scope 3 emissions. This resulted in a much higher calculation of scope 3 emissions (198,879t CO2e) making up c 98% of group emissions across scope 1, 2 and 3. The largest source of scope 3 emissions was from purchased goods and services (c 75%) followed by freight (c 22%) employee commuting (c 1%) and fuel and energy-related activities (c 1%). Over the next 12 months, the company intends to upgrade systems and processes to support the capture of data more accurately and efficiently, complete the equivalent assessment for CY24 scope 3 emissions and develop its SBTi-aligned plan to reduce scope 3 emissions.
In FY23, the company completed a detailed scenario analysis and quantified the potential financial impact of climate change per Task Force on Climate-Related Financial Disclosures (TCFD) requirements. Based on the 2DS (2oC warming or lower) and BAU (business as usual) TCFD scenarios, the net financial impact over the seven-year period to 2030 is immaterial and represents c 1–2% of group operating cash flows. In early 2024, the company carried out an interim re-assessment of its climate risk analysis to take account of newly acquired businesses and found no material change in the climate-related risk profile of the group.
External reviews validate approach
In its 2023 assessment, MSCI upgraded discoverIE’s rating from ‘A’ to ‘AA’ and in September 2024, reiterated the ‘AA’ rating. The company is rated as having negligible risk by Sustainalytics’ ESG risk rating service, with a Regional Top Rating (Europe) and ranking 24 out of 624 in its technology hardware group.
Financials
Review of H125 results
Exhibit 13: H125 results highlights
£m |
H125 |
H124 |
H124 CER |
Reported yoy |
CER y-o-y |
Organic yoy |
Revenues |
211.1 |
222.0 |
213.7 |
(5%) |
(4%) |
(10%) |
Magnetics & controls (M&C) |
125.8 |
134.4 |
132.2 |
(6%) |
(5%) |
(12%) |
Sensing & connectivity (S&C) |
85.3 |
87.6 |
86.7 |
(3%) |
(2%) |
(5%) |
Underlying operating profit |
||||||
Magnetics & controls |
18.2 |
19.9 |
19.6 |
(9%) |
(7%) |
|
Sensing & connectivity |
16.8 |
15.2 |
15.0 |
11% |
12% |
|
Unallocated |
(5.9) |
(6.5) |
(6.5) |
(9%) |
||
Total underlying operating profit |
29.1 |
28.6 |
28.1 |
2% |
4% |
|
Total underlying operating margin |
13.8% |
12.9% |
13.1% |
0.9% |
||
Magnetics & controls |
14.5% |
14.8% |
14.9% |
(0.3%) |
||
Sensing & connectivity |
19.7% |
17.4% |
17.3% |
2.3% |
||
Reported operating profit |
21.1 |
19.5 |
8% |
|||
Underlying EPS (p) - diluted |
18.4 |
19.2 |
(4%) |
|||
Reported EPS (p) - diluted |
12.2 |
11.7 |
4% |
|||
Net debt |
98.7 |
111.3 |
(11%) |
Source: discoverIE
discoverIE reported a 5% y-o-y decline in revenue in H125, a 4% decline CER and a 10% decline on a CER basis. Both divisions saw declining organic revenues during H125 as customers worked through excess inventory. Despite the revenue decline, underlying operating profit increased 2% yoy or 4% CER, with the margin increasing 0.9pp to 13.8%. The group managed to improve organic gross margins by 1.4pp (partly due to its ability to flex manufacturing capacity and partly due to product mix) and reduced organic operating costs by 5% y-o-y. While some of the reduction in operating costs was from variable costs such as bonuses and commission that we would expect to rebound with increasing sales, other reductions were permanent and reflect the company’s efforts to improve efficiency across the group.
S&C saw a strong increase in profitability, with the margin increasing 2.3pp y-o-y, despite the revenue decline. Management noted that the absence of orders from some larger OEMs helped the margin as they typically command keener pricing. Experiencing a larger revenue decline, M&C saw a marginal decrease in its margin of 0.3pp.
Reported operating profit includes amortisation of acquired intangibles totalling £7.8m and acquisition-related costs of £0.2m (acquisition-related costs of £0.7m, losses on the Santon solar business of £0.4m and integration costs of £1.2m offset by a £2.1m credit from reducing the fair value of contingent consideration). Net finance costs increased from £3.5m in H124 to £5.3m H125 reflecting the impact of higher interest rates. The effective tax rate of 24% was 1pp lower than in H124 due to a higher proportion of profits generated in the US. Overall, underlying EPS declined 4% y-o-y.
Key strategic indicator performance
■
Sales growth: the business has shown strong organic growth since FY18, well ahead of GDP, apart from in COVID-affected FY21. The CAGR of organic revenue since FY18 is c 6%. Organic growth has slowed through FY24 and declined in H125 as the macroeconomic environment weakened and companies have been working down excess inventory. The company still targets 10% organic growth through the cycle.
■
EPS growth: excluding FY21, the company has grown underlying EPS at or ahead of its target rate every year to FY23. FY24 and H125 growth was affected by customer destocking, higher interest rates and higher net debt to fund acquisitions. discoverIE should benefit from declining interest rates as it has floating rate debt.
■
ROCE: the company met the target achieving ROCE of 15.2% in H125. The company notes that acquisitions bring the level of ROCE down, and organic ROCE (which excludes acquisitions in the last 18 months) was 17.3% in the period, up from 15.9% in FY23. For deals done more than seven years ago, ROCE has grown to 29%.
■
Operating cash conversion: H125 operating cash conversion was well ahead of the target level and trailing 12-month operating cash flow of £66.3m was 33% ahead of the same period a year ago.
■
Free cash flow conversion: H125 free cash flow conversion was also well ahead of the target level. Trailing 12-month free cash flow of £44.6m was 46% higher year-on-year. This strong cash generation supports future M&A.
Gearing to reduce to c 1.2x by end FY25
At the end of H125, the company had used £131m of its £240m RCF. The chart below shows discoverIE’s gearing levels since FY15, with gearing only higher than 1.5x on two occasions, after the acquisitions of Contour and Cursor Controls. The lower level of gearing in FY21–23 reflects the focus on cash preservation during COVID, which included a brief pause in acquisitions, as well as equity fund-raising in FY22 to partially fund the acquisitions of Beacon EmbeddedWorks and Antenova. Our forecasts, absent any further acquisitions, assume that gearing reaches 1.2x by the end of FY25 and 1.0x by the end of FY26.
|
Exhibit 14: Net debt/EBITDA (x) FY15–26e |
|
|
Source: discoverIE, Edison Investment Research |
Outlook and changes to forecasts
The order book at the end of H125 was £163m, down from £175m at the end of FY24, and equating to c 4.5 months of H125 revenue. Customers continued to destock through H125, albeit at a lower rate than in FY24. While the ‘Big 9’ OEMs have largely worked through their excess inventory, management notes that other smaller customers had started destocking later and some of this process is still ongoing.
H125 orders of £206.6m were 7% higher y-o-y (up 8% CER) and 1% higher on an organic CER basis. The book-to-bill ratio for H125 was 0.98:1 versus 0.87:1 in H124. In S&C, orders were up 26% CER y-o-y to £92.1m whereas in M&C, which is around six months behind S&C in terms of customer destocking, orders declined 3% CER y-o-y to £114.5m. So far in Q325, trading is ahead of Q225, and the book-to-bill is above 1x.
Design win activity is a leading indicator of future revenue growth. In H125, the company generated design wins with an estimated lifetime value of £205m, 8% higher year-on-year and 33% higher over two years.
Management anticipates delivering underlying earnings in line with its expectations for FY25. We reduce our revenue forecasts for FY25 and FY26 to reflect the impact of the ongoing destocking, but for FY25 we maintain our underlying operating profit and EPS forecasts. For FY26, we slightly reduce our underlying operating profit estimate but this is offset by lower net finance costs and our underlying EPS forecast is unchanged. We forecast an underlying operating margin of 14.0% for FY25 and FY26. This may be conservative for FY26, but we have assumed that as revenues start to increase, certain variable operating costs will also increase.
Exhibit 15: Changes to forecasts
£m |
FY25e old |
FY25e new |
Change |
y-o-y |
FY26e old |
FY26e new |
Change |
y-o-y |
Revenues |
441.1 |
431.9 |
(2.1%) |
(1.2%) |
454.7 |
444.7 |
(2.2%) |
3.0% |
EBITDA |
74.6 |
74.3 |
(0.4%) |
4.5% |
77.1 |
76.9 |
(0.3%) |
3.5% |
EBITDA margin |
16.9% |
17.2% |
0.3% |
0.9% |
17.0% |
17.3% |
0.3% |
0.1% |
Underlying operating profit |
60.5 |
60.5 |
0.1% |
5.8% |
62.9 |
62.2 |
(1.1%) |
2.8% |
Underlying operating margin |
13.7% |
14.0% |
0.3% |
0.9% |
13.8% |
14.0% |
0.2% |
(0.0%) |
Normalised operating profit |
62.9 |
61.9 |
(1.5%) |
4.1% |
65.3 |
64.6 |
(1.1%) |
4.4% |
Normalised operating margin |
14.3% |
14.3% |
0.1% |
0.7% |
14.4% |
14.5% |
0.2% |
0.2% |
Underlying PBT |
49.9 |
49.9 |
0.1% |
3.5% |
52.4 |
52.4 |
(0.0%) |
5.0% |
Normalised PBT |
52.3 |
51.3 |
(1.9%) |
1.6% |
54.8 |
54.8 |
(0.0%) |
6.8% |
Normalised net income |
38.5 |
37.8 |
(1.9%) |
(0.2%) |
40.4 |
40.4 |
(0.0%) |
6.8% |
Normalised diluted EPS (p) |
39.1 |
38.4 |
(1.9%) |
(0.4%) |
40.8 |
40.8 |
(0.0%) |
6.3% |
Underlying diluted EPS (p) |
37.3 |
37.3 |
0.1% |
1.5% |
39.0 |
39.0 |
(0.0%) |
4.5% |
Reported basic EPS (p) |
23.0 |
25.3 |
10.2% |
56.3% |
24.8 |
26.3 |
6.2% |
4.0% |
Dividend per share (p) |
12.5 |
12.5 |
0.0% |
4.2% |
13.0 |
13.0 |
0.0% |
4.0% |
Net (debt)/cash |
(89.0) |
(84.5) |
(5.1%) |
(18.8%) |
(74.1) |
(66.9) |
(9.7%) |
(20.8%) |
Net debt/EBITDA (x) |
1.3 |
1.2 |
1.1 |
1.0 |
Source: Edison Investment Research
Valuation
Exhibit 16 shows financial metrics for discoverIE’s peer group and Exhibit 17 shows the valuation metrics. For the peer group, we use companies active in the electronics market and acquisitive industrial companies. discoverIE’s stock is up 2% over the last year and up 26% since its low in early October. The stock rebounded on interim results, we assume due to maintenance of earnings guidance and evidence that bookings growth had returned to one division. The stock trades at a 13% discount to the average of its broader UK industrial technology peer group on an FY25e P/E basis but at a discount compared to peers with a similar decentralised operating model (such as Halma and Spirax). With strong progress being made towards the medium-term 15% operating margin goal, the company is forecast to generate EBIT margins ahead of the peer average in FY25. The focus on strategic growth markets supports sustained organic revenue growth through the cycle and we see potential for upside to earnings through operating margin expansion and accretive acquisitions.
Exhibit 16: Peer group financial metrics
Year end |
Share price (p) |
Market cap (£m) |
Revenue growth (%) |
EBITDA margin (%) |
EBIT margin (%) |
||||
CY |
NY |
CY |
NY |
CY |
NY |
||||
discoverIE |
31-Mar |
721 |
695 |
(1.2) |
3.0 |
17.2 |
17.3 |
14.0 |
14.0 |
Diploma |
30-Sep |
4546 |
6100 |
7.9 |
5.8 |
23.9 |
23.9 |
20.8 |
20.8 |
Gooch & Housego |
30-Sep |
490 |
127 |
10.0 |
4.3 |
16.1 |
17.5 |
9.3 |
10.8 |
TT electronics |
31-Dec |
118 |
210 |
(12.4) |
1.3 |
9.8 |
12.0 |
6.1 |
8.2 |
XP Power |
31-Dec |
1258 |
298 |
(18.3) |
7.3 |
16.9 |
19.7 |
9.4 |
12.3 |
Avon Protection |
30-Sep |
1386 |
420 |
5.6 |
6.7 |
15.9 |
17.8 |
10.6 |
14.0 |
Halma |
31-Mar |
2772 |
10,524 |
8.4 |
6.4 |
23.4 |
23.7 |
19.9 |
20.3 |
Spectris |
31-Dec |
2586 |
2,561 |
(12.0) |
12.4 |
19.4 |
21.2 |
13.9 |
16.7 |
Spirax-Sarco Engineering |
31-Dec |
7275 |
5,362 |
(0.8) |
4.1 |
24.1 |
24.5 |
19.4 |
19.9 |
Average |
(1.4) |
6.0 |
18.7 |
20.0 |
13.7 |
15.4 |
|||
Source: Edison Investment Research, LSEG Data & Analytics (as at 9 December)
Exhibit 17: Peer group valuation metrics
EV/sales (x) |
EV/EBITDA (x) |
EV/EBIT (x) |
P/E (x) |
Div yield (%) |
||||||
CY |
NY |
CY |
NY |
CY |
NY |
CY |
NY |
CY |
NY |
|
discoverIE |
1.8 |
1.8 |
10.7 |
10.4 |
12.9 |
12.4 |
19.3 |
18.5 |
1.7 |
1.8 |
Diploma |
4.5 |
4.2 |
18.8 |
17.8 |
21.6 |
20.4 |
28.4 |
26.3 |
1.4 |
1.4 |
Gooch & Housego |
1.0 |
1.0 |
6.5 |
5.8 |
11.3 |
9.3 |
12.9 |
10.7 |
2.7 |
2.8 |
TT electronics |
0.6 |
0.6 |
6.4 |
5.2 |
10.3 |
7.5 |
10.5 |
7.1 |
5.4 |
5.8 |
XP Power |
1.8 |
1.7 |
10.5 |
8.4 |
18.8 |
13.4 |
27.3 |
15.1 |
0.0 |
2.5 |
Avon Protection |
2.1 |
1.9 |
13.0 |
10.9 |
19.5 |
13.9 |
25.1 |
17.9 |
1.5 |
1.8 |
Halma |
5.1 |
4.8 |
21.6 |
20.1 |
25.4 |
23.4 |
31.1 |
28.9 |
0.8 |
0.9 |
Spectris |
1.8 |
1.6 |
9.4 |
7.7 |
13.1 |
9.8 |
17.5 |
14.9 |
3.2 |
3.4 |
Spirax-Sarco Engineering |
3.7 |
3.6 |
15.3 |
14.5 |
19.0 |
17.8 |
25.1 |
22.8 |
2.3 |
2.4 |
Average |
2.6 |
2.4 |
12.7 |
11.3 |
17.4 |
14.4 |
22.2 |
18.0 |
2.2 |
2.6 |
Premium/(discount) to average |
(28.2) |
(25.9) |
(15.3) |
(7.9) |
(25.8) |
(14.4) |
(13.2) |
3.0 |
(19.6) |
(31.3) |
Source: Edison Investment Research, LSEG Data & Analytics (as at 9 December)
Potential for accretive acquisitions
We estimate that discoverIE is paying c 6.5% for its debt (all floating rate) so any debt-funded acquisition will have a higher bar to clear to generate earnings accretion than was the case a couple of years ago. The company has a good track record for buying high-margin businesses on lower multiples than its own and is usually able to improve the businesses it buys, for example by focusing on design wins and target markets, optimising working capital or benefiting from group volume discounts and better sales reach. As an illustration of the potential for earnings accretion, if we assume that discoverIE spends £30m on a company with operating margins of 20% and pays 8x EBIT, we estimate that this would increase our FY26 underlying operating margin by 0.2pp to 14.2% and increase our FY26 underlying diluted EPS forecast by 3.6%, while increasing end-FY25 gearing to 1.6x (compared to our current forecast of 1.2x). The same calculation on a 10x deal multiple would reduce EPS accretion to 2.1%. In the current uncertain macroeconomic environment, management noted that sellers’ price expectations have become more realistic.
Sensitivities
Our estimates and the discoverIE share price will be sensitive to the following factors:
■
Customer demand: customer demand will be influenced by the economic environment in Europe and, increasingly, the United States and Asia-Pacific. It will also be sensitive to the gain or loss of major customers, although in H125 no customer made up more than 8% of sales.
■
Supply chain: discoverIE buys raw materials and components from suppliers around the world and will be affected by the availability of these supplies as well as the cost and availability of freight to transport them.
■
Currency: translational – with c 90% of revenues in non-sterling currencies, discoverIE is exposed to the translation of euro, US dollar and Nordic-denominated subsidiary results into sterling, which decreased growth in sales by 1pp and underlying operating profit by 2pp in H125. Transactional – discoverIE sells mainly in euros, US dollars, sterling and Nordic currencies, and purchases mainly in US dollars and euros. discoverIE hedges with forward contracts to the extent that the exposure cannot be passed to the customer.
■
Pricing: discoverIE’s revenues and profitability are sensitive to the company’s ability to include within price quotes engineering time spent on designing customer solutions. The company aims to pass through supplier price increases and tariffs, with very few fixed-price contracts.
■
Acquisitions: the company is likely to make further acquisitions, which could add integration risk and will require funding.
Exhibit 18: Financial summary
£m |
2020 |
2021 |
2022 |
2023 |
2024 |
2025e |
2026e |
|||
Year end 31 March |
IFRS |
IFRS |
IFRS |
IFRS |
IFRS |
IFRS |
IFRS |
|||
PROFIT & LOSS |
||||||||||
Revenue |
|
|
297.9 |
302.8 |
379.2 |
448.9 |
437.0 |
431.9 |
444.7 |
|
EBITDA |
|
|
43.6 |
44.0 |
56.1 |
65.4 |
71.1 |
74.3 |
76.9 |
|
Normalised operating profit (before am, SBP and except.) |
31.6 |
31.9 |
44.8 |
54.3 |
59.5 |
61.9 |
64.6 |
|||
Underlying operating profit (before am. and except.) |
29.8 |
30.8 |
41.4 |
51.8 |
57.2 |
60.5 |
62.2 |
|||
Amortisation of acquired intangibles |
(9.0) |
(11.1) |
(14.0) |
(15.8) |
(16.2) |
(15.8) |
(16.0) |
|||
Exceptionals |
(4.3) |
(2.6) |
(6.5) |
(1.4) |
(9.8) |
(1.2) |
(2.0) |
|||
Share-based payments |
(1.8) |
(1.1) |
(3.4) |
(2.5) |
(2.3) |
(1.4) |
(2.4) |
|||
Operating Profit |
16.5 |
17.1 |
20.9 |
34.6 |
31.2 |
43.5 |
44.2 |
|||
Net Interest |
(4.3) |
(3.6) |
(3.8) |
(5.5) |
(9.0) |
(10.6) |
(9.8) |
|||
Profit Before Tax (norm) |
|
|
27.3 |
28.3 |
41.0 |
48.8 |
50.5 |
51.3 |
54.8 |
|
Profit Before Tax (FRS 3) |
|
|
12.2 |
13.5 |
17.1 |
29.1 |
22.2 |
32.9 |
34.4 |
|
Tax |
(3.3) |
(4.0) |
(7.4) |
(7.8) |
(6.7) |
(8.7) |
(9.0) |
|||
Profit After Tax (norm) |
21.8 |
21.6 |
30.8 |
36.1 |
37.9 |
37.8 |
40.4 |
|||
Profit After Tax (FRS 3) |
8.9 |
9.5 |
9.7 |
21.3 |
15.5 |
24.2 |
25.4 |
|||
Discontinued operations |
5.4 |
2.5 |
15.5 |
0.0 |
0.0 |
0.0 |
0.0 |
|||
Net income (norm) |
21.8 |
21.6 |
30.8 |
36.1 |
37.9 |
37.8 |
40.4 |
|||
Net income (FRS 3) |
14.3 |
12.0 |
25.2 |
21.3 |
15.5 |
24.2 |
25.4 |
|||
Ave. Number of Shares Outstanding (m) |
84.0 |
88.8 |
93.0 |
95.4 |
95.8 |
95.9 |
96.4 |
|||
EPS - normalised & diluted (p) |
|
|
25.1 |
23.4 |
32.1 |
36.7 |
38.5 |
38.4 |
40.8 |
|
EPS - underlying, diluted (p) |
|
|
24.4 |
22.4 |
29.4 |
35.2 |
36.8 |
37.3 |
39.0 |
|
EPS - IFRS basic (p) |
|
|
17.0 |
13.5 |
27.1 |
22.3 |
16.2 |
25.3 |
26.3 |
|
EPS - IFRS diluted (p) |
|
|
16.5 |
13.0 |
26.3 |
21.7 |
15.8 |
24.6 |
25.6 |
|
Dividend per share (p) |
2.97 |
10.15 |
10.80 |
11.45 |
12.00 |
12.50 |
13.00 |
|||
EBITDA Margin (%) |
14.6 |
14.5 |
14.8 |
14.6 |
16.3 |
17.2 |
17.3 |
|||
Normalised operating margin (before am, SBP and except.) (%) |
10.6 |
10.5 |
11.8 |
12.1 |
13.6 |
14.3 |
14.5 |
|||
discoverIE underlying operating margin (%) |
10.0 |
10.2 |
10.9 |
11.5 |
13.1 |
14.0 |
14.0 |
|||
BALANCE SHEET |
||||||||||
Fixed Assets |
|
|
236.4 |
244.6 |
326.5 |
335.9 |
381.0 |
366.9 |
355.7 |
|
Intangible Assets |
182.2 |
190.8 |
263.3 |
272.0 |
329.5 |
313.2 |
298.9 |
|||
Tangible Assets |
46.3 |
45.9 |
45.4 |
44.4 |
41.1 |
43.3 |
46.4 |
|||
Deferred tax assets |
7.9 |
7.9 |
17.8 |
19.5 |
10.4 |
10.4 |
10.4 |
|||
Current Assets |
|
|
197.4 |
183.6 |
266.2 |
249.8 |
287.7 |
292.6 |
310.1 |
|
Stocks |
68.4 |
67.7 |
77.8 |
90.0 |
80.1 |
89.3 |
92.0 |
|||
Debtors |
90.1 |
84.9 |
78.0 |
74.6 |
88.8 |
76.9 |
79.2 |
|||
Cash |
36.8 |
29.2 |
108.8 |
83.9 |
110.8 |
125.3 |
137.9 |
|||
Current Liabilities |
|
|
(103.6) |
(107.8) |
(190.3) |
(151.2) |
(185.4) |
(180.6) |
(183.2) |
|
Creditors |
(94.0) |
(102.2) |
(114.2) |
(107.3) |
(101.0) |
(96.2) |
(98.8) |
|||
Lease liabilities |
(5.3) |
(4.8) |
(4.7) |
(4.0) |
(5.7) |
(5.7) |
(5.7) |
|||
Short term borrowings |
(4.3) |
(0.8) |
(71.4) |
(39.9) |
(78.7) |
(78.7) |
(78.7) |
|||
Long Term Liabilities |
|
|
(129.7) |
(112.0) |
(112.0) |
(130.9) |
(181.7) |
(171.9) |
(161.5) |
|
Long term borrowings |
(93.8) |
(75.6) |
(67.6) |
(86.7) |
(136.1) |
(131.1) |
(126.1) |
|||
Lease liabilities |
(14.7) |
(16.7) |
(16.4) |
(14.8) |
(14.4) |
(14.4) |
(14.4) |
|||
Other long term liabilities |
(21.2) |
(19.7) |
(28.0) |
(29.4) |
(31.2) |
(26.4) |
(21.0) |
|||
Net Assets |
|
|
200.5 |
208.4 |
290.4 |
303.6 |
301.6 |
307.0 |
321.1 |
|
CASH FLOW |
||||||||||
Operating Cash Flow |
|
|
48.0 |
56.8 |
42.5 |
52.1 |
66.0 |
69.0 |
70.6 |
|
Net Interest |
(3.7) |
(3.1) |
(3.3) |
(4.8) |
(7.7) |
(10.1) |
(9.3) |
|||
Tax |
(6.4) |
(7.2) |
(7.1) |
(9.0) |
(12.5) |
(13.5) |
(14.4) |
|||
Capex |
(6.3) |
(3.9) |
(6.2) |
(5.6) |
(4.9) |
(7.5) |
(8.5) |
|||
Acquisitions/disposals |
(73.6) |
(20.5) |
(46.8) |
(25.1) |
(82.8) |
0.0 |
(2.0) |
|||
Financing |
53.9 |
(6.6) |
47.2 |
(7.5) |
(9.3) |
(6.6) |
(6.6) |
|||
Dividends |
(8.1) |
(2.8) |
(9.4) |
(10.5) |
(11.2) |
(11.7) |
(12.2) |
|||
Net Cash Flow |
3.8 |
12.7 |
16.9 |
(10.4) |
(62.4) |
19.6 |
17.6 |
|||
Opening net cash/(debt) |
|
|
(63.3) |
(61.3) |
(47.2) |
(30.2) |
(42.7) |
(104.0) |
(84.5) |
|
HP finance leases initiated |
0.0 |
0.0 |
0.0 |
0.0 |
0.0 |
0.0 |
0.0 |
|||
Other |
(1.8) |
1.4 |
0.1 |
(2.1) |
1.1 |
(0.0) |
(0.0) |
|||
Closing net cash/(debt) |
|
|
(61.3) |
(47.2) |
(30.2) |
(42.7) |
(104.0) |
(84.5) |
(66.9) |
|
Source: discoverIE, Edison Investment Research
|
|||||||||||||||||||||||||||||||||||||||||||||
|
|
Research: Consumer
Games Workshop Group (GAW) has reached a final agreement with Amazon to adapt the Warhammer 40K universe into films and television series, with associated merchandising rights. The aim of the exclusive agreement is to initially place GAW’s Warhammer 40K intellectual property into new markets and to a wider audience, which naturally should generate incremental new revenue, with the hope the content encourages more people to take up the hobby and benefit the core business. By definition, the content production cycle for film and television series is long and ‘may take a number of years’ to benefit GAW’s results so is unlikely to benefit near-term estimates.