Last close As at 05/08/2026
GBP8.32
▲ 9.00 (1.09%)
Market capitalisation
GBP802m
Research: TMT
discoverIE’s first capital markets day (CMD) in six years was an opportunity for the group to recap how via its buy-and-build strategy it has successfully grown the company from a market cap of £25m in 2009 to £592m today, while transforming the business from an electronics distributor to a pure-play specialist electronics design and manufacture company. Management also outlined how it expects to drive future growth and profitability. New at the CMD was the announcement of an additional target market, security. As the group has matured, it has put in place structures and processes to maximise revenue opportunities and optimise profitability and cash flow, while retaining the group’s essential DNA.
discoverIE Group |
Moving into the next growth phase |
Capital markets day |
Electrical components |
18 September 2024 |
Share price performance
Business description
Next events
Analyst
discoverIE Group is a research client of Edison Investment Research Limited |
|||||||||||||||||||||||||||||||||||||||||||||
discoverIE’s first capital markets day (CMD) in six years was an opportunity for the group to recap how via its buy-and-build strategy it has successfully grown the company from a market cap of £25m in 2009 to £592m today, while transforming the business from an electronics distributor to a pure-play specialist electronics design and manufacture company. Management also outlined how it expects to drive future growth and profitability. New at the CMD was the announcement of an additional target market, security. As the group has matured, it has put in place structures and processes to maximise revenue opportunities and optimise profitability and cash flow, while retaining the group’s essential DNA.
Year |
Revenue |
PBT* |
Diluted EPS* |
DPS |
P/E |
Yield |
03/23 |
448.9 |
46.3 |
35.2 |
11.45 |
17.5 |
1.9 |
03/24 |
437.0 |
48.2 |
36.8 |
12.00 |
16.7 |
2.0 |
03/25e |
453.1 |
49.9 |
37.3 |
12.50 |
16.5 |
2.0 |
03/26e |
466.7 |
52.4 |
39.0 |
13.00 |
15.7 |
2.1 |
Note: *PBT and EPS as per discoverIE’s underlying metric (excludes amortisation of acquired intangibles and exceptional items).
Optimising organic growth and profitability
Management outlined how it expects to continue generating organic revenue growth ahead of GDP and showed that nearly half of operating margin expansion since FY18 has been from operational efficiencies, including optimising its manufacturing footprint. With an increased focus on collaboration, management is aiming to fully exploit the potential of the group through an increased level of cross-selling, operational efficiencies and technical collaboration.
Expect more M&A
The group was built through the 27 acquisitions made since 2011, with a decentralised business model that aims to retain the entrepreneurial mindset of business managers. The dedicated M&A team has an active pipeline of more than 250 targets and expects to continue consolidating the $30bn fragmented custom electronics market. As the group becomes more cash generative, this should help to fund more acquisitions while keeping gearing below 2x.
Valuation: Order growth to trigger upside
The stock trades at a 27% discount to its broader UK industrial technology peer group on FY25e P/E and at a larger discount to peers with a similar decentralised operating model (such as Halma and Spirax). Considering that the earnings outlook has been maintained and discoverIE continues to make excellent progress towards its margin targets, we believe this discount is overdone. The company has shown that focusing on strategic growth markets reduces cyclicality compared to the wider market and recent design win activity provides the foundations for revenue growth once larger industrial customers’ de-stocking is complete.
Capital markets day review
On 11 September, discoverIE hosted its first capital markets day in six years. Management took the opportunity to review the group’s performance since it entered the design and manufacturing market in 2011, revisit the group’s strategy and explain how it continues to execute on this. It also provided the opportunity for participants to see a variety of its bespoke-made products and meet the management of individual businesses.
Strategy recap: Evolution not revolution
discoverIE’s strategy has been broadly unchanged for many years, with net zero targets a more recent addition. The company aims to:
■
grow sales well ahead of GDP over the economic cycle by focusing on structural growth markets;
■
acquire highly differentiated businesses, with attractive growth prospects and strong operating margins;
■
improve operating margins by moving up the value chain into higher-margin products and generate strong cash flows from a capital-light model;
■
further internationalise the business by expanding operations in North America and Asia; and
■
reach net zero.
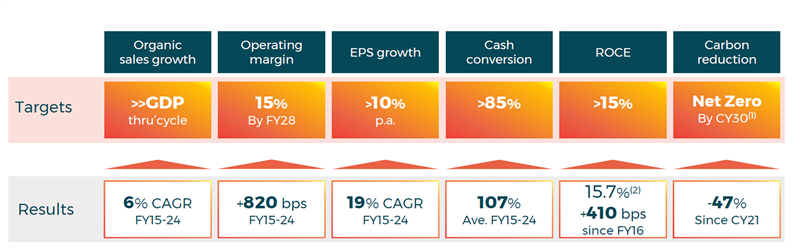
Its successful buy-and-build strategy has resulted in strong revenue growth and margin expansion, driving earnings at a CAGR of 19% between FY15 and FY24.
|
Exhibit 1: Financial performance from FY15 to FY24 |
|
|
Source: discoverIE. Note: (1) Scope 1 and 2 only. (2) ROCE in FY24. |
Medium-term targets – a reminder
Exhibit 2 shows the company’s medium-term targets. It also estimates the potential growth in EPS based on different levels of organic revenue growth combined with varying levels of acquisition spend. For comparison, over the last five years, the company spent £288m on acquisitions, generated an organic revenue CAGR of 7% and EPS growth of 94% (CAGR 14%).
|
Exhibit 2: Medium-term growth plans |
|
|
Source: discoverIE |
With the group having achieved so much since the design and manufacturing strategy was launched more than 10 years ago, the question now is how this performance can be maintained over the next 10 years. The rest of the CMD was focused on explaining how management intends to maintain growth and drive profitability. This splits broadly into two areas: organic operational management and acquisition strategy.
Optimising organic performance
discoverIE operates a decentralised business model. The group splits its businesses into two divisions: Sensing & Connectivity (S&C) and Magnetics & Controls (M&C). Where appropriate, the company groups similar businesses together in clusters to achieve optimum benefits. Exhibits 3 and 4 show the constituents of each division and cluster.
|
Exhibit 3: Sensing & Connectivity |
Exhibit 4: Magnetics & Controls |
|
|
|
Source: discoverIE |
|
Exhibit 3: Sensing & Connectivity |
|
|
Source: discoverIE |
|
Exhibit 4: Magnetics & Controls |
|
|
Source: discoverIE |
Management discussed how it drives growth and profitability across the following four areas:
Product innovation – customer-driven
The company spends c 2% of revenue on R&D each year, with the focus on product development rather than research. Sales led by engineers with detailed knowledge of applications and design results in a unique understanding of customers’ needs. Solutions are then based on custom designs or engineered standard products to meet specific customer needs.
Commercial focus – targeting faster-growing markets
The group recorded a CAGR for organic revenue of 6% over the last 10 years and 7% over the last seven years. Revenue growth depends on two factors – the number of design wins and end market demand. The chart below shows the trend in revenue versus the estimated annual value of design wins. They tend to move in sync apart from during periods of stocking up and de-stocking (customers are currently in a de-stocking phase). The company has recently reported strong design win activity and noted that some of its largest de-stocking customers have recently awarded the company multiple design wins, which bodes well for future revenue growth.
|
Exhibit 5: Revenue and design win estimate annual value (EAV) |
|
|
Source: discoverIE. Note: (1) EAV at peak demand. EAV scale removed as commercially sensitive. |
End market demand is highly dependent on the verticals that the company supplies. As we have written before, the company’s target markets are renewable energy, transportation, industrial & connectivity and medical, and these made up 75% of FY24 revenue and 90% of FY24 design wins. These markets have been selected for their potential to grow ahead of GDP – revenue from target markets grew at a CAGR of 7% over the last seven years. At the CMD, the company announced that it had added a fifth target market – security – which covers areas such as access control, detection systems, surveillance systems, and aeronautics, space and defence. This market currently makes up c 9% of group sales (up from 2% in FY21), of which defence makes up 2%. Around half of security sales were previously reported in the transportation segment and the remainder in ‘other’. Examples of designs won in this segment include access control for datacentre cabinets and an X-ray detection and high-speed image processing unit for airport security.
Efficiencies: Pricing, manufacturing, operations
The group is able to price its solutions for value rather than on a cost-plus basis because of its differentiated products, ability to provide design support and bespoke solutions, and its ability to work to urgent timescales.
Many acquired businesses bring their own manufacturing facilities to the group. In recent years, the company has reduced the number of sites in similar locations (eg reducing from three to one site in Mexico) and developed shared production capacity in certain geographies, resulting in annual savings of c £4m. It has also relocated production, for example, from the UK and Western Europe to Hungary, resulting in lower labour costs, volume efficiencies and in some cases moving production closer to the customer. This has generated c £2.3m in annual cost savings.
The chart below shows how the group has increased operating profitability from FY18 to FY24. Improvements to the organic business were almost as big as the contribution from M&A (acquisition of higher-margin companies plus the benefit from selling lower-margin businesses). The company has a margin target of 15% by FY28 and expects to achieve this roughly 50/50 through organic development and acquisitions. We expect further operational efficiencies to be achieved through the collaboration programmes described in the next section.
|
Exhibit 6: Operating margin progress, FY18–24 |
|
|
Source: discoverIE |
Collaboration – increasingly important as the group grows
This is an area that has recently been given more focus – while the creation of clusters has helped increase collaboration within a division, the group is keen to exploit synergies across the entire group. Neale Sutton, previously managing director of Cursor Controls, was appointed group development director in January 2023 and is responsible for identifying and developing technological and commercial synergy opportunities across the group. These fall into three broad areas:
■
Sales synergies: cross-selling and upselling (within clusters, within divisions and across divisions), customer and channel partner introductions, and joining forces at exhibitions.
■
Operational leverage: making use of certifications and accreditations across the group, leveraging operational capabilities (eg sharing best practice), leveraging supply chain efficiencies and making use of the global manufacturing footprint (eg intercompany production, in some cases in-sourcing production where this makes commercial sense).
■
Technical collaborations: combining engineering expertise, technologies and IP; supporting product innovation.
Acquisition strategy
Management has had the same approach to M&A since it made its first design and manufacturing acquisition (Hectronic) in 2011. It looks for the following in an acquisition target:
■
designs and manufactures electronic components, modules or systems;
■
products and solutions are differentiated;
■
supplies original equipment manufacturers (OEMs);
■
has long-life products with recurring revenues;
■
operates in growing markets with excellent growth prospects;
■
has strong cash generation and is capital-light; and
■
has ambitious, capable management with entrepreneurial spirit.
Acquisitions will either be bolt-ons, with attractive synergy potential, or platforms, which bring new capabilities and additional scale and have the potential to create a cluster. The company has no interest in buying companies that need restructuring or turning around.
From a valuation perspective, the group is disciplined, turning deals down if the pricing is too high. The price paid will reflect growth track record and potential, margins, scale and potential synergies. The charts below show the spread of EV/EBIT multiples paid and the average EBIT margins acquired each year since FY14, demonstrating how the company has sought out higher-margin companies since FY19.
|
Exhibit 7: Acquisition deal values and margins |
|
|
Source: discoverIE. Note: (1) Multiples based on initial consideration excluding deal costs. |
Integration-lite strategy
As described above, the group operates a decentralised business model. When a business is acquired, if appropriate it joins a cluster. It usually retains its own brand and management team and continues to operate as a standalone business. The main areas that the group will get involved in include:
■
jointly devising a growth plan, including attractive incentives; and
■
putting in place reporting, control and governance structures.
The business can take advantage of group services such as IT and, in the longer term, could make use of manufacturing facilities elsewhere in the group. This light-touch approach means that an acquired business can be integrated quickly with little disruption to operations. It is also an attractive selling point for potential targets as founders can feel confident that the business they have built up over years will not be subsumed into a larger entity but will continue to thrive as an independent business.
Once acquired, the business will be expected to take part in the collaboration efforts described above, to optimise revenue synergies, scale up efficiently and drive operational improvements in areas such as working capital and manufacturing.
Fragmented market continues to provide opportunities
Despite having made 27 acquisitions since 2011, management is confident that a wealth of acquisition targets remain in what is a very fragmented market, with many founder-run businesses operating in limited geographies. It estimates that its addressable market is worth c $30bn (a sub-set of the $300bn non-semiconductor electronics market). Currently, it has a market share of c 2% with ample room to grow this.
Exhibit 8: Financial summary
£m |
2020 |
2021 |
2022 |
2023 |
2024 |
2025e |
2026e |
||
Year end 31 March |
IFRS |
IFRS |
IFRS |
IFRS |
IFRS |
IFRS |
IFRS |
||
PROFIT & LOSS |
|||||||||
Revenue |
|
|
297.9 |
302.8 |
379.2 |
448.9 |
437.0 |
453.1 |
466.7 |
EBITDA |
|
|
43.6 |
44.0 |
56.1 |
65.4 |
71.1 |
75.1 |
77.6 |
Normalised operating Profit (before am, SBP and except.) |
31.6 |
31.9 |
44.8 |
54.3 |
59.5 |
63.4 |
65.8 |
||
Underlying operating Profit (before am. and except.) |
29.8 |
30.8 |
41.4 |
51.8 |
57.2 |
61.0 |
63.4 |
||
Amortisation of acquired intangibles |
(9.0) |
(11.1) |
(14.0) |
(15.8) |
(16.2) |
(17.0) |
(17.0) |
||
Exceptionals |
(4.3) |
(2.6) |
(6.5) |
(1.4) |
(9.8) |
(3.0) |
(3.0) |
||
Share-based payments |
(1.8) |
(1.1) |
(3.4) |
(2.5) |
(2.3) |
(2.4) |
(2.4) |
||
Operating Profit |
16.5 |
17.1 |
20.9 |
34.6 |
31.2 |
41.0 |
43.4 |
||
Net Interest |
(4.3) |
(3.6) |
(3.8) |
(5.5) |
(9.0) |
(11.1) |
(11.0) |
||
Profit Before Tax (norm) |
|
|
27.3 |
28.3 |
41.0 |
48.8 |
50.5 |
52.3 |
54.8 |
Profit Before Tax (FRS 3) |
|
|
12.2 |
13.5 |
17.1 |
29.1 |
22.2 |
29.9 |
32.4 |
Tax |
(3.3) |
(4.0) |
(7.4) |
(7.8) |
(6.7) |
(7.9) |
(8.5) |
||
Profit After Tax (norm) |
21.8 |
21.6 |
30.8 |
36.1 |
37.9 |
38.5 |
40.4 |
||
Profit After Tax (FRS 3) |
8.9 |
9.5 |
9.7 |
21.3 |
15.5 |
22.0 |
23.9 |
||
Discontinued operations |
5.4 |
2.5 |
15.5 |
0.0 |
0.0 |
0.0 |
0.0 |
||
Net income (norm) |
21.8 |
21.6 |
30.8 |
36.1 |
37.9 |
38.5 |
40.4 |
||
Net income (FRS 3) |
14.3 |
12.0 |
25.2 |
21.3 |
15.5 |
22.0 |
23.9 |
||
Ave. Number of Shares Outstanding (m) |
84.0 |
88.8 |
93.0 |
95.4 |
95.8 |
95.9 |
96.4 |
||
EPS - normalised & diluted (p) |
|
|
25.1 |
23.4 |
32.1 |
36.7 |
38.5 |
39.1 |
40.8 |
EPS - underlying, diluted (p) |
|
|
24.4 |
22.4 |
29.4 |
35.2 |
36.8 |
37.3 |
39.0 |
EPS - IFRS basic (p) |
|
|
17.0 |
13.5 |
27.1 |
22.3 |
16.2 |
22.9 |
24.8 |
EPS - IFRS diluted (p) |
|
|
16.5 |
13.0 |
26.3 |
21.7 |
15.8 |
22.3 |
24.1 |
Dividend per share (p) |
2.97 |
10.15 |
10.80 |
11.45 |
12.00 |
12.50 |
13.00 |
||
EBITDA Margin (%) |
14.6 |
14.5 |
14.8 |
14.6 |
16.3 |
16.6 |
16.6 |
||
Normalised operating margin (before am, SBP and except.) (%) |
10.6 |
10.5 |
11.8 |
12.1 |
13.6 |
14.0 |
14.1 |
||
discoverIE underlying operating margin (%) |
10.0 |
10.2 |
10.9 |
11.5 |
13.1 |
13.5 |
13.6 |
||
BALANCE SHEET |
|||||||||
Fixed Assets |
|
|
236.4 |
244.6 |
326.5 |
335.9 |
381.0 |
363.1 |
352.4 |
Intangible Assets |
182.2 |
190.8 |
263.3 |
272.0 |
329.5 |
307.7 |
292.9 |
||
Tangible Assets |
46.3 |
45.9 |
45.4 |
44.4 |
41.1 |
45.0 |
49.1 |
||
Deferred tax assets |
7.9 |
7.9 |
17.8 |
19.5 |
10.4 |
10.4 |
10.4 |
||
Current Assets |
|
|
197.4 |
183.6 |
266.2 |
249.8 |
287.7 |
298.0 |
313.2 |
Stocks |
68.4 |
67.7 |
77.8 |
90.0 |
80.1 |
94.8 |
97.7 |
||
Debtors |
90.1 |
84.9 |
78.0 |
74.6 |
88.8 |
81.4 |
83.8 |
||
Cash |
36.8 |
29.2 |
108.8 |
83.9 |
110.8 |
120.8 |
130.7 |
||
Current Liabilities |
|
|
(103.6) |
(107.8) |
(190.3) |
(151.2) |
(185.4) |
(184.6) |
(187.3) |
Creditors |
(94.0) |
(102.2) |
(114.2) |
(107.3) |
(101.0) |
(100.2) |
(102.9) |
||
Lease liabilities |
(5.3) |
(4.8) |
(4.7) |
(4.0) |
(5.7) |
(5.7) |
(5.7) |
||
Short term borrowings |
(4.3) |
(0.8) |
(71.4) |
(39.9) |
(78.7) |
(78.7) |
(78.7) |
||
Long Term Liabilities |
|
|
(129.7) |
(112.0) |
(112.0) |
(130.9) |
(181.7) |
(170.8) |
(159.9) |
Long term borrowings |
(93.8) |
(75.6) |
(67.6) |
(86.7) |
(136.1) |
(131.1) |
(126.1) |
||
Lease liabilities |
(14.7) |
(16.7) |
(16.4) |
(14.8) |
(14.4) |
(14.4) |
(14.4) |
||
Other long term liabilities |
(21.2) |
(19.7) |
(28.0) |
(29.4) |
(31.2) |
(25.3) |
(19.4) |
||
Net Assets |
|
|
200.5 |
208.4 |
290.4 |
303.6 |
301.6 |
305.7 |
318.4 |
CASH FLOW |
|||||||||
Operating Cash Flow |
|
|
48.0 |
56.8 |
42.5 |
52.1 |
66.0 |
61.9 |
70.1 |
Net Interest |
(3.7) |
(3.1) |
(3.3) |
(4.8) |
(7.7) |
(10.6) |
(10.5) |
||
Tax |
(6.4) |
(7.2) |
(7.1) |
(9.0) |
(12.5) |
(13.7) |
(14.4) |
||
Capex |
(6.3) |
(3.9) |
(6.2) |
(5.6) |
(4.9) |
(9.2) |
(9.5) |
||
Acquisitions/disposals |
(73.6) |
(20.5) |
(46.8) |
(25.1) |
(82.8) |
5.0 |
(2.0) |
||
Financing |
53.9 |
(6.6) |
47.2 |
(7.5) |
(9.3) |
(6.6) |
(6.6) |
||
Dividends |
(8.1) |
(2.8) |
(9.4) |
(10.5) |
(11.2) |
(11.7) |
(12.2) |
||
Net Cash Flow |
3.8 |
12.7 |
16.9 |
(10.4) |
(62.4) |
15.0 |
14.9 |
||
Opening net cash/(debt) |
|
|
(63.3) |
(61.3) |
(47.2) |
(30.2) |
(42.7) |
(104.0) |
(89.0) |
HP finance leases initiated |
0.0 |
0.0 |
0.0 |
0.0 |
0.0 |
0.0 |
0.0 |
||
Other |
(1.8) |
1.4 |
0.1 |
(2.1) |
1.1 |
(0.0) |
0.0 |
||
Closing net cash/(debt) |
|
|
(61.3) |
(47.2) |
(30.2) |
(42.7) |
(104.0) |
(89.0) |
(74.1) |
Source: discoverIE, Edison Investment Research
|
|
Research: Real Estate
Triple Point Social Housing REIT (SOHO) returned to full dividend cover in H124, with EPRA earnings benefiting from inflation-linked, mostly uncapped rental growth and improving rent collection. Property valuations and NAV per share were lower, but progress with the two problem tenants and falling interest rates suggest this could reverse. Meanwhile, the shares yield more than 8% with the board targeting asset sales and share repurchases to address the discount to NAV.