Last close As at 05/08/2026
—
— 0.00 (0.00%)
Market capitalisation
—
Research: Investment Companies
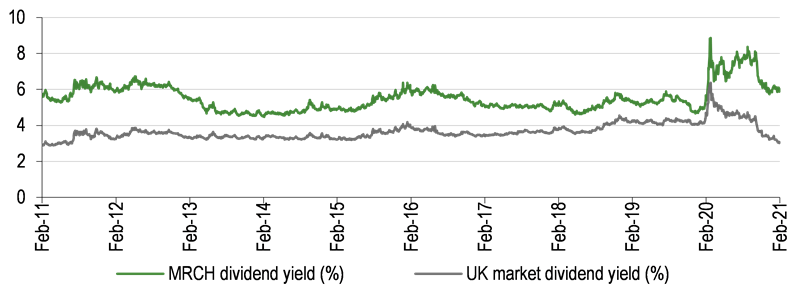
The Merchants Trust (MRCH) is managed by Simon Gergel at Allianz Global Investors. He suggests the company is ‘in a much better place’ compared with early 2020. The manager now has more confidence in the trust’s income prospects as dividends are resuming and in some cases being raised, and he has been able to take advantage of stock market volatility to reposition the portfolio. Gergel believes MRCH’s shareholders appreciate how the trust’s investment process remains consistent despite periods of market volatility, while the board’s progressive dividend policy provides an attractive income stream in excess of the UK market. This is reflected in MRCH’s relative performance, which has improved considerably in recent months. The trust currently offers a 5.5% dividend yield, the second highest of the 17 larger-cap peers in the AIC UK Equity Income sector.
The Merchants Trust |
Meaningful improvement in relative performance |
Investment trusts |
18 March 2021 |
Analysts
|
||||||||||||||||||||||||||||||||||||||||||||||||||||||||||||
The Merchants Trust (MRCH) is managed by Simon Gergel at Allianz Global Investors. He suggests the company is ‘in a much better place’ compared with early 2020. The manager now has more confidence in the trust’s income prospects as dividends are resuming and in some cases being raised, and he has been able to take advantage of stock market volatility to reposition the portfolio. Gergel believes MRCH’s shareholders appreciate how the trust’s investment process remains consistent despite periods of market volatility, while the board’s progressive dividend policy provides an attractive income stream in excess of the UK market. This is reflected in MRCH’s relative performance, which has improved considerably in recent months. The trust currently offers a 5.5% dividend yield, the second highest of the 17 larger-cap peers in the AIC UK Equity Income sector.
|
MRCH offers an attractive above-market dividend yield |
|
|
Source: MRCH, Edison Investment Research |
Why consider MRCH now?
The UK economy is recovering from the negative effects of the global COVID-19 pandemic and there is likely to be significant pent-up demand once lockdowns end. Brexit has been an overhang to the valuation of the UK market since mid-2016, offering the potential for a rerating as business conditions improve.
The analyst’s view
MRCH offers shareholders a diversified portfolio of attractively valued UK shares across the market-cap spectrum and an above-market dividend yield. There has been a significant uplift in the trust’s relative performance now the stock market leadership has started to broaden out, although there is still a wide divergence between the valuation of growth and more cyclical businesses. MRCH’s NAV has now outperformed the broad UK market over the last one, three, five and 10 years.
The trust is in an improved position regarding income than it was six to nine months ago as exposure to higher-yielding companies has increased, more firms are considering paying a dividend now their balance sheets have been repaired, and the manager expects a significant income recovery in FY22 (ending 31 January 2022). At the end of FY20, the trust had more than one year’s annual dividend in revenue reserves, which is available to sustain MRCH’s 38-year record of consecutive annual dividend increases.
The manager’s view: Opportunities for UK investors
Manager Gergel says it is ‘an interesting time to be investing in the UK and I am quite excited about what I see in the market’ as the economy is improving and dividends are returning rapidly as businesses recover. In terms of valuation, the UK remains at a multi-decade extreme discount compared with Europe, having been devalued since mid-2016 due to the Brexit overhang, although this risk has now receded. The manager explains the UK is more oriented towards cyclical businesses, with large exposures to the banking, mining and energy sectors. There is potential for higher levels of merger and acquisition activity given low valuations and interest rates, and appetite from both corporate and private equity buyers, which could be supportive for the equity market. Recent bids include for Aggreko, RSA (which was in MRCH’s portfolio) and Signature Aviation.
In the last few quarters, there has been significant polarisation in the market between the performance of growth and value stocks and, while the gap has started to close, there is still a large divergence between the valuation of growth and value stocks. Gergel highlights the relative value within MRCH’s portfolio, which has an average forward P/E multiple of 11.4x and is a c 30% discount to the broad UK market. The fund has little exposure to highly priced segments of the market (c 2% of the portfolio is valued above 20x compared with c 20% of the UK market).
While the manager is constructive on the outlook for the UK, he is also mindful of the risks. If the economy recovers, there is an overhang from the very high government debt levels, ‘these borrowings have to be paid for’. Gergel suggests the outlook for inflation is ‘an interesting discussion’ and, given pent-up demand, he expects higher bond yields and interest rates over time. ‘Activity could be choked off by these, although it is encouraging that the economy is now strengthening’, he adds.
The manager comments he is ‘not buying low-quality companies, we are able to buy decent businesses at attractive valuations’. While stocks are all selected on a bottom-up basis, there are a number of themes represented within the portfolio; three of which are discussed below.
Home economics: strong fundamentals in housing and renovation, maintenance & improvement. Gergel says many people have been able to save money during the pandemic, by not spending on holidays, commuting or eating out. There has been a strong recovery in the housebuilding sector and companies such as DFS (sofas) and Tyman (door and window components) have delivered robust trading results, which are now exceeding pre-pandemic levels. Spending on the home has generally been soft for a number of years, as house-move volumes have been low; but there is now pent-up demand and activity is expected to pick up.
Digital winners: on the right side of structural change. IG Group is a market leader in financial trading, targeting experienced individuals, the manager explains that its volumes have been strong helped by stock market volatility and people are generally taking more of an interest in their personal affairs. The company has a modest valuation coupled with a high return on equity as there are concerns about regulatory risk and moderating growth as stock market volatility returns to more normal levels (IG Group’s 2022 consensus earnings expectations are below those for 2021). However, the manager says the company has a huge client base and has been expanding into new product areas and territories such as Asia; he believes the market does not appreciate the company’s sustainable growth prospects. Entain (formerly GVC Holdings, sports betting and gambling) is benefiting from growth in online betting and deregulation in the US, which is allowing more states to participate in these activities. The company is now the third largest online operator in the US via its JV with MGM Resorts International. Gergel comments there are ‘ways to invest in digital winners, while avoiding the expensive stocks in the market’.
Improving business mix: underappreciated transformation. Tate & Lyle refines corn into high-fructose corn syrup, which is used in fizzy drinks. This is a commodity business, but the company also has speciality operations where fats and sugars can be replaced by more healthy natural products. Tate & Lyle’s current business mix is c 50:50 between commodity and speciality operations. As the percentage of speciality revenues rises, helped by acquisitions, the valuation of Tate & Lyle should improve as pure-play competitors such as Switzerland-based Givaudan and US-based International Flavors & Fragrances trade on higher multiples.
Portfolio construction and activity
Exhibit 1: Portfolio sector exposure vs benchmark (% unless stated)
Portfolio end- |
Portfolio end- |
Change |
Index |
Active weight |
Trust weight/ |
|
Consumer goods |
23.1 |
15.8 |
7.3 |
16.8 |
6.3 |
1.4 |
Financials |
20.5 |
25.5 |
(5.0) |
25.5 |
(5.0) |
0.8 |
Industrials |
18.3 |
20.9 |
(2.6) |
12.7 |
5.6 |
1.4 |
Oil & gas |
8.7 |
7.7 |
1.0 |
7.5 |
1.2 |
1.2 |
Utilities |
7.3 |
8.2 |
(0.9) |
3.1 |
4.3 |
2.4 |
Consumer services |
6.4 |
11.7 |
(5.3) |
12.5 |
(6.1) |
0.5 |
Healthcare |
5.8 |
5.7 |
0.1 |
9.3 |
(3.5) |
0.6 |
Telecommunications |
4.4 |
0.0 |
4.4 |
2.2 |
2.2 |
2.0 |
Basic materials |
2.9 |
4.0 |
(1.1) |
9.3 |
(6.4) |
0.3 |
Technology |
1.1 |
0.0 |
1.1 |
1.1 |
(0.0) |
1.0 |
Cash |
1.5 |
0.5 |
1.0 |
0.0 |
1.5 |
N/A |
100.0 |
100.0 |
100.0 |
Source: The Merchants Trust, Edison Investment Research. Note: Numbers subject to rounding.
MRCH’s sector exposure is shown in Exhibit 1. Over the 12 months to the end of January 2021, the largest changes were a higher weighting to consumer goods (+7.3pp) and lower weightings to consumer services (-5.3pp) and financials (-5.0pp). While all stocks are selected on a bottom-up basis, compared with the index, the trust favours consumer goods (+6.3pp), industrials (+5.6pp) and utilities (+4.3pp). The largest underweight positions were basic materials (-6.4pp), consumer services (-6.1pp) and financials (-5.0pp).
Gergel explains that in 2020 there were broadly three phases of portfolio activity. Going into the year, MRCH’s portfolio had a relatively high level of cyclical exposure so he increased the fund’s weighting in more defensive businesses and companies with dependable income, including Vodafone. He sold positions in businesses he considered fully valued such as Prudential and Sirius Real Estate. The second phase was to take advantage of market volatility, by buying high-quality companies on reasonable valuations, such as Next and Close Brothers, which was funded by the sale of NatWest. Pennon was also sold as it became fully valued. As the market rallied towards the end of the year, lower-conviction cyclical positions that had recovered strongly were sold including National Express and Senior. A number of positions were added to including Entain, IG Group, National Grid and Meggitt (where the manager expects dividend payments to resume).
In December 2020, Gergel participated in the initial public offering of Conduit Holdings, a new reinsurance company, established in Bermuda and listed in the UK, which has been set up to take advantage of a cyclical upturn in insurance pricing. This follows three years of large losses in the insurance industry, which has led to capacity constraints among insurers and sharply rising insurance rates. Conduit offers a mid-single-digit dividend yield. In February 2021, the manager initiated a position in DCC, a distribution business with a strong record of growth through consolidating fragmented markets, initially in Ireland and the UK, which now operates in the rest of Europe and the US. DCC has grown its dividend for 26 years, with 9% compound annual growth over the last decade. The company’s businesses span four areas: healthcare, technology, liquefied petroleum gas, and fuel and oil. Its shares historically traded on a high valuation, but de-rated in recent months, on concerns about the long-term prospects for its energy businesses, which Gergel believes are unfounded, and as the market rotated towards more cyclical companies trading on lower multiples.
Performance: MRCH has made up 2020’s lost ground
Exhibit 2: Five-year discrete performance data
12 months ending |
Share price |
NAV* |
Blended benchmark **(%) |
CBOE UK All companies (%) |
CBOE UK 100 Companies (%) |
28/02/17 |
23.1 |
19.1 |
24.3 |
22.8 |
24.1 |
28/02/18 |
5.5 |
6.5 |
4.4 |
4.4 |
3.4 |
28/02/19 |
6.7 |
1.4 |
1.7 |
1.7 |
2.1 |
29/02/20 |
4.3 |
1.6 |
(1.4) |
(1.4) |
(2.7) |
28/02/21 |
2.1 |
5.1 |
2.8 |
2.8 |
6.9 |
Source: Refinitiv. Note: All % on a total return basis in pounds sterling. *NAV with debt at market value. **Blended benchmark is UK 100 Index until 31 January 2017 and UK All-Share Index thereafter.
|
Exhibit 3: Investment trust performance to 28 February 2020 |
||
Price, NAV and benchmark total return performance, one-year rebased |
Price, NAV and benchmark total return performance (%) |
|
|
|
|
|
Source: Refinitiv, Edison Investment Research. Note: Three, five and 10-year performance figures annualised. |
||
|
Exhibit 4: NAV total return performance relative to the benchmark over three years |
||
|
||
|
Source: Refinitiv, Edison Investment Research |
||
MRCH’s relative returns are shown below in Exhibit 5. The sharp improvement in relative NAV total return performance over the last six months means the trust’s NAV is ahead of its blended benchmark over all periods show, Gergel comments that ‘performance in recent months is pleasing following on from the majority of 2020, where there was a lot of pressure on the value style’. He took advantage of opportunities arising as a result of stock market volatility and ‘the results have come through really well’. The manager says that all of the NAV and share price underperformance in early 2020 has be recouped and, while the last five years have been difficult for value investors, ‘MRCH has delivered a decent set of numbers’. He says the improvement in relative performance in recent months is evidence of the fund’s significant value bias. Gergel does not believe that opportunities within the UK market have been exhausted, as there are still many companies that are highly valued; he suggests they could come under pressure due to profit taking, which could result in attractive entry points for new investments.
|
Exhibit 5: Share price and NAV total return performance, relative to indices (%) |
|||||||
|
One month |
Three months |
Six months |
One year |
Three years |
Five years |
10 years |
Price relative to blended benchmark |
2.0 |
4.4 |
18.1 |
(0.6) |
10.3 |
10.5 |
17.9 |
NAV relative to blended benchmark |
2.2 |
6.6 |
15.6 |
2.3 |
5.1 |
2.7 |
15.9 |
Price relative to CBOE UK All Companies |
2.0 |
4.4 |
18.1 |
(0.6) |
10.3 |
11.8 |
13.6 |
NAV relative to CBOE UK All Companies |
2.2 |
6.6 |
15.6 |
2.3 |
5.1 |
3.9 |
11.7 |
Price relative to CBOE UK 100 |
2.6 |
5.8 |
20.4 |
(4.5) |
6.9 |
8.2 |
15.5 |
NAV relative to CBOE UK 100 |
2.8 |
8.0 |
17.9 |
(1.7) |
1.8 |
0.6 |
13.5 |
|
Source: Refinitiv, Edison Investment Research. Note: Data to end-February 2021. Geometric calculation. |
|||||||
Peer group comparison
MRCH is a member of the AIC UK Equity Income. In Exhibit 6, we show the 17 of the 23 funds that have market caps above £100m. MRCH’s NAV total return is above the selected group average over one, three and five years, ranking second, sixth and seventh respectively, while its total return is below average over the last decade, ranking 11th. The trust’s NAV total returns rank favourably versus other value strategy funds such as Edinburgh Investment and Temple Bar over the last three and five years, both of which have changed their managers. Due to high levels of investor demand, MRCH regularly trades at a premium and has been issuing shares. On 17 March, the trust was trading at a 0.5% premium compared with an average valuation of the selected peer group of a 2.6% discount. MRCH has the third-highest level of gearing and an attractive dividend yield, ranking second and 1.4pp above the mean of the selected peer group.
Exhibit 6: Selected peer group as at 17 March 2021*
% unless stated |
Market |
NAV TR |
NAV TR |
NAV TR |
NAV TR |
Discount |
Ongoing charge |
Perf. |
Net gearing |
Dividend yield |
Merchants Trust |
600.1 |
64.4 |
17.6 |
46.9 |
117.6 |
0.5 |
0.6 |
No |
117 |
5.5 |
Aberdeen Standard Equity Inc Trust |
162.4 |
45.5 |
(9.8) |
5.0 |
86.1 |
(5.5) |
0.9 |
No |
111 |
6.2 |
BMO Capital & Income |
321.1 |
46.6 |
12.0 |
49.0 |
121.0 |
(2.8) |
0.6 |
No |
105 |
3.9 |
BMO UK High Income Units |
115.7 |
48.6 |
11.5 |
33.0 |
95.8 |
(9.0) |
1.0 |
No |
108 |
4.3 |
City of London |
1,623.6 |
35.6 |
6.5 |
24.4 |
114.4 |
3.0 |
0.4 |
No |
108 |
5.1 |
Diverse Income Trust |
393.8 |
57.1 |
23.3 |
47.7 |
|
(1.3) |
1.1 |
No |
100 |
3.3 |
Dunedin Income Growth |
438.6 |
47.1 |
28.3 |
59.2 |
124.4 |
(2.3) |
0.6 |
No |
109 |
4.3 |
Edinburgh Investment |
1,005.5 |
52.1 |
3.5 |
12.2 |
126.2 |
(7.8) |
0.6 |
No |
106 |
4.1 |
Finsbury Growth & Income |
1,927.8 |
30.0 |
23.4 |
60.5 |
253.6 |
(0.4) |
0.6 |
No |
101 |
1.9 |
Invesco Income Growth |
160.5 |
35.6 |
10.0 |
23.9 |
119.5 |
(6.7) |
0.7 |
No |
107 |
4.3 |
JPMorgan Claverhouse |
384.5 |
50.7 |
11.8 |
44.3 |
119.1 |
(4.5) |
0.7 |
No |
118 |
4.5 |
Law Debenture Corporation |
875.6 |
58.0 |
25.8 |
69.3 |
176.5 |
2.8 |
0.6 |
No |
112 |
3.8 |
Lowland |
337.7 |
48.0 |
(2.6) |
26.5 |
127.6 |
(5.8) |
0.6 |
No |
118 |
4.8 |
Murray Income Trust |
985.5 |
39.0 |
22.4 |
50.9 |
121.6 |
(3.3) |
0.6 |
No |
111 |
4.1 |
Schroder Income Growth |
202.3 |
52.5 |
11.3 |
35.2 |
126.5 |
0.1 |
0.9 |
No |
106 |
4.3 |
Temple Bar |
778.4 |
65.5 |
3.1 |
27.5 |
95.1 |
(0.8) |
0.5 |
No |
113 |
3.3 |
Troy Income & Growth |
242.1 |
19.6 |
9.5 |
21.7 |
112.2 |
(0.5) |
0.9 |
No |
100 |
2.7 |
Selected group average (17 funds) |
620.9 |
46.8 |
12.2 |
37.5 |
127.3 |
(2.6) |
0.7 |
109 |
4.1 |
|
MRCH rank |
7 |
2 |
6 |
7 |
11 |
3 |
11 |
3 |
2 |
Source: Morningstar, Edison Investment Research. Note: *Performance to 16 March 2021. NAV with debt at par. TR, total return. Net gearing is total assets less cash and equivalents as a percentage of net assets.
|
|
Research: TMT
Mensch und Maschine (M+M) reported 12.5% growth in EPS despite a 0.8% decline in revenues in FY20. Reduced spend on travel and events combined with selective use of furlough benefits more than offset the decline in demand during Q2–Q4. The company expects its normal growth trajectory to resume from Q221 and has published its outlook for EPS and DPS growth in the short and medium term.