Last close As at 05/08/2026
—
— 0.00 (0.00%)
Market capitalisation
—
Research: Metals & Mining
Central to Lepidico is its disruptive (patent-pending) L-Max® (hereafter L-Max) metallurgical technology that recovers lithium from micas (eg lepidolite), and therefore holds out the prospect of creating a new source of lithium supply. Despite being an abundant lithium-bearing mineral, lepidolite has hitherto been overlooked as there has been no commercial process by which to process it economically. This report necessarily values Lepidico on the basis of the pre-feasibility study (PFS) performed on a proposed Phase 1 L-Max plant at Kenora, Canada. Beyond that however, there are a number of development options including 1) scaling up the process to full industrial scale (Phase 2); 2) securing lepidolite resources cheaply and developing them into multiple dedicated mines; and 3) developing relationships with third-party mining companies to provide further feed sources to its plant(s).
Lepidico |
Masterful metallurgy |
Initiation of coverage |
Metals & mining |
4 July 2017 |
Share price performance
Business description
Next events
Analyst
Lepidico is a research client of Edison Investment Research Limited |
|||||||||||||||||||||||||||||||||||||||||||||||||
Central to Lepidico is its disruptive (patent-pending) L-Max® (hereafter L-Max) metallurgical technology that recovers lithium from micas (eg lepidolite), and therefore holds out the prospect of creating a new source of lithium supply. Despite being an abundant lithium-bearing mineral, lepidolite has hitherto been overlooked as there has been no commercial process by which to process it economically. This report necessarily values Lepidico on the basis of the pre-feasibility study (PFS) performed on a proposed Phase 1 L-Max plant at Kenora, Canada. Beyond that however, there are a number of development options including 1) scaling up the process to full industrial scale (Phase 2); 2) securing lepidolite resources cheaply and developing them into multiple dedicated mines; and 3) developing relationships with third-party mining companies to provide further feed sources to its plant(s).
Year end |
Total revenues (A$m) |
Reported PBT* |
Cash from operations (CFO) (A$m) |
Net (debt) cash (A$m) |
Capex (A$m) |
6/15 |
0.0 |
(1.0) |
(1.0) |
(0.1) |
(0.0) |
6/16 |
0.1 |
(2.3) |
(1.0) |
0.7 |
(0.1) |
6/17e |
0.0 |
(1.1) |
(1.1) |
1.6 |
(3.3) |
6/18e |
0.0 |
(2.9) |
(4.4) |
12.7 |
(24.3) |
Note: *PBT is normalised, excluding amortisation of acquired intangibles and exceptionals.
Scaling up and proof of concept
L-Max uses readily available mainstream chemicals and a recent PFS completed by MinMet Services Pty Ltd estimates C1 cash costs of production of lithium carbonate as close to zero (net of by-products) via this method. To date, Lepidico has conducted large scale laboratory tests that have shown the L-Max technology to operate continuously and stably over a protracted period of time. The PFS assumed a small scale, commercial L-Max plant processing a lithium mica concentrate at a rate of 3.6 tonnes per hour (tph) to produce c 3,000tpa of battery grade lithium carbonate and a suite of commercially important by-products. Having received the results of the PFS for the Phase 1 L-Max Plant, Lepidico’s strategic imperative is now the advancement of the project to full feasibility study (feasibility study or FS) level and the simultaneous development of the Phase 1 plant. NB: Conceptual estimates for a Phase 2 plant currently envisage producing c 7x as much lithium carbonate, for 3.4x as much capex to generate 8x as much NPV.
Valuation: 55% premium to the current share price
Edison estimates that execution of the PFS according to the operational parameters contained therein will result in free cash flow to Lepidico of A$28.4m per annum once steady-state production at the Phase 1 L-Max has been achieved. Assuming US$30m (A$39.8m) of equity financing at the prevailing share price, this implies a valuation for Lepidico of A$0.0202/sh currently, rising to A$0.0296 in FY22, based solely on discounting our estimate of (maximum potential) future dividends to shareholders derived from the Phase 1 plant at a rate of 10% per annum (fully diluted) – ie no value is ascribed to the development of the Phase 2 plant or other development options. As such, an investment in Lepidico may be considered to be an underwritten call on its L-Max technology.
Investment summary
Company description: Disruptive metallurgy
Lepidico (LPD) is an ASX-listed lithium exploration and development company that provides exposure to a portfolio of lithium exploration assets through its ownership of a unique lithium mica processing technology, called L-Max, as well as its wholly owned properties, joint ventures and intellectual property (IP) licence agreements in Australia, Canada, Europe and South America. The L-Max process is a disruptive technology that presents the opportunity to create a competitive (see Exhibit 1, below) third source of lithium supply, namely lithium bearing micas such as lepidolite and zinnwaldite. Although a number of lithium bearing micas are known around the world, these minerals have typically been overlooked as a source of lithium as there has been no commercial process available to economically extract the contained lithium to produce lithium carbonate or lithium hydroxide. Lepidico’s strategic objective is to become a sustainable lithium producer with a portfolio of quality assets and a pipeline of projects.
Valuation: 55% premium to current share price
Having now received the results of the PFS for the Phase 1 L-Max Plant, Lepidico has stated that its key business imperative is the advancement of the project to feasibility study status. The PFS estimates C1 cash costs for the production of lithium carbonate via the L-Max process as close to zero net of by-products:
|
Exhibit 1: Estimated lithium carbonate cost curve (co-product basis) |
|
|
Source: Roskill, Lepidico |
Edison estimates that execution of the PFS according to the operational parameters contained therein will result in free cash flow to Lepidico of A$28.4m per annum once steady-state production at the Phase 1 L-Max plant has been achieved. Discounted at a rate of 10% per annum over 10 years, steady-state free cash flow of A$28.1m has a net present value of A$172.4m. This reduces to A$117.1m to account for steady-state not being achieved until FY22 and to an illustrative value of A$62.4m (A$0.028/share) once initial capex of A$55.4m has also been deducted. Ultimately however, Edison’s detailed valuation is derived from the discounting of future, real, maximum potential dividends to shareholders and thus depends, in part, on the degree and price of any future equity financing of Phase 1 capex. In our base case, we assume US$30m (A$39.8m) of equity financing at the prevailing share price of A$0.013/share, in which case our ultimate valuation of Lepidico shares is A$0.0202 as at the start of FY18, rising to A$0.0296 in FY22.
Sensitivities and risks: Not the usual
In qualitative terms, the principal risks to which Lepidico is immediately exposed include geographical/sovereign risk, geological risk, metallurgical/technological risk, engineering risk, financing risk, legal risk and management risk. In general terms, these may be summarised as execution risk – ie management’s ability to bring the Phase 1 L-Max project to account within the required technical parameters. Owing to its unique technology, however, the balance of these risks is unlike those in the mainstream mining industry, for example, process chemistry risk has been significantly mitigated by continuous mini-plant trials. Scale-up risk also exists, although this is the subject of ongoing initiatives in mitigation (see page 15 for details). At the same time, management risk is mitigated by the track record of the management team (see also page 19). Once in production however, these risks will abate and other risks, such as commercial, commodity price, foreign exchange and global economic risks, will become relatively more significant.
Financials: FS funding requirement covered
Lepidico had A$1.1m in cash as at 31 March 2017, since which time it will have been in receipt of A$3.7m via the issue of 285.4m shares at a price of A$0.013/share from a one-for-four, non-underwritten, non-renounceable rights offer, which had a 66% take-up rate from eligible investors. The estimated cost of the L-Max FS is US$5m (A$6.6m), so management is currently deploying funds into three value-adding drill programmes in the expectation of raising additional equity at a higher price in the future. Nevertheless, it also has discretion to allocate the A$1.8m shortfall from the rights issue up to 12 July.
Company description: Unique metallurgy
Lepidico (LPD) is an ASX-listed lithium exploration and development company that provides exposure to a portfolio of lithium exploration assets through its ownership of the rights to a unique lithium ore processing technology, called L-Max, as well as its wholly owned properties, joint ventures and intellectual property (IP) licence agreements in Australia, Canada, Europe and South America. Unlike its ‘peers’, it is uniquely differentiated in having successfully produced lithium carbonate and a suite of by-products from non-traditional, hard rock, lithium bearing minerals such as lepidolite and zinnwaldite using its patent-pending L-Max process technology.
History
Lepidico, in its current form, was formed via the A$10m acquisition of the private, Belmont-based lithium explorer Lepidico, by listed vehicle Platypus Minerals, on 16 March 2016. Platypus secured underwriting from advisory and venture capitalists GTT Ventures for a A$3.5m rights issue to finance the acquisition, while shareholders in Lepidico received 750m ordinary shares in Platypus at A$0.010/share. On 25 November 2016, the company advised that a resolution had been passed by shareholders at the company's 2016 AGM to change its name from Platypus Minerals to Lepidico, effective from 30 November.
Technology
Central to Lepidico is its L-Max technology. L-Max is a hydrometallurgical process that uses readily available mainstream chemicals (eg sulphuric acid, lime and limestone) to extract and recover lithium from lithium containing micas. Lithium micas are abundant across the world, but are not typically treated owing to their having a lower lithium content than spodumene and conventional roast processing not affording the production of by-products (see below).
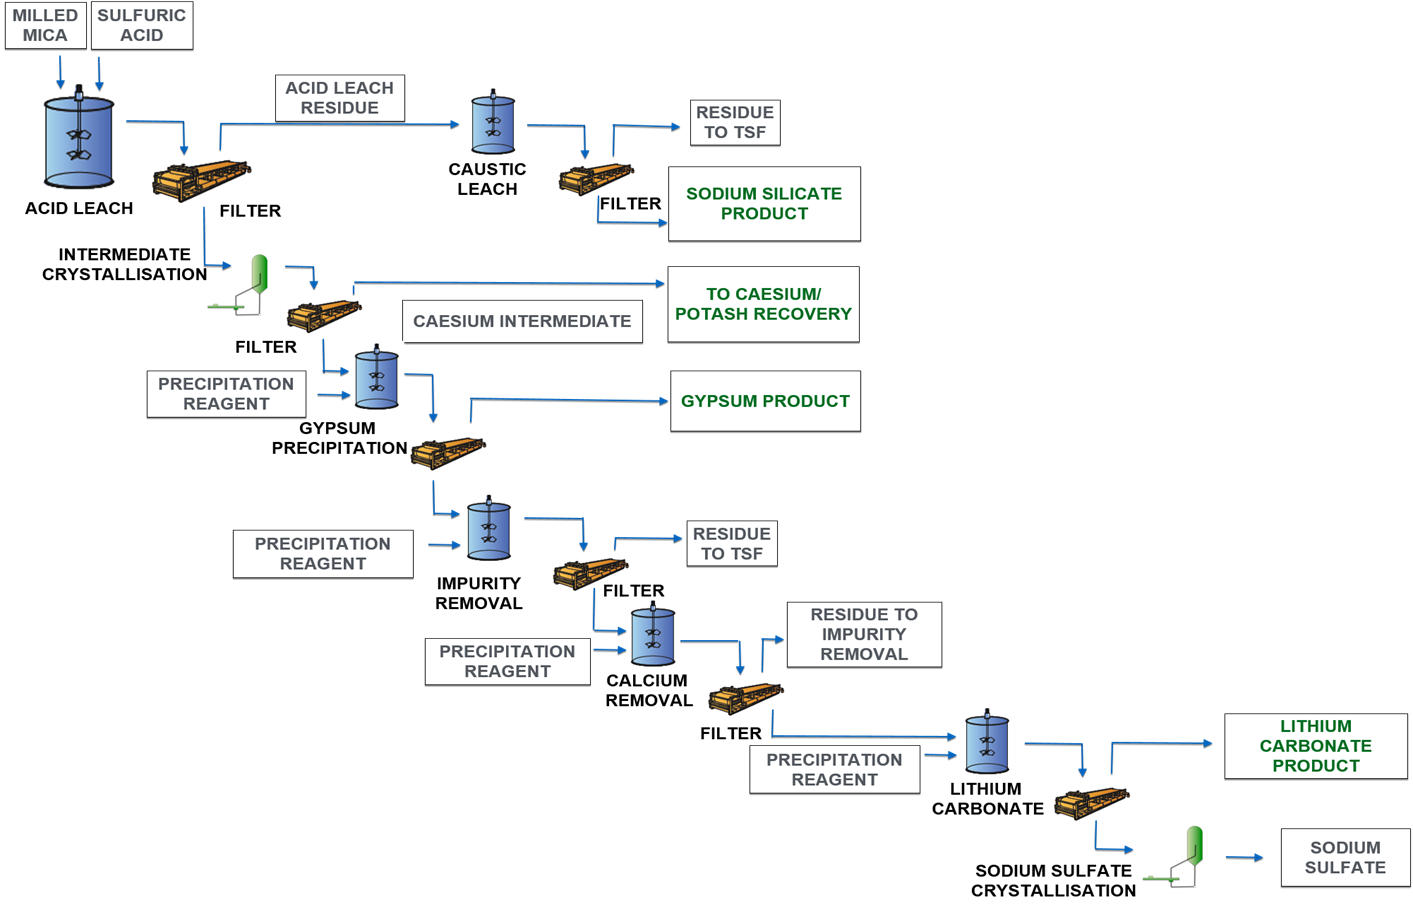
In crude terms, concentration of the micas ahead of the L-Max process occurs through simple rougher flotation at a fine grind size and with rapid flotation kinetics. Test-work, completed on various mica samples, has resulted in recoveries in the high 80%s to low 90%s. The mica concentrate is treated with sulphuric acid to dissolve the metallic ion salts and filtered to separate silicate by-products and to remove waste. The leach liquor is then subjected to a series of impurity removal and precipitation steps at different pH levels (sequentially, via the addition of limestone and lime) to produce a >99.8% Li2CO3 product that is typically sold to refiners on three- to five-year contracts for conversion into specific industrial salts and chemicals (eg lithium hydroxide, LiOH). A schematic representation of the L-Max process flowsheet is provided below:
|
Exhibit 2: Schematic representation of the L-Max process |
|
|
Source: Lepidico |
While the chemistry of the L-Max process is novel from an industrial perspective, it uses only common reagents and standard equipment. The process is conducted at atmospheric pressure and at temperatures that do not exceed 115°C. It produces little residue and the tailings are benign.
Products and by-products
Significantly, in addition to lithium carbonate, the L-Max process can also produce a suite of valuable by-products, including sodium silicate (water glass), sulphate of potash (SOP), tantalum or tin (if present) concentrate, gypsum, and sodium sulphate. There is also potential to recover both caesium and rubidium into a formate solution. The former is in demand as drilling completion fluids in the oil and gas industries. Caesium, in particular, is a high value product. Typically, only the caesium content of the brine is valued. Sodium sulphate and gypsum are present in the process residue. Finally, when the leach residue is reacted with caustic soda, it produces sodium silicate solution. While relatively unknown to investors, sodium silicate has a multiplicity of industrial uses, including as a bulking agent, an additive to paints, adhesives (eg wallpaper paste), corrugated cardboard and fillers, as a fire retardant and as a precursor to precipitated silica in tyres. The market for sodium silicate, in particular, was instrumental in identifying Kenora as a potential site for the Phase 1 plant (see L-Max plant location on page 9, below). One imperative of the PFS (see page 8) was a requirement not only to minimise the costs of consumables (including logistics), but also to maximise the value of by-products. This dual requirement had the effect of disqualifying Australia as a potential site for the Phase 1 plant as a result of its not being a major producer of sulphuric acid nor having a deep market for silicates and other potential by-products.
Business model
Thus far, Lepidico has conducted large scale laboratory tests, at a feed rate of up to c 3kg per hour, that have shown the L-Max technology to operate continuously and stably over a protracted period of time. As such, Lepidico’s strategic imperative in proving the L-Max concept is now to scale the process up to approximately 3tph in a demonstration plant – the so-called Phase 1 plant considered in its PFS (see page 8). Ordinarily, such a plant would seek only to prove that it could operate from a technical perspective. In this particular case however, the company is confident that it will also operate from a commercial perspective – ie it will provide a positive return to shareholders. Although the process chemistry has proved itself to be robust in continuous mini-plant trials, inevitably, a period of time will be required to optimise the operation of the process (eg flow rates, leach times etc). Thereafter, however, a number of alternatives under its business model exist, by which Lepidico may commercialise its technology at full scale.
Integration
Lepidico’s favoured route to commercialisation is to leverage its technology to acquire control of quality lithium mica assets to form an integrated lithium producer (see Exhibit 3 on page 6). Currently, Lepidico has agreements over a number of prospective lithium mica exploration assets (see Geological assets, below) which could yield a resource in the order of 1Mt with as little as six weeks of additional drilling. Depending on grade, etc, a c 1Mt resource, of which 70% is convertible into reserves, would be capable of supporting the Phase 1 plant for approximately 10 years. That being the case and having completed a PFS on the Phase 1 plant, Lepidico is now only six to nine months from completing a feasibility study (FS) and then, potentially, as little as two years from profitable production.
Licensing
Lepidico has also licensed its technology to other companies. Alignment of interests with licensees and the preservation of the reputation of its IP is supported by Lepidico having the right to review all technical data relating to a project prior to finalising a licence.
A schematic representation of Lepidico’s business model options is as follows:
|
Exhibit 3: Lepidico business model |
|
|
Source: Lepidico |
Sources of lithium
The two main sources of lithium in the world today are hard rock spodumene deposits and salar brines. Historically, commercial lithium production has been derived from hard rock mineral ore sources such as spodumene. Recently however, the development of salar brines from South America has expanded rapidly.
Global supply of lithium carbonate equivalent (LCE) is estimated to be in the order of 180ktpa, of which production of lithium via spodumene is c 80ktpa, primarily from pegmatites in Western Australia (of which Greenbushes is the largest and highest grade) and from some Chinese, Chilean and Argentinian brine sources. Output is dominated by six operations owned by four major companies (representing 91% of total market share), namely Albemarle, SQM, FMC and Sichuan Tianqi Lithium.
Recycling of lithium has also grown notably since Japan opened its first lithium-ion battery recycling plant in 1992. Facilities in Belgium, Germany, Japan, the US and Canada can all now process batteries for their lithium and other components.
Spodumene
Hard rock spodumene deposits occur in lithium rich pegmatites and aplites as colourless to yellowish, purplish or lilac kunzite or yellowish-green or emerald-green hiddenite crystals. The largest concentrations are found in granitic pegmatites (granite-like igneous rocks composed of quartz, feldspar and mica). The most important of these minerals are spodumene, which is a pyroxene mineral (LiAl(SiO3)2 or, alternatively, Li2O, Al2O3.4SiO2) and petalite (Li2O,Al2O3.8SiO2). Source localities include Afghanistan, Australia, Brazil, Madagascar, Pakistan, Quebec, North Carolina and California. Associated minerals include: quartz, albite, petalite, eucryptite, beryl and lepidolite (the focus of the L-Max process).
Theoretically, spodumene contains 8.03% Li2O and is usually recovered through conventional open-pit mining methods and beneficiated via gravity techniques, whereby the ore is concentrated from a 1-2% Li2O ore grade to a c 6-7% Li2O concentrate grade (ie 75-87% spodumene).
Pre-flotation treatment (ie cleaning) followed by oleic (fatty) acids or soap flotation and de-sliming is one well established recovery method for spodumene concentration. Alternatively, spodumene may be agitated with anionic collectors, followed by flotation. Oleic acids and soaps tend to produce a superior recovery in neutral and slightly alkaline pulps while napthanic acids, sulphonated castor oil, etc, tend to work better in an acid pulp.
In order to convert it to globally traded lithium carbonate, the concentrate is heated to over 1,100°C in a rotary kiln, before being crushed and treated with sulphuric acid. The resulting solution is first neutralised with limestone and then treated with soda ash (sodium carbonate) to produce a lithium carbonate solution. This solution is then evaporated prior to the addition of more soda ash to precipitate lithium carbonate.
Lithium brines
Lithium brine deposits are formed via the leaching of volcanic rocks in basin depositional environments. Salar brines can be described as underground reservoirs that contain high concentrations of dissolved Group I metal salts, such as lithium, potassium, and sodium and are generally found below the surface of dried lakebeds (particularly in South America).
Lithium is extracted from brines via a process that involves pumping the brine from the sediment basin and then concentrating it via solar evaporation over a number of months or even years. Potassium is often harvested first from early ponds, while later ponds have increasingly high concentrations of lithium. When the lithium chloride in the evaporation ponds reaches an optimum concentration, the solution is pumped to a recovery plant where filtering removes any unwanted boron and/or magnesium. Purification then occurs via solvent extraction, absorption and ionic exchange with sodium carbonate (soda ash) to precipitate refined lithium carbonate (Li2CO3). Alternatively, lithium chloride is a convenient intermediate salt from which to directly produce lithium hydroxide. Finally, excess residual brines are then pumped back into the salar. Since salar brines naturally occur at high altitudes and in areas of low rainfall, solar evaporation is a very efficient method for precipitating salts and it has been estimated that the cost of extracting lithium from such sources may be half of that from hard rock sources.
Advantages of spodumene processing
Notwithstanding their typically higher cost structure, pegmatite-based projects benefit from being quicker to move into production than brines, which may have a lead time of 1.5-3 years from the start of commercial extraction, depending on evaporation rates. Another key advantage of lithium production from hard rock deposits is the purity of the lithium carbonate produced. While the battery industry requires a minimum purity of at least 99.5% lithium carbonate, the composition of the remaining 0.5% is important and commercial penalties are often imposed for lithium carbonate containing enhanced levels of deleterious elements, such as iron, magnesium, etc.
Disadvantages of spodumene processing
In contrast with salar brine sources (see above), recovery of lithium from hard rock deposits, such as spodumene, requires a wide range of hydro-metallurgical processes. Pegmatite ores containing spodumene always contain other minerals such as mica, feldspar and quartz and iron and other silicates that have a tendency to concentrate with the spodumene. Problems associated with spodumene recovery therefore include the degree to which weathering has occurred and the presence of associated gangue minerals. Weathered mineral surfaces must be thoroughly cleaned before selective flotation. In addition, weathering and surface oxidation of the rocks may also give rise to alteration products that interfere with the flotation process. Gangue minerals may interfere with selective flotation, as well as consuming process reagents.
Lepidolite as an alternative source of lithium to spodumene
Lepidolite is a lilac-grey or rose-coloured member of the mica group of minerals with the formula K(Li,Al)3(Al,Si,Rb)4O10(F,OH)2. It is a phyllosilicate mineral and a member of the polylithionite-trilithionite series. Compared to spodumene’s 8.03%, lepidolite theoretically contains 7.70% Li2O. Despite being an abundant lithium-bearing mineral, to date it is only a secondary source of the metal, with only a few, small-scale producers in the western world exploiting lepidolite purely for use in the ceramics industry. Otherwise, it is also produced in China as a precursor to the production of lithium – albeit via a commercially inefficient roasting process. Consequently, there has been little or no global exploration for lithium-bearing micas, with the result that the best potential assets remain un-investigated, even at surface. Notable occurrences have been reported in Brazil, the Ural Mountains, California, Manitoba (the Tanco mine – an underground caesium and tantalum mine, owned and operated by Cabot Corporation, which is the world’s largest producer of caesium), Madagascar, the Iberian Peninsula and Zimbabwe.
Zinnwaldite
Zinnwaldite was first described in 1845 in Zinnwald (Cinovec) on the German-Czech border and is a silicate mineral also in the mica group. Chemically, it may be described as potassium lithium iron aluminium silicate hydroxide fluoride with formula KLiFeAl(AlSi3)O10(OH,F)2. It occurs in greisens, pegmatite, and quartz veins often associated with tin ore deposits and is commonly associated with topaz, cassiterite, wolframite, lepidolite, spodumene, beryl, tourmaline and fluorite. Compared to spodumene’s 8.03% and lepidolite’s 7.70%, zinnwaldite theoretically contains 3.42% Li2O.
Other
Other sources of lithium, to which Lepidico’s L-Max technology may prove to be applicable, include amblygonite (7.4% Li2O).
L-Max pre-feasibility study (PFS)
On 27 February 2017, Lepidico announced the results of the Phase 1 plant PFS from lead consultant MinMet. The study confirmed the viability of constructing a strategically located Phase 1 L-Max plant at Kenora in Ontario, processing lithium-mica concentrates purchased from third-party suppliers. The study assumed a small scale, commercial L-Max plant processing a lithium-mica concentrate feed at a rate of 3.6 tonnes per hour (tph) to produce approximately 3,000tpa of battery grade lithium carbonate and a suite of commercially important by-products.
Under the auspices of the PFS, a lepidolite sample containing approximately 40% mica and 2.2% Li2O (ie approximately 28.6% of the theoretical maximum), was subject to a series of batch tests to assess the amenability of the run of mine mineralisation for lithium extraction and recovery by L-Max. The sample processed was from one specific source (Separation Rapids – see page 11, below) with moderate caesium and tantalum grades. Flotation of the sample achieved a lithium recovery to concentrate of 96% and produced a high-grade mica concentrate containing 4.5% Li2O that was used as feed to the L-Max process test-work. Ultimately, a 99.88% Li2CO3 product was achieved. Individual metallurgical recoveries, by compound, were as follows:
Exhibit 4: L-Max product recoveries
Element |
|||||
Lithium |
Potassium |
Silica |
Caesium |
Tantalum |
|
L-Max feed grade (%) |
2.10 |
6.77 |
23.10 |
0.05 |
0.03 |
Recovery to product (%) |
94 |
85 |
85 |
81 |
70 |
Source: Lepidico
The test work is reported to have produced consistent results. Given the positive outcome of the PFS, Lepidico has committed to undertaking a feasibility study. The PFS results have also enabled planning parameters for the FS to be further developed and refined.
L-Max plant location
A key requirement of the PFS was not only to minimise the costs of consumables (including logistics), but also to maximise the value of by-products. This twin requirement had the effect of directing the focus of the investigation towards the Great Lakes in North America, mainland Europe and Japan, which could all evidence large sulphur/sulphuric acid production capacity (typically associated with copper and nickel smelting) as well as a deep market for silicates. After investigating all three geographical areas, Kenora, in Ontario, was decided upon, owing to its fulfilment of all the required criteria, including its proximity to the Separation Rapids deposit (owned by Avalon Advanced Materials) as well as maximising investor returns.
For the purposes of the PFS, the site chosen for the L-Max plant was a vacant industrial site in Kenora in Ontario, Canada. Kenora is a town with a population of 15,000 with well-established services. It is located approximately 200km east of Winnipeg and 215km north of Minnesota and has excellent transport connections to other parts of North America. The Canadian Pacific Railway passes though the town and the port of Thunder Bay on Lake Superior is 489km to the east with access to the St Lawrence Seaway.
The PFS has demonstrated that lithium bearing mica can be economically transported to Kenora from existing overseas lepidolite mining operations. It is planned that the L-Max plant would receive concentrates from at least two of those operations and potentially from the deposit at Separation Rapids (located 80km north of Kenora) where suitable mineralisation has also been identified, tested and found to be amenable to the L-Max process. A review of project permitting requirements has been undertaken for Ontario, which indicates that permitting is not on the critical path of the project development schedule to achieve production in H219.
Full feasibility study (FS)
Lepidico’s study will be conducted to a Class 3 level of cost estimate accuracy. In contrast to the PFS, the FS will assume that the L-Max plant will receive mica concentrates of a suitable lithium grade and quality from mines that it operates as well as from third-party sources performing the mining and concentrating processes on a commercial, arm’s length basis. Although, the L-Max plant could process concentrate from one source, it is likely that multiple sources will be contemplated in the study in order to provide security of feed.
Three additional sources of value will also be investigated:
■
The conversion of lithium carbonate to lithium hydroxide.
■
The potential value of producing rubidium in formate brine (to which no value is currently attributed).
■
The recovery of sodium sulphate and gypsum as saleable by-products.
De-risking scaling up
The path from batch test-work to commercial operation incorporates several development milestones. For example, the construction of a commercially viable demonstration plant prior to a full-scale commercial operation is a critical step in reducing project risk and optimising the process. Equipment selection for the Phase 1 plant has been made to ensure that the equipment used is suited for use in a commercial L-Max plant. The Phase 1 plant equipment will represent a smaller version of the equipment selected for use in a larger Phase 2 plant, which will have an anticipated production capacity of 15,000-25,000tpa lithium carbonate. This is intended to minimise the scale-up risk of using equipment that is unsuited to larger throughputs.
Proprietary processes, patent protection and the law
Lepidico submitted an international patent application for the L-Max Process under the Patent Cooperation Treaty administered by the World Intellectual Property Organisation in October 2015. Australian Innovation Patent 2016101526 was filed as a divisional application of the international patent application for the L-Max process. This process includes a rigorous ‘preliminary’ examination of the process described and claimed, based on internationally accepted criteria for patentability (the examination being conducted in this case by the Australian Patent Office as an International Searching & Examining Authority). As a result of this examination, it was acknowledged in the International Preliminary Report on Patentability that the L-Max process as described and claimed in the international application was “novel, inventive, industry applicable and patentable”. As a result, on 8 February 2017, Lepidico announced that its L-Max process (the subject of International Patent Application PCT/AU2015/000608), was granted a Certification Report of Innovation Patent (number 2016101526) in Australia, with formal report advised for receipt the following day. While the conclusions of the International Preliminary Report on Patentability are not ultimately binding, they do represent a guide for Patent Offices before which national and/or regional phase patent applications from the international application may proceed in due course.
Geological assets
Lepidico’s current exploration assets include options over the Lemare and the Royal projects, both in Quebec, an ore access agreement with Grupo Mota over the Alvarrões Lepidolite Mine in Portugal, a farm-in agreement with Pioneer Resources over the PEG 9 lepidolite prospect in Western Australia, ownership of the Euriowie amblygonite project near Broken Hill in New South Wales and an agreement with Crusader Resources regarding the potential deployment of L-Max in Portugal and Brazil.
All three of Lepidico’s planned feed-source targets for the Phase 1 Plant – Separation Rapids, Alvarrões and PEG 9 – are located in stable, mining friendly jurisdictions and close to critical infrastructure, including power, water and transport. Together or separately, these three projects have the potential to provide long-term feedstock for an L-Max processing facility, either at Kenora or elsewhere.
A map of Lepidico’s geological assets, including potential sites for Phase 1 and/or Phase 2 L-Max plants is as follows:
|
Exhibit 5: Map of assets in which Lepidico has an interest including potential L-Max plant locations |
|
|
Source: Lepidico |
Separation Rapids
Separation Rapids is a large LCT-type complex pegmatite owned by Avalon Advanced Materials and situated approximately 70km north of Kenora in NW Ontario. Although the prospect already contains an NI 43-101 compliant petalite resource (which was the subject of a PEA announcement in September 2016), it also contains significant but, as yet, unquantified and un-investigated lepidolite resource potential.
Samples from outcropping lepidolite-rich sub-zones to the east of the main Separation Rapids petalite resource were provided to Lepidico for laboratory bench tests using L-Max as part of the Phase 1 plant PFS. Excellent results were achieved (including the production of battery grade lithium carbonate of 99.88% purity – see page 8) and Avalon and Lepidico subsequently entered into a non-binding letter of intent, according to which Avalon will sell a minimum of 15,000tpa of lepidolite concentrate, produced as a by-product from its demonstration-scale pilot petalite flotation plant at Kenora, to Lepidico for processing at its planned Phase 1 commercial lithium carbonate production facility.
PEG 9
PEG 9 occurs within a cluster of 13 pegmatites owned by Pioneer Resources along a 20km trend flanking the eastern edge of the Pioneer Dome (an Archaean granite intrusive within the Norseman-Wiluna greenstone belt). It is located approximately 35km north of the town of Norseman and adjacent to the Coolgardie-Esperance Highway and rail line. The prospect itself contains a number of outcropping pegmatites rich in lepidolite and lithium-muscovite.
The PEG 9 prospect was described by Pioneer as an example of a complex lithium-caesium-tantalum (LCT) type pegmatite, outcropping in two parallel structures over a 200m strike length. Although Pioneer had been primarily exploring for spodumene, rock chip samples returned up to 3.94% Li2O from lepidolite-rich pegmatite and up to 3.84% Li2O from a lepidolite-poor, yet micaceous pegmatite. A grab sample from PEG 9 was collected by Lepidico in January that underwent bench scale test work by the L-Max process, producing excellent results, and confirming the amenability of the material as a potential future feedstock for an L-Max processing plant. Lepidico is farming into PEG 9 via a drilling programme (NB to date, no holes have been drilled at PEG 9), with the objective of delineating a 0.5Mt resource at a grade of 1.2% Li2O or more to earn a 75% interest in the prospect.
Alvarrões
The Alvarrões mining concession is approximately 634ha in size and encompasses most of the known lithium pegmatites in the area, which crops out along the north-eastern slopes of the Serra da Estrela mountains.
The Alvarrões Lepidolite Mine is owned and operated by Grupo Mota, which produces approximately 20,000tpa of lithium minerals from the mine, predominantly lepidolite for the ceramics industry.
Although the area has a long-established history of open pit extraction of hard-rock lithium ores, to date, the potential for a large-scale mining operation focused on the production of chemicals for the lithium-battery market has remained unevaluated. Nevertheless, the dense concentration and strike continuity of the pegmatites provide excellent potential for the delineation of a significant deposit – eg in the order of 2Mt of resource – capable of supporting both a Phase 1 and, potentially, a Phase 2 plant.
Under the terms of its agreement with Grupo Mota, Lepidico is undertaking development expenditure of at least €250,000 over an 18-month exclusive period on Alvarrões with the goal of defining a JORC-compliant mineral resource of >1Mt at a grade of 1.5% Li2O. In return, Lepidico will have an exclusive/pre-emptive right for three years in which to effect a commercial relationship with Grupo Mota regarding the supply of ore/concentrate from Alvarrões to Lepidico and/or the right for Lepidico to develop and operate a lithium mica mining and concentration project there.
Lepidico’s agreement with Grupo Mota was announced on 9 March 2017. Since then, Lepidico has inaugurated a 25-hole diamond drilling programme designed to delineate a JORC resource by September 2017. All four holes drilled to date have intersected the target pegmatite and revealed strong lepidolite mineralisation. The fourth hole, ALVD04 (a step-out hole), also demonstrates that the target extends materially down dip from its previously known limits.
Other – Lithium Australia (LIT)
Lepidico has a number of other licence option agreements, including with Lithium Australia (LIT). On 4 November 2016, Lithium Australia NL (LIT – share price A$0.075 at the time of writing) announced that it had lodged an application with the Supreme Court of Western Australia seeking clarifications regarding its legal relationship with Lepidico to the effect that:
■
LIT’s rights under certain agreements with Lepidico remain valid; and
■
LIT has the ability to exploit its SiLeach™ process in light of those agreements.
On 7 November 2016, Lepidico announced that it would undertake a “vigorous defence” of its intellectual property rights and, on 9 December, lodged Defence & Counterclaim proceedings to the effect that:
■
The SiLeach process was developed without authorisation, using Lepidico’s intellectual property and/or confidential information disclosed to LIT.
■
LIT had breached a number of clauses under the terms of the licence agreement entered into with Lepidico.
On 27 February, Lepidico announced that the litigation entered into by Lithium Australia had been settled by mutual agreement to the effect that, inter alia, Lepidico’s L-Max intellectual property (IP) rights do not appear to have been compromised. In light of this, Lepidico concluded that it was in the best interests of its shareholders to agree to the declarations being sought by LIT and it therefore made a settlement proposal to LIT to resolve the matter, which was accepted by LIT.
On 6 February 2017, Lithium Australia announced that it intended to make an unsolicited, conditional, off-market, all share takeover bid for Lepidico in the ratio one (1) Lithium Australia share for every 13 and one-quarter (13.25) Lepidico shares held. At the time, LIT’s shares were trading at A$0.185 each and valued Lepidico at A$0.014/share, or A$23.8m in aggregate. The board of Lepidico advised shareholders to reject the bid approach and “take no action”. LIT extended the period for acceptances on several occasions, most recently to midnight (WST) on Monday 19 June. With no subsequent offer period extensions since then, however, the offer closed on that date. As at 22 June, Lithium Australia held a 15.82% interest in Lepidico, thus becoming its second largest shareholder (see page 20).
While the nature and timing of the Lithium Australia takeover offer may be regarded as opportunistic, it nevertheless highlights the interest emerging in the industry regarding new process technologies for the production of lithium chemicals.
Valuation assumptions
Edison has valued Lepidico based on the expected operating parameters of developing a Phase 1 plant at Kenora, as investigated in its recent PFS. Implicitly therefore, it assumes that the L-Max plant will purchase mica concentrates of a suitable lithium grade and quality from a third party on a ‘free on board (FOB)’ basis at the mine gate.
Prices
Edison’s pricing assumptions for the products produced by the L-Max process are essentially those used by Lepidico in its PFS and are shown below:
Exhibit 6: Product and by-product price assumptions
Product |
Price (US$/t unless otherwise indicated) |
Lithium carbonate |
US$8,000/t |
Sulphate of potash |
US$600/t |
Sodium silicate |
US$689/t |
Caesium |
US$15,000/t |
Gypsum |
US$10/t |
Tantalum |
US$120/kg |
Product |
Lithium carbonate |
Sulphate of potash |
Sodium silicate |
Caesium |
Gypsum |
Tantalum |
Price (US$/t unless otherwise indicated) |
US$8,000/t |
US$600/t |
US$689/t |
US$15,000/t |
US$10/t |
US$120/kg |
Source: Lepidico
Opex
The majority (>90%) of the operating costs have been estimated from first principles based on quoted pricing.
Exhibit 7: Major consumables’ unit costs and consumption rates
Reagent |
Consumable consumption rate (kg/t of concentrate processed)* |
Estimated cost of consumable FOB (US$/t)* |
Sulphuric acid (93%) |
1,054 |
60 |
Limestone and hydrated lime |
706 |
38/120 |
Sodium carbonate |
143 |
239 |
Caustic soda (50% solution) |
614 |
207 |
Formic acid |
13 |
600 |
Natural gas |
GJ7.6/t |
US$3.38/GJ |
Source: Lepidico. Note: *Unless otherwise indicated.
Of the consumables costs, 67% relates to sulphuric acid and caustic soda (for the production of sodium silicate). Other processing costs include personnel, maintenance parts and laboratory analytical services.
Exhibit 8: Estimated unit operating costs (current prices)
Item |
Estimated unit operating costs (US$ per tonne concentrate processed) |
Concentrate purchased |
350 |
Concentrate transport |
4 |
Inbound consumable logistics |
144 |
Consumables (FOB) |
286 |
Other processing costs |
186 |
Sales, marketing and outbound logistics |
55 |
General and administrative |
104 |
Total unit costs |
1,130 |
Item |
Concentrate purchased |
Concentrate transport |
Inbound consumable logistics |
Consumables (FOB) |
Other processing costs |
Sales, marketing and outbound logistics |
General and administrative |
Total unit costs |
Estimated unit operating costs (US$ per tonne concentrate processed) |
350 |
4 |
144 |
286 |
186 |
55 |
104 |
1,130 |
Source: Lepidico
The lithium-mica concentrate purchase price of US$350/t is based on the forecast price for spodumene, which is US$500/t (source: Roskill), adjusted for the lower grade of the lepidolite concentrate (4.5% Li2O vs 6% for a typical spodumene concentrate). This does not account for the lower capital and operating costs associated with a lepidolite concentrator compared to a spodumene one, which could result in a further discount being applied. In addition, quotes to deliver lepidolite to Kenora from an existing mine were solicited from a European supplier and were found to be below the US$350/t used in the study (including transport).
Capex
Lepidico’s estimate of capital costs was prepared in consultation with an independent cost estimating firm, called Professional Cost Consultants (PCC), based on a comprehensive equipment list, with pricing obtained from up to three vendors:
Exhibit 9: Capex estimate (US$m)
Item |
Estimate (US$m) |
Percent of total (%) |
Feasibility study and 2017 owner’s costs |
5.0 |
12.2 |
L-Max plant direct costs |
16.2 |
39.4 |
L-Max plant services |
4.6 |
11.2 |
Infrastructure |
2.6 |
6.3 |
Indirect costs |
6.7 |
16.3 |
Contingency (20%) |
6.0 |
14.6 |
Total |
41.1 |
100.0 |
Source: Lepidico, Edison Investment Research
Note that the infrastructure scope is limited owing to the plant’s urban location with ready access to power, water, natural gas and transport infrastructure.
Sustaining capital has been estimated at US$1.1m pa, which is largely attributable to residue disposal. A closure cost of US$1.0m has been included to provide for removal of the plant at the end of the project’s life.
The accuracy of the estimate was -20% to +30%, which meets the requirements for a pre-feasibility study.
The capital cost of the process plant may be reduced by approximately US$5m by eliminating the SOP circuit.
Valuation
On the basis of the assumptions set out above, Edison forecasts that Lepidico’s annual income statement will appear (approximately) as follows once steady-state production at the Phase 1 L-Max has been achieved (see below):
Exhibit 10: Edison estimate of Lepidico free cash flow once steady-state Phase 1 achieved
Australian dollars |
|
Revenue |
81,279,441 |
Costs |
42,577,200 |
Gross profit |
38,702,240 |
Depreciation |
(5,552,118) |
General & administrative costs |
(617,296) |
Operating profit |
32,532,827 |
Net finance income |
0 |
Other expenses |
(504,000) |
Loss before income tax |
32,028,827 |
Income tax expense |
8,007,207 |
Marginal tax rate |
25.0 |
Profit from continuing operations |
24,021,620 |
Sustaining capex |
(1,519,118) |
Free cash flow |
28,054,620 |
Revenue |
Costs |
Gross profit |
Depreciation |
General & administrative costs |
Operating profit |
Net finance income |
Other expenses |
Loss before income tax |
Income tax expense |
Marginal tax rate |
Profit from continuing operations |
Sustaining capex |
Free cash flow |
Australian dollars |
81,279,441 |
42,577,200 |
38,702,240 |
(5,552,118) |
(617,296) |
32,532,827 |
0 |
(504,000) |
32,028,827 |
8,007,207 |
25.0 |
24,021,620 |
(1,519,118) |
28,054,620 |
Source: Edison Investment Research
Discounted at a rate of 10% per annum over 10 years, steady-state free cash flow of A$28.1m per annum has a net present value of A$172.4m. This reduces to A$117.1m to account for steady state not being achieved until FY22 and to an illustrative value of A$62.4m (A$0.028/share) once initial capex of A$55.4m has also been deducted. Nevertheless, it is close to the value of A$66.6m derived from the discounting of Edison’s detailed, estimated future cash flows from FY18 (including central costs and the cost of the FS).
Ultimately however, Edison’s detailed valuation is derived from the discounting of future, real, maximum potential dividends to shareholders and thus depends, in part, on the degree and price of any future equity financing of Phase 1 capex. In our base case, we assume US$30m (A$39.8m) of equity financing via the issue of an additional 3.1bn shares at the prevailing share price of A$0.013 in FY18. Note that this is relatively conservative in terms of implied future gearing/leverage and consequent debt/strategic partner-sourced funding requirements (see Exhibit 16), but is justified on the grounds that prudent gearing/leverage ratios are appropriate in relation to the funding of a specific, specialist, novel and unique technology. In this case, the ultimate valuation of Lepidico shares is A$0.0202 as at the start of FY18, rising to A$0.0296 in FY22, when the first dividend is potentially payable to shareholders, as depicted below:
|
Exhibit 11: Edison estimate of future Lepidico EPS and (maximum potential) DPS |
|
|
Source: Edison Investment Research |
Risks and sensitivities
In qualitative terms, the principal risks to which Lepidico is immediately exposed include geographical/sovereign risk, geological risk, metallurgical/technological risk, engineering risk, financing risk, legal risk and management risk. In general terms, these may be summarised as execution risk – ie management’s ability to bring the Phase 1 L-Max project to account within the required technical parameters. Owing to its unique technology however, the balance of these risks is unlike those in the mainstream mining industry:
■
Lepidico’s exposure to sovereign risk may be separated into sovereign risk relating to its mining/exploration activities and sovereign risk relating to the potential location of its plant. In terms of its plant however, Lepidico has the option to site its plant almost anywhere in the world, albeit it has narrowed this down to Europe, the Great Lakes or Japan. Nevertheless, this exposes it to little more discretionary sovereign risk than the average, multi-national manufacturing organisation. In terms of its mining/exploration sovereign risk, Lepidico has made a conscious decision to focus on stable, mining-friendly jurisdictions close to critical infrastructure, owing to its unique lepidolite processing technology, which therefore gives it the ability to select geological assets in a minimally competitive environment.
■
As a result of the above, Lepidico’s exposure to geological risk is also greatly reduced in that it is not critical for it to control the production of its lepidolite ore feedstock (notwithstanding its integrated business model).
■
Metallurgical/technological risk is mitigated by Lepidico’s ongoing programme of testing and technological studies. Thus far, Lepidico has conducted large scale laboratory tests, at a feed rate of c 3kg per hour, that have shown the L-Max technology to operate continuously and stably over a protracted period of time. As a result, its immediate strategic imperative now is to scale the process up to c 3tph in its Phase 1 commercial demonstration plant – as envisaged in its recent pre-feasibility study (see page 8).
■
Similarly, the path from batch test-work to full-scale operation incorporates several development milestones to mitigate engineering risk, such as the construction of a commercially viable demonstration plant prior to a full-scale commercial operation. The equipment selected for the Phase 1 plant will be a smaller version of the equipment for use in the larger Phase 2 plant therefore and will be made with the specific intention of minimising scale-up risk.
■
Legal risk. Lepidico submitted an international patent application for the L-Max Process under the Patent Cooperation Treaty administered by the World Intellectual Property Organisation in October 2015. Australian Innovation Patent 2016101526 was filed as a divisional application of the international patent application. In the preliminary part of this process, the Australian Patent Office (as an International Searching & Examining Authority) found that the L-Max process as described and claimed in the international application was “novel, inventive, industry applicable and patentable”. As a result, on 8 February 2017, Lepidico announced that its L-Max process was granted a Certification Report of Innovation Patent (number 2016101526) in Australia, with formal report advised for receipt the following day. While the conclusions of the International Preliminary Report on Patentability are not ultimately binding, they do represent a guide for Patent Offices before which national and/or regional phase patent applications from the international application may proceed in due course.
■
Management risk is similarly mitigated by the track record of its senior managers and board members. The chairman, Gary Johnson, in particular, has over 30 years of experience in the industry, including as the managing director of LionOre, while the managing director, Joe Walsh has over 25 years of experience, including as general manager (corporate development) of PanAust, in which role he was instrumental in the evolution of the company from an explorer to a >US$2bn, ASX 100, multi-mine copper and gold company.
Once in production however, these risks will typically abate and other risks, such as commercial, commodity price, foreign exchange and global economic risks will become relatively more significant. On the one hand, for example, third-party estimates suggest that the lithium market will need to grow from c 180kt per annum to c 3Mtpa in order to accommodate electric vehicle penetration of the car market of c 14% globally and 30% in Europe by 2025 as cost parity is reached with conventional vehicles. This might be regarded as an ‘opportunity’ or an ‘upside risk’. On the other hand, while spent lithium ion batteries (LIBs) are currently processed to recover cobalt and other base metals, they are not (yet) processed to recover lithium. Varying compositions of batteries for different applications require the development of a suitable recycling process to recover metals from all types of LIBs. However, there is every chance of this becoming a reality in coming years – especially, if the market takes off to the extent suggested above. This may be regarded as a ‘downside risk’. Self-evidently, the extent to which either of these scenarios prove to be true in the future will express itself as changes in the lithium price. In quantitative terms, Edison’s valuation of Lepidico is sensitive to lithium price assumptions to the following extent:
Exhibit 12: Lepidico valuation sensitivity to lithium carbonate price
Lithium carbonate price (US$/t) |
4,000 |
6,000 |
8,000 |
10,000 |
12,000 |
Change vs base case (%) |
-50.0 |
-25.0 |
u/c |
+25.0 |
+50.0 |
Valuation (A$/share) |
0.0095 |
0.0148 |
0.0202 |
0.0256 |
0.0310 |
Change vs base case (%) |
-53.0 |
-26.7 |
u/c |
+26.7 |
+53.5 |
Source: Edison Investment Research.
With respect to primary product pricing, investors’ attention is drawn to the similarity in the percentage change of the lithium carbonate price and the percentage change in Edison’s estimate of Lepidico’s valuation, as opposed to the more normal ‘geared effect’ exhibited by mining companies. Note however that this is consistent with a near zero unit cash cost of production of lithium carbonate net of by products as depicted in Exhibit 1. Note that Edison’s valuation of Lepidico is sensitive to by-product price assumptions to the following extent:
Exhibit 13: Lepidico valuation sensitivity to by-product prices
Change vs base case (%) |
-50.0 |
-25.0 |
u/c |
+25.0 |
+50.0 |
Valuation (A$/share) |
0.0041 |
0.0121 |
0.0202 |
0.0284 |
0.0365 |
Change vs base case (%) |
-79.7 |
-40.1 |
u/c |
+40.6 |
+80.7 |
Source: Edison Investment Research
Similarly, it is sensitive to costs and the discount rate as follows:
Exhibit 14: Lepidico valuation sensitivity to costs
Change vs base case (%) |
-20.0 |
-10.0 |
u/c |
+10.0 |
+20.0 |
Valuation (A$/share) |
0.0262 |
0.0232 |
0.0202 |
0.0284 |
0.0365 |
Change vs base case (%) |
+29.7 |
+14.9 |
u/c |
+40.6 |
+80.7 |
Source: Edison Investment Research
Exhibit 15: Lepidico valuation sensitivity to the discount rate
Discount rate (%) |
0.0 |
5.0 |
10.0 |
15.0 |
20.0 |
25.0 |
30.0 |
Valuation (A$/share) |
0.0474 |
0.0304 |
0.0202 |
0.0139 |
0.0098 |
0.0071 |
0.0052 |
Source: Edison Investment Research
Financials
Lepidico had A$1.1m in cash as at 31 March 2017, since which time it will have been in receipt of A$3.7m via the issue of 285.4m shares at a price of A$0.013/share in the form of a one for four non-renounceable rights offer. The estimated cost of the L-Max FS is US$5m (A$6.6m). As a result, management is currently deploying funds into three value-adding drill programmes in the expectation of raising additional equity at a higher price in the future. Nevertheless, it also has discretion to allocate the A$1.8m shortfall from the rights issue up to 12 July.
Central to Edison’s valuation is an assumption that Lepidico raises US$30m in FY18 in order to fund the development of the Phase 1 plant. Inasmuch as it may raise more or less however, Edison’s valuation is sensitive to the degree of equity financing to the following extent:
Exhibit 16: Lepidico valuation sensitivity to degree of future equity funding
Estimated future equity funding (US$m) |
0.0 |
10.0 |
20.0 |
30.0 |
47.2 |
Estimated future equity funding (A$m) |
0.0 |
13.3 |
26.6 |
39.8 |
62.7 |
Edison valuation (A$/share) |
0.0330 |
0.0261 |
0.0226 |
0.0202 |
0.0177 |
Maximum debt funding requirement (A$m) |
(72.0) |
(55.7) |
(39.3) |
(24.4) |
0.0 |
Maximum gearing* (%) |
1,572.0 |
265.8 |
105.4 |
46.8 |
0.0 |
Maximum leverage** (%) |
94.0 |
72.7 |
51.3 |
31.9 |
0.0 |
Source: Edison Investment Research. Note: *Defined as (net debt/equity); **Defined as (net debt/[net debt+equity]).
Exhibit 17: Financial summary
Accounts: IFRS, Year-end: June, AU$000s |
|
|
2015 |
2016 |
2017e |
2018e |
2019e |
2020e |
Total revenues |
|
|
9 |
116 |
0 |
0 |
0 |
19,273 |
Cost of sales |
|
|
0 |
0 |
0 |
0 |
0 |
(16,622) |
Gross profit |
|
|
9 |
116 |
0 |
0 |
0 |
2,651 |
SG&A (expenses) |
|
|
(455) |
(617) |
(617) |
(617) |
(617) |
(617) |
Other income/(expense) |
|
|
0 |
0 |
0 |
0 |
0 |
0 |
Exceptionals and adjustments |
|
(16) |
(415) |
0 |
0 |
0 |
0 |
|
Depreciation and amortisation |
|
(5) |
(6) |
(4) |
(1,757) |
(3,938) |
(4,974) |
|
Reported EBIT |
|
(467) |
(923) |
(621) |
(2,374) |
(4,556) |
(2,941) |
|
Finance income/(expense) |
|
(18) |
(5) |
3 |
8 |
63 |
(1,364) |
|
Other income/(expense) |
|
(559) |
(448) |
(504) |
(504) |
(504) |
(504) |
|
Exceptionals and adjustments |
|
0 |
(888) |
0 |
0 |
0 |
0 |
|
Reported PBT |
|
|
(1,044) |
(2,263) |
(1,122) |
(2,870) |
(4,996) |
(4,809) |
Income tax expense (includes exceptionals) |
|
|
0 |
0 |
0 |
0 |
0 |
0 |
Reported net income |
|
|
(1,044) |
(2,263) |
(1,122) |
(2,870) |
(4,996) |
(4,809) |
Basic average number of shares, m |
|
|
178 |
465 |
1,959 |
3,720 |
5,253 |
5,253 |
Basic EPS |
|
|
(0.0) |
(0.0) |
(0.0) |
(0.0) |
(0.0) |
(0.0) |
|
|
|
|
|
|
|
|
|
Balance sheet |
|
|
||||||
Property, plant and equipment |
|
|
9 |
4 |
0 |
19,280 |
39,337 |
44,721 |
Goodwill |
|
|
0 |
0 |
0 |
0 |
0 |
0 |
Intangible assets |
|
|
0 |
16,204 |
19,524 |
22,843 |
22,843 |
22,843 |
Other non-current assets |
|
|
1,485 |
715 |
4,035 |
7,354 |
7,354 |
7,354 |
Total non-current assets |
|
|
1,494 |
16,922 |
23,558 |
49,478 |
69,535 |
74,919 |
Cash and equivalents |
|
|
53 |
666 |
1,605 |
12,653 |
12,653 |
12,653 |
Inventories |
|
|
0 |
0 |
0 |
0 |
0 |
1,606 |
Trade and other receivables |
|
|
4 |
3,870 |
0 |
0 |
0 |
1,584 |
Other current assets |
|
|
0 |
0 |
0 |
0 |
0 |
0 |
Total current assets |
|
|
57 |
4,537 |
1,605 |
12,653 |
12,653 |
15,843 |
Non-current loans and borrowings |
|
|
0 |
0 |
0 |
0 |
25,054 |
37,070 |
Other non-current liabilities |
|
|
0 |
0 |
0 |
0 |
0 |
0 |
Total non-current liabilities |
|
|
0 |
0 |
0 |
0 |
25,054 |
37,070 |
Trade and other payables |
|
|
105 |
614 |
92 |
92 |
92 |
1,458 |
Current loans and borrowings |
|
|
115 |
0 |
0 |
0 |
0 |
0 |
Other current liabilities |
|
|
40 |
33 |
33 |
33 |
33 |
33 |
Total current liabilities |
|
|
260 |
647 |
125 |
125 |
125 |
1,491 |
Equity attributable to company |
|
|
1,292 |
20,812 |
25,038 |
62,005 |
57,009 |
52,200 |
Non-controlling interest |
|
|
0 |
0 |
0 |
0 |
0 |
0 |
|
|
|
|
|
|
|
|
|
Cashflow statement |
|
|
||||||
Profit for the year |
|
|
(1,044) |
(2,263) |
(1,122) |
(2,870) |
(4,996) |
(4,809) |
Taxation expenses |
|
|
0 |
0 |
0 |
0 |
0 |
0 |
Depreciation and amortisation |
|
|
5 |
6 |
4 |
1,757 |
3,938 |
4,974 |
Share based payments |
|
|
450 |
40 |
0 |
0 |
0 |
0 |
Other adjustments |
|
|
(451) |
1,036 |
(3,320) |
(3,320) |
0 |
0 |
Movements in working capital |
|
|
(10) |
148 |
3,348 |
0 |
0 |
(1,824) |
Interest paid / received |
|
|
0 |
0 |
0 |
0 |
0 |
0 |
Income taxes paid |
|
|
0 |
0 |
0 |
0 |
0 |
0 |
Cash from operations (CFO) |
|
|
(1,050) |
(1,033) |
(1,089) |
(4,433) |
(1,058) |
(1,659) |
Capex |
|
|
(9) |
(63) |
(3,320) |
(24,357) |
(23,996) |
(10,358) |
Acquisitions & disposals net |
|
|
0 |
32 |
0 |
0 |
0 |
0 |
Other investing activities |
|
|
(563) |
(80) |
0 |
0 |
0 |
0 |
Cash used in investing activities (CFIA) |
|
|
(572) |
(111) |
(3,320) |
(24,357) |
(23,996) |
(10,358) |
Net proceeds from issue of shares |
|
|
1,505 |
1,872 |
5,348 |
39,837 |
0 |
0 |
Movements in debt |
|
|
100 |
(115) |
0 |
0 |
25,054 |
12,017 |
Other financing activities |
|
|
0 |
0 |
0 |
0 |
0 |
0 |
Cash from financing activities (CFF) |
|
|
1,605 |
1,757 |
5,348 |
39,837 |
25,054 |
12,017 |
Increase/(decrease) in cash and equivalents |
|
|
(18) |
613 |
939 |
11,047 |
0 |
0 |
Currency translation differences and other |
|
|
0 |
0 |
0 |
0 |
0 |
0 |
Cash and equivalents at end of period |
|
|
53 |
666 |
1,605 |
12,653 |
12,653 |
12,653 |
Net (debt) cash |
|
|
(61) |
666 |
1,605 |
12,653 |
(12,401) |
(24,418) |
Movement in net (debt) cash over period |
|
|
(61) |
727 |
939 |
11,047 |
(25,054) |
(12,017) |
Source: Lepidico sources, Edison Investment Research
|
|||||||||||||||||||||||||||||||||||||||||||||||
|
|
The reduction of profit expectations resulting from UK supply shortages of Nintendo’s Switch console shows, if proof were needed, that Game Digital is still tied into the old product-driven gaming cycle. It is still early days in terms of management’s mission to migrate to a more experiential model, which is where we locate the value. Although the share price has halved on short-term delays, on the main issue the prospects, the execution risks, and the upside associated with success remain intact.