Last close As at 07/08/2026
GBP3.50
— 0.00 (0.00%)
Market capitalisation
—
Research: Investment Companies
Martin Currie Global Portfolio Trust
Martin Currie Global Portfolio Trust |
Diversified global exposure with dividend growth |
Investment trusts |
6 September 2016 |
Share price/discount performance
Three-year cumulative perf. graph
Gearing
Analysts
|
|||||||||||||||||||||||||||||||||||||||||||||||||||||||||||||||||||||||||||||||||||||
Martin Currie Global Portfolio Trust (MNP) aims to outperform the total return of the benchmark FTSE World Index by investing in a portfolio of global, primarily large-cap equities with above-average growth potential and attractive valuations. A zero discount policy was adopted in 2013 to enhance liquidity and ensure that the share price trades close to net asset value. MNP has a progressive dividend policy; annual dividends have been increased or maintained since the trust’s inception. The current dividend yield of 2.0% is above the peer group average.
12 months ending |
Total share price return (%) |
Total NAV |
FTSE World |
FTSE All-Share |
31/08/12 |
13.9 |
12.5 |
10.2 |
10.2 |
31/08/13 |
23.0 |
17.1 |
20.1 |
18.9 |
31/08/14 |
10.2 |
10.6 |
13.3 |
10.3 |
31/08/15 |
1.1 |
1.2 |
2.3 |
(2.3) |
31/08/16 |
24.1 |
24.6 |
26.5 |
11.7 |
Note: Twelve-month rolling discrete £-adjusted total return performance.
Investment strategy: Concentrated stock picking
MNP is managed on a bottom-up basis, with a consideration of the macro environment. Tom Walker has managed the fund since January 2000 and is able to draw on the well-resourced Martin Currie investment team; fundamental analysis of potential portfolio holdings is rigorous and includes a detailed five-year forecast and valuation target. The resulting portfolio typically holds c 60 stocks (currently 53), diversified by geography and sector. At the end of July 2016, the top 10 holdings accounted for 32% of the portfolio. Gearing of up to 20% is permitted, but has not been utilised since 2008.
Market outlook: Potential for modest upside
For much of the last two years, global and UK shares have experienced a period of volatility as a result of a series of macroeconomic concerns including the UK’s recent EU referendum. In recent months, share prices have moved up meaningfully, which has led to less favourable valuations than earlier in 2016, a period of heightened investor risk aversion. Further share price appreciation is therefore more likely to be dependent on earnings growth, which in the current low economic growth environment should be modest.
Valuation: Shares trade close to NAV, attractive yield
Following the implementation of a zero discount policy, MNP’s shares have traded close to net asset value. The current discount of 0.3% is in line with the average over the last 12 months. Dividends have grown at an annualised rate of 7.2% since launch, which is considerably higher than the average inflation rate over the period. The current dividend yield of 2.0% compares favourably with a selected group of peers in the AIC Global sector.
Exhibit 1: Trust at a glance
Investment objective and fund background |
Recent developments |
||||||||||||||||||||||||||||||||||||||||||||||||||||||||||||||||||||||
Martin Currie Global Portfolio Trust’s objective is to achieve long-term capital growth in excess of the capital return of the benchmark FTSE World Index by investing in a diversified portfolio of international quoted investments. The benchmark was changed on 1 June 2011 from the FTSE All-Share Index to the FTSE World Index when the trust adopted a more global focus. |
■ 9 June 2016: Announcement of 0.9p first interim dividend for FY17. ■ 24 March 2016: Annual report to 31 January 2016. NAV TR +0.9% versus benchmark TR -0.1%. Share price TR -1.4%. Announcement of 1.45p fourth interim dividend for FY16. ■ 24 November 2015: Announcement of 0.9p third interim dividend for FY16. |
||||||||||||||||||||||||||||||||||||||||||||||||||||||||||||||||||||||
Forthcoming |
Capital structure |
Fund details |
|||||||||||||||||||||||||||||||||||||||||||||||||||||||||||||||||||||
AGM |
June 2017 |
Ongoing charges |
0.71% (as at January 2016) |
Group |
Martin Currie Investment Mgmt. (UK) |
||||||||||||||||||||||||||||||||||||||||||||||||||||||||||||||||||
Interim results |
September 2016 |
Net cash |
1.1% |
Manager |
Tom Walker |
||||||||||||||||||||||||||||||||||||||||||||||||||||||||||||||||||
Year end |
31 January |
Annual mgmt fee |
0.5% |
Address |
Saltire Court, 20 Castle Terrace, |
||||||||||||||||||||||||||||||||||||||||||||||||||||||||||||||||||
Dividend paid |
Jul, Oct, Jan, Apr |
Performance fee |
See page 7 |
||||||||||||||||||||||||||||||||||||||||||||||||||||||||||||||||||||
Launch date |
March 1999 |
Trust life |
Indefinite |
Phone |
+44 (0)131 229 5252 |
||||||||||||||||||||||||||||||||||||||||||||||||||||||||||||||||||
Continuation vote |
None |
Loan facilities |
None |
Website |
|||||||||||||||||||||||||||||||||||||||||||||||||||||||||||||||||||
Dividend policy and history |
Share buyback policy and history |
||||||||||||||||||||||||||||||||||||||||||||||||||||||||||||||||||||||
MNP moved to paying quarterly dividends from FY14 (previously semi-annual). Dividends are paid in July, October, January and April. The board is committed to a progressive dividend policy over the longer term. |
Renewed annually, the trust has authority to purchase up to 14.99%, and allot up to 10% of issued share capital. Financial years shown, (2017 is year to date). |
||||||||||||||||||||||||||||||||||||||||||||||||||||||||||||||||||||||
|
|
||||||||||||||||||||||||||||||||||||||||||||||||||||||||||||||||||||||
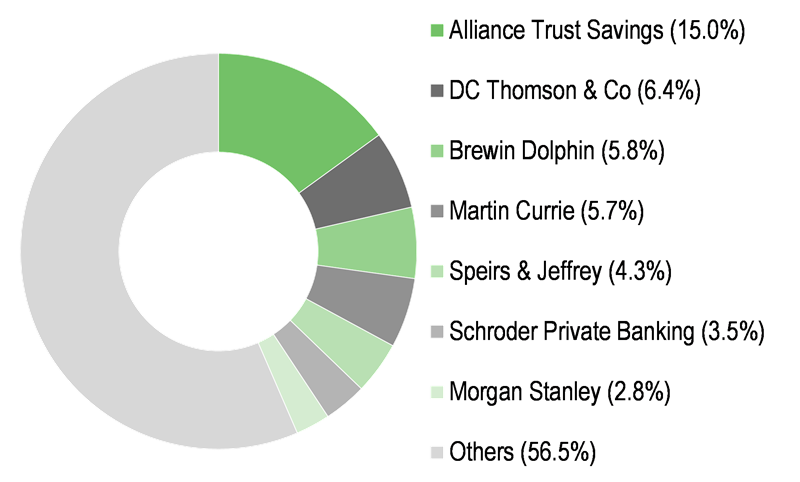
Shareholder base (as at 5 September 2016) |
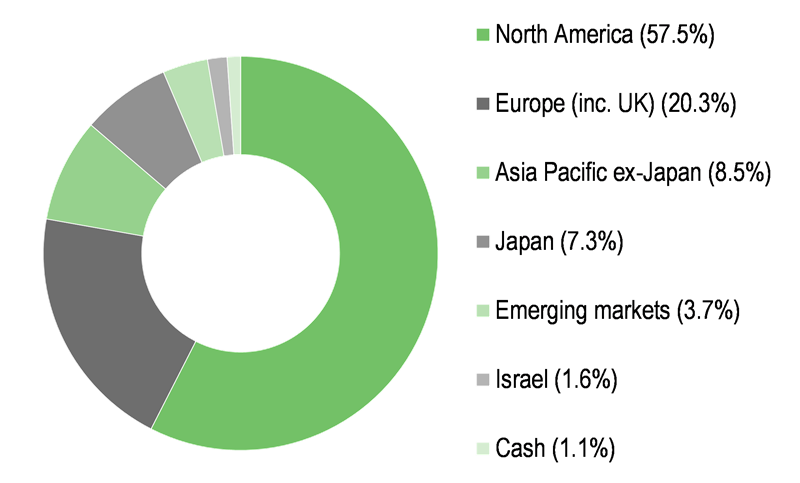
Portfolio exposure by geography (as at 31 July 2016) |
||||||||||||||||||||||||||||||||||||||||||||||||||||||||||||||||||||||
|
|
||||||||||||||||||||||||||||||||||||||||||||||||||||||||||||||||||||||
Top 10 holdings (as at 31 July 2016) |
|||||||||||||||||||||||||||||||||||||||||||||||||||||||||||||||||||||||
|
|||||||||||||||||||||||||||||||||||||||||||||||||||||||||||||||||||||||
Source: Martin Currie Global Portfolio Trust, Edison Investment Research, Bloomberg, Morningstar. Note: *N/A where not in July 2015 top 10.
Market outlook: Stocks likely driven by earnings
Reviewing the performance of world and UK stock markets over the last two years (Exhibit 2, left-hand side), share prices have rallied over the last three months following a period of heightened volatility, where concerns included slowing global growth, the pace and magnitude of US interest rate increases, weak commodity prices and the UK’s EU referendum. Record low interest rates have encouraged investors to purchase equities in the search for yield. In addition, the macroeconomic environment is more benign as commodity prices have firmed, there has been an improvement in Chinese economic data and recent corporate earnings have generally met or exceeded lower consensus expectations. As a result, share price valuations are less attractive now than earlier in 2016, a period characterised by heightened investor risk aversion.
Looking at the valuation of the Datastream World Index (Exhibit 2, right-hand side), the forward P/E multiple is towards the high end of the range of the last 10 years and, along with the price-to-book ratio, is above the average of the last 10 years. Its dividend yield is broadly in line with the 10-year average. However, its return on equity, while having rallied off of the lows during the depths of the global financial crisis, remains considerably below the average of the last 10 years. As valuation multiples have already expanded, further share price gains are likely to be dependent on earnings growth rather than revaluation.
|
Exhibit 2: Indices and valuation metrics |
|||||||||||||||||||||||||||||||
FTSE World and All-Share indices (total return) over last two years |
Datastream World Index 10-year valuation metrics (as at 19 August 2016) |
||||||||||||||||||||||||||||||
|
|
||||||||||||||||||||||||||||||
|
Source: Thomson Datastream, Edison Investment Research |
|||||||||||||||||||||||||||||||
Fund profile: Long-term investment in global equities
MNP invests in global equities, aiming for long-term capital growth in excess of the benchmark FTSE World Index. Prior to 1 June 2011, the benchmark was the FTSE All-Share Index, but it was changed following the removal of the international investment limit, which had been increased from 25% to 50% in 2007; the name of the trust was also changed from Martin Currie Portfolio. Historically, MNP invested in UK equities, international equities and private equity. The trust has been managed by Tom Walker since January 2000, drawing on the experience of a stable team of 59 investment professionals, who have average industry experience of 19 years. The portfolio is diversified by geography and sector and typically consists of c 60 primarily large-cap stocks (the current number of holdings is 53); there are no formal restrictions on country or sector exposure. MNP’s active share – a measure of how differentiated a portfolio is from an index – is high (88.8% at end-July 2016). Portfolio turnover is low, averaging c 25% per annum. A discount control mechanism has been in place since 2013 to ensure that in normal market conditions, the share price trades at or around NAV. Gearing up to 20% is permitted, but has not been utilised in recent years. The board is committed to a progressive dividend policy over the longer term.
The fund manager: Tom Walker
The manager’s view: Stocks can move higher
Tom Walker comments that following the Brexit vote, the weakness of sterling has been positive for the value of overseas equities and as a result MNP’s NAV has hit an all-time high. The trust has very little exposure to the UK; the UK equity holdings are typically international operators. The manager is not particularly bullish on UK and European economies, favouring stocks with exposure to the US and emerging markets including China. He expects the low growth environment to continue and US interest rates to stay low for an extended period, probably longer than the consensus view.
The manager suggests that stock markets are generally quite expensive as stock prices have risen higher than economic growth or corporate earnings would suggest. However, he is not bearish and suggests that stock markets can continue their upward moves given that interest rates remain low and cash has to find a home. He comments on rotation in the market – over the last six months there has been a bounce in cyclical and emerging market stocks – and suggests that this rotational environment is likely to continue, at least in the short term. He considers that consensus forward earnings growth of 8.3% may be too high, and that growth will be led by companies generating higher-quality secular earnings rather than from a cyclical rebound.
Asset allocation
Investment process: Detailed fundamental analysis
Manager Tom Walker is supported by Martin Currie’s team of 59 investment professionals. He aims to generate long-term capital growth from a diversified portfolio of global equities. Stocks are selected for their potential to outperform the broader market due to the company’s market positioning, superior earnings or assets or a valuation at a meaningful discount to its perceived worth. The manager and his team undertake detailed research on potential investments, including a five-year financial forecast aiming to identify factors that are not reflected in the current stock price. Share price targets are determined for each investment/potential investment and position sizes in the portfolio are a reflection of the estimated potential upside. The manager considers the macroeconomic environment, but the bulk of returns are expected to come from stock selection rather than country or sector allocation. He takes a long-term perspective, avoiding short-term noise in the stock markets. A position may be sold if the original investment thesis is no longer valid, the valuation target is achieved, to free up cash for a better investment proposition or for strategic sector shifts. The portfolio is regularly reviewed by an in-house risk-management team.
Current portfolio positioning
At the end of July 2016, MNP’s top 10 positions represented 32.0% of the portfolio. This was a modest increase from 30.2% at the end of July 2015. Over the last few months the number of holdings has been reduced from 60 to 53 as the manager has higher conviction in current positions.
A recent addition to the portfolio is Delphi Automotive, a US-listed, diversified supplier of automotive parts. Its share price had fallen because investors are nervous that the level of US auto sales may decline, but the manager believes that the current level can be maintained. Delphi has secular growth based around safety (electronic sensors), infotainment and the environment. It is growing the value of its content within vehicles, which Walker sees as a more important growth driver than the level of auto sales. Despite the low economic growth environment, recent Q2 results were strong; constant-currency revenue growth accelerated to 7% and earnings per share were up 19% year-on-year. The manager considers that Delphi’s stock price is attractively valued both on an absolute basis and versus the peer group.
Exhibit 3: Portfolio sector exposure vs FTSE World Index (% unless stated)
Portfolio end-July 2016 |
Portfolio end- July 2015 |
Change |
Index weight |
Active weight vs index (pts) |
Trust weight/ index weight (x) |
|
Financials |
18.7 |
23.9 |
-5.2 |
20.2 |
-1.5 |
0.9 |
Consumer services |
15.4 |
13.7 |
1.7 |
11.4 |
4.0 |
1.3 |
Technology |
14.6 |
11.3 |
3.3 |
11.7 |
2.9 |
1.2 |
Healthcare |
12.9 |
10.0 |
2.9 |
12.0 |
0.9 |
1.1 |
Industrials |
11.0 |
16.7 |
-5.7 |
12.5 |
-1.5 |
0.9 |
Telecommunications |
8.6 |
4.2 |
4.4 |
3.6 |
5.0 |
2.4 |
Consumer goods |
7.8 |
6.1 |
1.7 |
14.3 |
-6.5 |
0.5 |
Oil & gas |
5.1 |
6.8 |
-1.7 |
6.3 |
-1.2 |
0.8 |
Basic materials |
4.0 |
5.6 |
-1.6 |
4.6 |
-0.6 |
0.9 |
Utilities |
1.9 |
1.7 |
0.2 |
3.5 |
-1.6 |
0.5 |
100.0 |
100.0 |
100.0 |
Source: Martin Currie Global Portfolio Trust, Edison Investment Research
Over the last 12 months, the largest changes on a sector basis are reduced exposure to industrials and financials and higher exposure to telecoms and technology. The financials weighting is now lower than the index. Exposure to banks has been reduced as continued low interest rates are negatively affecting loan growth and net interest margins; HSBC and US super regional bank PNC have been divested. JPMorgan Chase remains one of the largest overweight positions in the portfolio. It has large operations in the US, the country that the manager believes is the best developed market banking environment; the company is generating loan growth, has a strong balance sheet (it has passed regulatory stress tests) and has recently increased its dividend. The stock is trading close to book value. Following a significant sell-off post the Brexit vote, the manager added to the position in Prudential. The insurance group trades in line with long-term interest rates, which declined sharply in the wake of the referendum. Prudential’s growth in Asia remains strong, the North American market is viewed as reasonable and the UK insurance business is still growing. These factors are considered to more than outweigh weakness in M&G, the UK asset management business. Prudential’s H116 results were higher than market expectations and the interim dividend was recently increased by 5%.
Exhibit 4: Portfolio geographic exposure vs FTSE World Index (% unless stated)
Portfolio end-July 2016 |
Portfolio end- July 2015 |
Change |
Index weight |
Active weight vs index (pts) |
Trust weight/ index weight (x) |
|
North America |
58.2 |
56.0 |
2.2 |
58.1 |
0.1 |
1.0 |
Europe (including UK) |
20.5 |
24.6 |
-4.1 |
22.0 |
-1.5 |
0.9 |
Asia-Pacific ex-Japan |
8.6 |
8.1 |
0.5 |
6.2 |
2.4 |
1.4 |
Japan |
7.4 |
6.9 |
0.5 |
8.8 |
-1.4 |
0.8 |
Emerging markets |
3.7 |
2.8 |
0.9 |
4.5 |
-0.8 |
0.8 |
Israel |
1.6 |
1.6 |
0.0 |
0.3 |
1.3 |
5.4 |
100.0 |
100.0 |
100.0 |
Source: Martin Currie Global Portfolio Trust, Edison Investment Research
All geographic changes over the last 12 months have been as a result of stock-specific reasons rather than for regional considerations. Higher exposure to North America means that MNP has closed its underweight position and now has a weighting in line with the benchmark. A new addition to the portfolio, and now a top 10 position, is US-listed payments technology company Visa. With the majority of global payments still made in cash, there is huge potential for long-term growth in electronic payments. In addition, Visa has recently completed the acquisition of Visa Europe, which will generate cost synergies and offers the potential to increase margins generated by the European business, which are considerably lower than Visa’s existing margins.
Performance: Long-term outperformance record intact
During FY16 (ending 31 January 2016), MNP’s NAV total return of 0.9% outperformed the benchmark total return of -0.1% (share price total return of -1.4%). The outperformance was a result of positive stock selection, as geographic and sector allocations netted out as neutral contributors. MNP measures its share price total return performance versus its peers over a rolling three-year period. In FY16, the peer group was a range of nine competitor funds within the AIC Global sector and 14 open-ended funds. For the period, MNP ranked 11th out of 24 funds. As shown in Exhibit 5 (right-hand side), absolute total returns of MNP’s share price and NAV have been strong in recent months. They have been helped by exposure to overseas assets in a period of sterling weakness following the result of the UK’s EU referendum.
|
Exhibit 5: Investment trust performance to 31 August 2016 |
|
Price, NAV and benchmark total return performance, one-year rebased |
Price, NAV and benchmark total return performance (%) |
|
|
|
Source: Thomson Datastream, Edison Investment Research. Note: Three, five and 10-year performance figures annualised. Benchmark changed from FTSE All-Share to FTSE World Index on 1 June 2011. |
|
MNP’s NAV total return and share price has outperformed the benchmark over 10 years, but has lagged over shorter time periods. As a reference for UK shareholders, MNP’s NAV and share price total return has meaningfully outperformed the FTSE All-Share Index over one, three, five and 10 years (Exhibit 6).
|
Exhibit 6: Share price and NAV total return performance, relative to index (%) |
|||||||
|
One month |
Three months |
Six months |
One year |
Three years |
Five years |
10 years |
Price relative to benchmark |
(0.5) |
0.0 |
(3.6) |
(1.9) |
(5.7) |
(0.2) |
15.3 |
NAV relative to benchmark |
0.2 |
(0.1) |
(1.8) |
(1.5) |
(4.9) |
(5.3) |
3.9 |
Price relative to FTSE World Index (£) |
(0.5) |
0.0 |
(3.6) |
(1.9) |
(5.7) |
(0.2) |
4.2 |
NAV relative to FTSE World Index (£) |
0.2 |
(0.1) |
(1.8) |
(1.5) |
(4.9) |
(5.3) |
(6.1) |
Price relative to FTSE All-Share Index |
(0.8) |
5.9 |
2.9 |
11.0 |
14.8 |
22.7 |
41.9 |
NAV relative to FTSE All-Share Index |
(0.1) |
5.8 |
4.9 |
11.5 |
15.8 |
16.4 |
27.9 |
|
Source: Thomson Datastream, Edison Investment Research. Note: Data to end-August 2016. Geometric calculation. |
|||||||
Exhibit 7 shows MNP’s NAV total return versus the benchmark over 10 years. There was a significant period of outperformance between January 2007 and July 2008, which was only partially given back before global markets started to rally in early 2009. In recent years performance has been hampered by an underweight exposure to the US market, which makes up more than 50% of the benchmark and has strongly outperformed the FTSE World Index over the last five years.
|
Exhibit 7: NAV performance relative to benchmark over 10 years |
|
|
Source: Thomson Datastream, Edison Investment Research |
Discount: Policy keeps discount in narrow band
MNP adopted a zero discount policy on 15 July 2013 to put the trust on a more equal footing with open-ended funds (where prices are directly linked to NAV). It issues shares when they are trading at a premium to NAV and repurchases shares when they are trading at a discount. As shown in Exhibit 8, the policy has kept the share price premium/discount to NAV in a narrow band over the last three years. The current discount of 0.3% compares to average discounts of 0.6% and 0.5% over the last one and three years, respectively. The spike in the discount to 5.4% on 27 June 2016 followed the result of the UK’s EU referendum, a period of market distortion when there was widespread selling of risk assets.
|
Exhibit 8: Share price premium/discount to NAV (including income) over three years (%) |
|
|
Source: Thomson Datastream, Edison Investment Research |
Capital structure and fees
MNP has one class of share; there are currently 97.4m ordinary shares outstanding. Renewed annually, it has the authority to repurchase 14.99% and allot up to 10% of its issued share capital. Gearing of up to 20% is permitted. Although the trust has not employed gearing since 2008, the current position is under review given the low level of interest rates and the manager’s long-term positive view on equities.
Martin Currie is paid an annual management fee of 0.5% of NAV, which is calculated quarterly. A performance fee is payable if the increase in NAV per share exceeds the capital return of the benchmark FTSE World Index by more than one percentage point over the period since a performance fee was last earned. If the NAV has risen over the period, the performance fee is 15% of the outperformance, or 7.5% if the NAV has fallen, capped at 1% of net assets. In line with the prior year, no performance fee was paid for FY16. The ongoing charges were 0.71%, a reduction of two basis points versus 0.73% in FY15.
Dividend policy and record
Since FY14, MNP has paid quarterly dividends in July, October, January and April. The board is committed to a progressive dividend policy over the longer term; dividends have been increased or maintained every year since the trust was launched in March 1999. The FY16 annual dividend of 4.15p was a 1.2% increase versus the prior year, and was fully covered by the net revenue return. Over the last five years dividends have compounded at an annual rate of 3.5%, which although lower than the compound annual growth rate since launch of 7.2%, is higher than the annual inflation rate of c 2.8% over the last 16 years (source: Bloomberg). The current dividend yield is 2.0%, which ranks favourably versus peers.
Peer group comparison
MNP is part of the AIC Global sector, which comprises 26 closed-ended funds. Exhibit 9 contains a selected peer group with a market cap greater than £100m, less than 30% exposure to the UK and more than 30% exposure to North America. MNP’s NAV total return is above the weighted peer group average over one year, ranking fourth out of eight funds; it is below the average over three, five and 10 years. In terms of risk-adjusted returns, as measured by the Sharpe ratio, MNP’s NAV total return is higher than the average over one year and lower over three years. As at 5 September 2016, MNP was one of only two trusts in the selected peer group trading at a premium. Its ongoing charge is modestly above the weighted average, and in absolute terms ranks fifth out of eight funds. MNP is the only trust in the selected peer group to charge a performance fee. Its dividend yield of 2.0% is the joint highest in the group; it is more than 40% higher than the peer group weighted average of 1.4% and c 75% higher than the simple average of 1.2%.
Exhibit 9: Selected peer group as at 5 September 2016
% unless stated |
Market cap £m |
NAV TR 1 Year |
NAV TR 3 Year |
NAV TR 5 Year |
NAV TR 10 Year |
Sharpe 1y (NAV) |
Sharpe 3y (NAV) |
Discount (ex-par) |
Ongoing charge |
Perf. fee |
Net gearing |
Dividend yield (%) |
Martin Currie Global Portfolio |
201.2 |
26.6 |
37.6 |
88.0 |
119.9 |
0.8 |
0.5 |
0.5 |
0.7 |
Yes |
100 |
2.0 |
Alliance Trust |
2,939.1 |
24.9 |
37.6 |
83.7 |
94.9 |
0.6 |
0.5 |
(9.9) |
0.7 |
No |
108 |
1.9 |
Edinburgh Worldwide |
238.2 |
19.1 |
37.1 |
88.8 |
143.8 |
0.2 |
0.4 |
(11.6) |
0.9 |
No |
106 |
0.0 |
F&C Global Smaller Companies |
613.8 |
19.3 |
45.0 |
126.9 |
184.3 |
0.2 |
0.6 |
(0.8) |
0.5 |
No |
105 |
1.0 |
Foreign and Colonial Inv. Trust |
2,736.9 |
23.7 |
42.8 |
93.7 |
124.7 |
0.6 |
0.7 |
(8.2) |
0.7 |
No |
106 |
2.0 |
Mid Wynd International |
120.3 |
26.6 |
51.2 |
78.9 |
148.6 |
0.8 |
0.9 |
4.5 |
0.8 |
No |
99 |
1.1 |
Monks |
1,069.2 |
27.7 |
31.3 |
56.7 |
102.2 |
0.7 |
0.3 |
(10.1) |
0.6 |
No |
105 |
0.3 |
Scottish Mortgage |
4,006.0 |
28.5 |
68.2 |
126.5 |
214.0 |
0.7 |
0.9 |
(0.0) |
0.5 |
No |
111 |
1.0 |
Weighted average |
25.7 |
49.0 |
100.3 |
149.0 |
0.6 |
0.7 |
(5.5) |
0.6 |
108 |
1.4 |
||
Rank |
7 |
4 |
5 |
5 |
6 |
2 |
5 |
2 |
5 |
7 |
1 |
Source: Morningstar, Edison Investment Research. Note: TR=total return. Sharpe ratio is a measure of risk-adjusted return. The ratios shown are calculated by Morningstar for the past 12- and 36-month periods by dividing a fund’s annualised excess returns over the risk-free rate by its annualised standard deviation. Net gearing is total assets less cash and equivalents as a percentage of net assets.
The board
There are four members on the MNP board; all are non-executive and independent of the manager. Chairman Neil Gaskell was appointed in November 2011 and took on his current role in May 2012. David Kidd is the senior independent director; he was appointed in October 2005. The other board members are Mike Balfour, appointed in January 2010, and Gillian Watson, appointed in April 2013. David Kidd has announced his intention to stand down at the June 2017 AGM; a search for his replacement is underway.
|
|