Martin Currie Asia Unconstrained Trust (MCP) adopted Martin Currie’s Asia Long-Term Unconstrained (ALTU) strategy in July 2014, aiming to generate returns in line with Asia-Pacific ex-Japan GDP growth. The trust has consistently traded at a wider discount than its peers, but the differential has recently narrowed following the board’s proposal on 4 April 2017 to increase the dividend meaningfully. Based on MCP’s end-FY17 ex-income NAV, the dividend yield would more than double, lifting the yield to c 4.5%. MCP has outperformed its Asian GDP growth benchmark since adopting the ALTU strategy and over shorter time periods, with particularly strong relative performance over the last 12 months, helped by sterling weakness.
Martin Currie Asia Unconstrained Trust |
Proposed increase in the dividend |
Investment trusts |
3 May 2017 |
Share price/discount performance
Three-year performance graph
Gearing
Analysts
|
|||||||||||||||||||||||||||||||||||||||||||||||||||||||||||||||||||||||||||||||||||||||||||||||||
Martin Currie Asia Unconstrained Trust (MCP) adopted Martin Currie’s Asia Long-Term Unconstrained (ALTU) strategy in July 2014, aiming to generate returns in line with Asia-Pacific ex-Japan GDP growth. The trust has consistently traded at a wider discount than its peers, but the differential has recently narrowed following the board’s proposal on 4 April 2017 to increase the dividend meaningfully. Based on MCP’s end-FY17 ex-income NAV, the dividend yield would more than double, lifting the yield to c 4.5%. MCP has outperformed its Asian GDP growth benchmark since adopting the ALTU strategy and over shorter time periods, with particularly strong relative performance over the last 12 months, helped by sterling weakness.
12 months ending |
Share price |
NAV |
Blended |
MSCI AC Asia ex-Japan (%) |
3Y GDP growth Asia ex-Japan (%) |
30/04/13 |
18.5 |
14.5 |
20.9 |
14.0 |
16.1 |
30/04/14 |
(11.6) |
(11.5) |
(7.5) |
(6.0) |
12.0 |
30/04/15 |
21.6 |
18.2 |
12.5 |
29.9 |
8.4 |
30/04/16 |
(11.6) |
(9.4) |
8.0 |
(14.3) |
8.0 |
30/04/17 |
41.9 |
35.9 |
9.4 |
37.5 |
9.4 |
Source: Thomson Datastream, IMF, Edison Investment Research. Note: All % on a total return basis in GBP. *Blended benchmark is MSCI AC Asia Pacific Index (Japan fixed at 40%) until 30 June 2008, MSCI AC Asia Pacific Index from 1 July 2008 to 30 June 2011, MSCI AC Asia Pacific Index (Japan fixed at 25%) from 1 July 2011 to 10 July 2014, and three-year rolling nominal Asian GDP growth from 11 July 2014.
Investment strategy: Unconstrained Asian exposure
The ALTU strategy aims to capture the superior growth of the Asia ex-Japan region, while mitigating some of the downside risks. MCP’s portfolio of 20-30 stocks is constructed through an initial screening followed by in-depth fundamental research. Potential investments are subject to an assessment of their corporate governance track records and a 40-60 page forensic accounting report. Portfolio positions are held for the long term, which lowers costs and allows the trust to benefit from the positive compounding effects of rising share prices. MCP has a £15m loan facility, which is partly drawn down. At end-March 2017, gross gearing was 4.4%.
Market outlook: Growth/valuation relatively attractive
Asian ex-Japan economic growth is relatively attractive versus the rest of the world; contributing factors include a rising middle class and low levels of household debt. Despite an element of rerating over the last several months, Asian equities remain attractively valued versus global equities. For investors wishing to gain exposure to Asia, a focused fund that offers the prospects of capital growth and an attractive level of income may hold some appeal.
Valuation: Recently narrowed discount
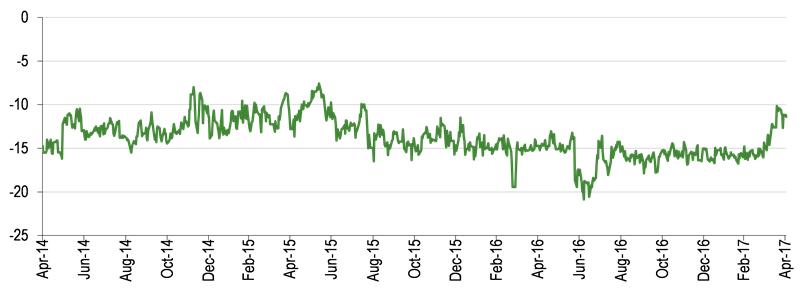
MCP’s current 11.4% share price discount to cum-income NAV is narrower than the averages of the last one, three, five and 10 years of 15.5%, 13.8%, 14.4% and 15.1%, respectively. The discount has narrowed meaningfully since the board’s announcement in early April 2017 that it proposes to change MCP’s dividend policy. Despite recent narrowing, MCP’s discount remains wider than the peer group average, suggesting scope for it to narrow further.
Martin Currie Asia Unconstrained Trust is a research client of Edison Investment Research Limited
Exhibit 1: Trust at a glance
Investment objective and fund background |
Recent developments |
||||||||||||||||||||||||||||||||||||||||||||||||||||||||||||||||||||||
Martin Currie Asia Unconstrained Trust aims to achieve returns commensurate with Asia ex-Japan nominal GDP growth, unconstrained by an equity benchmark, over a long-term time horizon from a concentrated portfolio of 20-30 stocks. Before its change of investment objective in July 2014, it invested in a pan-Asian portfolio with a benchmark of MSCI AC Asia Pacific (Japan fixed at 25%). |
■ 4 April 2017: Proposed change in dividend policy, subject to shareholder approval at July 2017 AGM. ■ 21 November 2016: Interim report for six months to 30 September 2016. NAV TR +18.2%, share price TR +16.4%. ■ 24 May 2016: Annual report for 12 months to 31 March 2016. NAV TR -7.9%, share price TR -10.3%. |
||||||||||||||||||||||||||||||||||||||||||||||||||||||||||||||||||||||
Forthcoming |
Capital structure |
Fund details |
|||||||||||||||||||||||||||||||||||||||||||||||||||||||||||||||||||||
AGM |
July 2017 |
Ongoing charges |
FY16 1.2% (see page 7) |
Group |
Martin Currie Investment Management |
||||||||||||||||||||||||||||||||||||||||||||||||||||||||||||||||||
Final results |
May 2017 |
Net gearing |
1.9% |
Manager |
Andrew Graham |
||||||||||||||||||||||||||||||||||||||||||||||||||||||||||||||||||
Year end |
31 March |
Annual mgmt fee |
Tiered, 0.60-0.75% of net assets |
Address |
Saltire Court, 20 Castle Terrace, Edinburgh EH1 2ES |
||||||||||||||||||||||||||||||||||||||||||||||||||||||||||||||||||
Dividend paid |
December and August |
Performance fee |
None |
||||||||||||||||||||||||||||||||||||||||||||||||||||||||||||||||||||
Launch date |
1985 |
Trust life |
Indefinite |
Phone |
0131 229 5252 |
||||||||||||||||||||||||||||||||||||||||||||||||||||||||||||||||||
Continuation vote |
Three-year, next in 2018 |
Loan facilities |
£15m (see page 7) |
Website |
|||||||||||||||||||||||||||||||||||||||||||||||||||||||||||||||||||
Dividend policy and history (financial years) |
Share buyback policy and history (financial years) |
||||||||||||||||||||||||||||||||||||||||||||||||||||||||||||||||||||||
MCP has recently proposed a change to its dividend policy (see details on page 7). Over the last five years the compound annual growth in dividends is 11.5%. |
MCP is authorised to repurchase up to 14.99% and allot up to 5% of its ordinary shares. A tender offer for 10% of the issued shares was made in July 2014. |
||||||||||||||||||||||||||||||||||||||||||||||||||||||||||||||||||||||
|
|
||||||||||||||||||||||||||||||||||||||||||||||||||||||||||||||||||||||
Shareholder base (as at 1 March 2017) |
Portfolio exposure by sector (as at 31 March 2017) |
||||||||||||||||||||||||||||||||||||||||||||||||||||||||||||||||||||||
|
|
||||||||||||||||||||||||||||||||||||||||||||||||||||||||||||||||||||||
Top 10 holdings (as at 31 March 2017) |
|||||||||||||||||||||||||||||||||||||||||||||||||||||||||||||||||||||||
|
|||||||||||||||||||||||||||||||||||||||||||||||||||||||||||||||||||||||
Source: Martin Currie Asia Unconstrained Trust, Edison Investment Research, Bloomberg, Morningstar. Note: *N/A where not in March 2016 top 10.
Market outlook: Relatively attractive growth/valuation
As shown in Exhibit 2 (left-hand side), economic growth forecasts are more favourable for Asia versus the rest of the world. In its April 2017 World Economic Outlook, the International Monetary Fund (IMF) forecast economic growth over the next six years for emerging and developing Asia of 6.3% per annum, which is considerably higher than the 3.7% annual estimate for world output. Factors favouring Asia include rising disposable income, which is benefiting consumer discretionary sectors such as online retail, growth in intra-Asian trade and relatively low levels of household debt. There are also measures being taken, which may make the region a more attractive investment proposition, such as significant goods and services tax reform in India and easier access to the Chinese stock market for foreign investors. While there was a rerating of Asian equities in recent months (Exhibit 2, right-hand side), they are still trading at an appreciable discount to world equities; the current 16.7% discount compares to the average 5.7% over the last 10 years. Investors seeking exposure to the Asia Pacific ex-Japan region may be attracted to a focused fund that offers potential for capital growth and also an attractive level of income.
|
Exhibit 2: Emerging Asia vs advanced and world markets – GDP growth and valuation metrics |
|
GDP growth rates – emerging Asia vs advanced economies and world |
DS Asia ex-Japan vs DS World valuation comparison |
|
|
|
Source: IMF WEO April 2017, Thomson Datastream, Edison Investment Research |
|
Fund profile: Concentrated exposure to Asia
Launched in 1985, MCP changed its benchmarks in 2008, 2011 and 2014 (see table note on page 1). The trust adopted Martin Currie’s ALTU strategy in July 2014; ALTU was launched in 2008, aiming to generate returns matching Asia ex-Japan rolling three-year GDP growth. The strategy now has c £2bn of assets under management; between 31 October 2008 and 31 March 2017 it has generated an annualised return of 14.9% (net of fees and expenses). ALTU is a high-conviction, long-only investment approach – the resulting concentrated portfolio consists of 20-30 stocks, which are held for the long term. MCP’s portfolio is diversified by sector and geography; a maximum 10% may be held in a single stock or any one company and up to 10% may be held in cash. The trust is managed by Andrew Graham, who heads Martin Currie Asia’s well-resourced and highly experienced investment team, comprised of seven portfolio managers and analysts.
The fund manager: Andrew Graham and team
The manager’s view: Macro data remain positive
Graham considers that the global and Asian economic environment is pretty favourable, as evidenced by indicators such as purchasing managers’ indices, earnings revisions and consumer/corporate confidence. He suggests that although the rate of positive change in data points may be peaking, for companies with sensible business models and strong balance sheets, the operating environment is generally good. The manager opines that if economic data continue to improve, there is greater potential for Asian equities to appreciate.
The manager comments that in Asia, earnings estimate revisions in aggregate have been positive since the start of 2017 and that the ratio of upgrades to downgrades is now the strongest in six and a half years, having turned positive in mid-2016. He considers this is important given the appreciation of Asian equities so far in 2017, as it means that Asian equity valuation multiples have remained pretty much in line with long-term averages and Asian stock markets continue to be relatively attractively valued versus other major markets such as the US and Europe.
Graham suggests that there is scope for investors to be disappointed by near-term economic growth in the US, where a significant element is based on proposed policy changes by president Trump. He states that in Asia, economic growth is largely a function of infrastructure spending, regulatory reforms and trade – highlighting that the largest percentage of Asia’s trade is within the Asian region itself, so if US growth forecasts are revised lower or the US introduces protectionist measures, it should not be a disaster for Asian trade in general.
Asset allocation
Investment process: Disciplined fundamental approach
The ALTU strategy starts with an initial screen of c 1,100 Asian equities that meet the manager’s liquidity requirements, seeking companies with a sustainable competitive advantage, that are generating stable returns above their cost of capital, growing their cash flow and where managements allocate capital efficiently. The resulting investible universe of c 200 companies is then analysed in detail, focusing on areas such as growth dynamics, competitive positions and company strategies. The corporate governance records of potential investments are assessed and each of the companies passing the assessment undergoes a forensic analysis of its company accounts. This involves a detailed review of five years of financial statements leading to an estimated intrinsic value of the underlying businesses, which is compared to the current company’s share price to establish the potential risk/reward. Meeting company managements is a key part of the investment process; the manager and his team conduct around 500 company meetings each year. As well as seeking potential new investments, the team regularly reviews current holdings to ensure that the original buy theses still hold true. Portfolio turnover is low; generally less than 30% per annum. The manager suggests that investing for the long term lowers costs and allows the positive effects of compounding to accrue to MCP’s shareholders.
Current portfolio positioning
At end-March 2017, MCP held 27 positions, similar to the prior year; its top 10 accounted for 52.9%, which was a modest increase in concentration versus 56.9% at end-March 2016 (seven holdings were common to both periods). In the last six months, there have been two new positions added to MCP’s portfolio: Coway (March 2017) and PT Matahari Department Store (November 2016) and one complete disposal: British American Tobacco Malaysia (January 2017).
Coway is a South Korean manufacturer of wellness appliances (water and air purification equipment) and service provider. Industry fundamentals are considered positive, with the underlying market growing at a mid-to-high single-digit rate per annum, and Coway is increasing its market share. So far, the majority of its revenues and profits have been generated domestically, but the company is developing operations elsewhere in Asia and the US. Coway is highly cash generative and has a dividend yield above 3%. The manager had monitored the company for the last few years, but deemed its valuation unattractive. Following a product recall in 2016 and questions about the company’s corporate governance, Coway’s share price retreated, providing MCP with an attractive buying opportunity. Having thoroughly researched the company and spoken to Coway’s management team, the manager felt confident in initiating a position; the stock has since rallied.
PT Matahari Department Store is Indonesia’s leading retailer, appealing to the middle- to upper-middle classes. Again, the manager had been monitoring the company for a long time, but considered its share price was too expensive. Disappointing results in Q316, which the manager considers was due to temporary factors, provided a buying opportunity as Matahari’s share price fell by c 40% between July and November 2016. The manager believes that the company is well run, with a strong balance sheet and a significant competitive advantage – due to the Indonesian geography, Matahari’s existing infrastructure would be tough for a competitor to replicate. He believes that the company’s earnings growth will resume over the next 12 months and that in the next four-to-five years Matahari could offer a dividend yield of 4-5%.
British American Tobacco Malaysia (BAT) was a very long-standing position in MCP’s portfolio. In Malaysia’s tobacco industry there are two sectors: a formal sector, including companies such as BAT, and an informal sector (illegal imports). The share of the informal sector in Malaysia has grown rapidly in recent years as the country has imposed large excise duties, and as a result BAT’s market share has declined – the Malaysian government has tried to curb the informal sector, but has been unsuccessful. The manager comments that BAT is a very well-run company, focused on cash generation, with a high return on capital (only investing in maintenance capex). Given that the company is hostage to the industry in which it operates, there is little more that it can do in terms of self-help. BAT has an attractive dividend yield of c 5%, but given its inability to grow revenue and profits, the manager sold the position; reinvesting the proceeds elsewhere in the portfolio.
|
Exhibit 3: Geographical exposure at 31 March 2017 |
Exhibit 4: Portfolio characteristics |
||||||||||||||||||||||||
|
|
||||||||||||||||||||||||
|
Source: Martin Currie Asia Unconstrained Trust, Edison Investment Research. Note: Net of gearing. |
Source: Martin Currie and UBS PAS, 31 March 2017. Note: *Indicates consensus. |
|
Exhibit 3: Geographical exposure at 31 March 2017 |
||||||||||||||||||||||||
|
||||||||||||||||||||||||
|
Source: Martin Currie Asia Unconstrained Trust, Edison Investment Research. Note: Net of gearing. |
||||||||||||||||||||||||
|
Exhibit 4: Portfolio characteristics |
||||||||||||||||||||||||
|
||||||||||||||||||||||||
|
Source: Martin Currie and UBS PAS, 31 March 2017. Note: *Indicates consensus. |
Exhibit 4, illustrates the quality bias of MCP’s portfolio; versus the MSCI AC Asia ex-Japan index – it has a higher P/E ratio and return on equity than the market index, and in aggregate, company balance sheets are stronger (net cash/equity rather than net debt/equity).
Performance: Outperformance over multiple periods
Since adopting the ALTU strategy in July 2014, MCP’s NAV volatility has been lower than the market. As shown in Exhibit 5, between October 2008 and March 2017, the ALTU strategy has had 4.6pp lower annual volatility than the MSCI AC Asia ex-Japan index. During this period, in the months that the market rallied, the strategy captured 75% of the upside (3.6% versus 4.8% average return) and only participated in 56% of the downside (-1.8% versus -3.2% average return).
Absolute returns to end-March 2017 are shown in Exhibit 6. Over the last 12 months MCP’s share price and NAV total returns of 41.9% and 35.9% respectively have been boosted by sterling weakness; they are considerably higher than the 9.4% benchmark return (sterling-based, three-year rolling nominal Asian GDP growth). Key contributors to performance in 2016 were Samsung and Tencent. Samsung has recovered from the Galaxy Note 7 product recall and posted very strong operational results, led by its semiconductor businesses, which have led to a succession of positive earnings revisions. Shareholders have also been encouraged by increased returns of capital via both higher dividends and a greater commitment to share repurchases. Tencent is a relatively new addition to MCP’s portfolio (May 2016); it is launching new apps, leading to its 850 million monthly active users spending more and more time in Tencent’s ecosystem, which the manager expects the company to be able to monetise over time.
|
Exhibit 5: ALTU NAV volatility and upside/downside participation to 31 March 2017 |
Exhibit 6: Price, NAV and blended benchmark total return performance (%) |
|
|
|
Source: Martin Currie Asia Unconstrained Trust. Note: ALTU strategy inception date is 31 October 2008. |
Source: Thomson Datastream, Martin Currie Asia Unconstrained Trust. Note: Three- and five-year and since change of strategy (SC) performance is annualised. Data to end-April 2017. |
|
Exhibit 5: ALTU NAV volatility and upside/downside participation to 31 March 2017 |
|
|
Source: Martin Currie Asia Unconstrained Trust. Note: ALTU strategy inception date is 31 October 2008. |
|
Exhibit 6: Price, NAV and blended benchmark total return performance (%) |
|
|
Source: Thomson Datastream, Martin Currie Asia Unconstrained Trust. Note: Three- and five-year and since change of strategy (SC) performance is annualised. Data to end-April 2017. |
MCP’s relative returns are shown in Exhibit 7 – given the change to the ALTU strategy, the three and five year records are less relevant, although the trust has outperformed its blended benchmark over three years. Helped by very strong performance over the last 12 months, MCP’s NAV total return has outperformed its benchmark by 12.8% since the change in strategy on 11 July 2014.
|
Exhibit 7: Share price and NAV total return performance, relative to indices (%) |
|||||||
|
One month |
Three months |
Six months |
One year |
SC |
Three years |
Five years |
Price relative to blended benchmark |
2.0 |
8.0 |
5.7 |
29.7 |
15.5 |
14.7 |
7.4 |
NAV relative to blended benchmark |
(2.1) |
2.9 |
1.1 |
24.2 |
12.8 |
9.4 |
(0.7) |
Price relative to MSCI AC Asia ex-Japan |
4.1 |
4.2 |
6.5 |
3.2 |
1.2 |
(0.4) |
(2.7) |
NAV relative to MSCI AC Asia ex-Japan |
(0.1) |
(0.7) |
1.8 |
(1.2) |
(1.2) |
(5.0) |
(10.1) |
Price relative to MSCI World |
4.8 |
7.7 |
4.5 |
8.7 |
(5.3) |
(2.7) |
(23.0) |
NAV relative to MSCI World |
0.5 |
2.7 |
(0.1) |
4.1 |
(7.5) |
(7.1) |
(28.9) |
|
Source: Thomson Datastream, Edison Investment Research. Note: Data to end-April 2017. Geometric calculation. SC = since change of investment objective on 11 July 2014. |
|||||||
Discount: Meaningful near-term narrowing
MCP’s current 11.4% share price discount to cum-income NAV is narrower than the 15.5% average of the last 12 months (range of 10.2% to 20.9%). It is also narrower than the averages of the last three, five and 10 years (range of 13.8% to 15.1%). As shown in Exhibit 8, the discount has narrowed meaningfully since early April 2017, when MCP proposed a change in its dividend policy (for more detailed information, please see the Dividend policy and record section). Given MCP’s discount remains wider than the peer group average (see Exhibit 9) and the proposed higher distribution policy would place its dividend yield among the highest in the peer group, there appears to be potential for the discount to narrow further.
|
Exhibit 8: Share price discount to NAV (including income) over three years (%) |
|
|
Source: Thomson Datastream, Edison Investment Research |
Capital structure and fees
MCP is a conventional investment trust with one class of share; there are currently 36.1m ordinary shares outstanding, with a further 3.4m held in treasury. Renewed annually, MCP has authority to repurchase up to 14.99% of its shares; the last time shares were repurchased was in mid-June 2016 (see Exhibit 1). MCP has a £15m loan facility with Royal Bank of Scotland, expiring on 31 August 2018, which gives scope for gearing of up to c 10%. Gross gearing stood at 4.4% at end-March 2017, while net gearing was 1.9%.
Since 2014, Martin Currie has been paid a management fee, calculated quarterly, at a rate of 0.75% pa of net assets up to £150m and 0.60% of net assets above £150m – no performance fee is payable. For FY16, ongoing charges were 1.2%, which was in line with FY15. Following the change to the ALTU strategy in 2014, MCP now faces a continuation vote once every three, rather than once every five years; the next vote is due in 2018.
Dividend policy and record
MCP pays dividends twice a year in December and August. In FY16, the annual dividend of 7.75p per share was a 3.3% increase versus the prior year. Over the last five years, the annual dividend has compounded at an annual rate of 11.5%. On 4 April 2017, MCP proposed a change to its dividend policy. Subject to shareholder approval at the July 2017 AGM, the final dividend (payable in August) will be supplemented by a distribution of capital of 2% of the financial year end (31 March) ex-income NAV. If approved, the first dividend under the new policy would be paid in August 2017. Based on the share price and ex-income NAV at 31 March 2017, the new dividend yield would be c 4.5%, which compares favourably with the majority of peers in the AIC Asia ex-Japan sector. The new dividend policy will not lead to any change in the investment policy and the board believes it should help to reduce and stabilise MCP’s discount, which would benefit existing shareholders and may also appeal to new investors seeking the prospect of both capital appreciation and income. The board reserves the right to review the distribution policy in the face of changing conditions, such as a financial year capital loss.
Peer group comparison
Exhibit 9 shows the trusts in the AIC Asia Pacific ex-Japan sector (with a market cap over £100m), which have a variety of mandates. With a market cap of £135m, MCP is one of the smallest trusts in the peer group. Its NAV total returns lag the averages over all the periods shown, but rank higher over one and three years, which broadly corresponds with the period since the change to the ALTU strategy. Following a recent narrowing of the discount, MCP now ranks seventh in the group; in our last report published in October 2016, the trust had the widest discount of all the peers. MCP has an ongoing charge and net gearing broadly in line with the sector averages, and if the proposed change to the dividend policy is approved, MCP’s dividend yield should rank firmly among the highest in the peer group.
Exhibit 9: AIC Asia Pacific ex-Japan peer group as at 27 April 2017
% unless stated |
Market cap £m |
NAV TR |
NAV TR |
NAV TR |
NAV TR 10 year |
Discount (ex-par) |
Ongoing charge |
Perf. |
Net gearing |
Dividend yield (%) |
Martin Currie Asia Unconstrained |
135.4 |
33.2 |
45.0 |
49.7 |
81.6 |
(9.8) |
1.2 |
No |
102 |
2.1 |
Aberdeen Asian Income |
384.4 |
28.8 |
32.8 |
50.8 |
194.9 |
(6.3) |
1.2 |
No |
109 |
4.3 |
Aberdeen Asian Smaller |
354.6 |
28.0 |
35.5 |
73.2 |
295.1 |
(12.0) |
1.8 |
No |
110 |
1.0 |
Aberdeen New Dawn |
247.7 |
37.9 |
37.3 |
51.9 |
161.8 |
(12.3) |
1.1 |
No |
110 |
1.8 |
Edinburgh Dragon |
634.3 |
35.6 |
42.3 |
54.5 |
175.9 |
(11.7) |
1.1 |
No |
108 |
1.0 |
Fidelity Asian Values |
266.7 |
35.8 |
73.4 |
100.3 |
214.4 |
(0.5) |
1.3 |
No |
103 |
1.1 |
Henderson Far East Income |
421.8 |
29.2 |
41.1 |
60.8 |
136.9 |
3.7 |
1.2 |
No |
102 |
5.6 |
Invesco Asia |
214.4 |
41.4 |
68.8 |
92.6 |
212.6 |
(10.8) |
1.0 |
No |
100 |
1.4 |
JPMorgan Asian |
287.4 |
45.9 |
63.9 |
74.6 |
116.3 |
(12.0) |
0.8 |
No |
100 |
4.5 |
Pacific Assets |
296.8 |
28.7 |
61.9 |
104.2 |
143.0 |
(0.5) |
1.3 |
No |
100 |
0.9 |
Pacific Horizon |
128.1 |
38.2 |
47.0 |
58.7 |
110.7 |
(11.7) |
1.1 |
No |
107 |
0.2 |
Schroder Asia Pacific |
642.6 |
43.4 |
67.5 |
79.9 |
197.9 |
(11.5) |
1.1 |
No |
105 |
1.2 |
Schroder Asian Total Return Inv. Co |
215.0 |
38.9 |
66.8 |
70.6 |
148.2 |
(3.7) |
1.0 |
Yes |
109 |
1.6 |
Schroder Oriental Income |
577.0 |
29.8 |
50.8 |
82.7 |
201.3 |
1.5 |
0.9 |
Yes |
100 |
3.6 |
Scottish Oriental Smaller Cos |
309.6 |
30.6 |
49.1 |
90.7 |
305.8 |
(12.6) |
1.0 |
Yes |
106 |
1.2 |
Average |
341.1 |
35.0 |
52.2 |
73.0 |
179.7 |
(7.3) |
1.1 |
105 |
2.1 |
|
Rank in sector (out of 15 trusts) |
14 |
9 |
10 |
15 |
15 |
7 |
4 |
10 |
5 |
Source: Morningstar, Edison Investment Research. Note: TR=total return. Net gearing is total assets less cash and equivalents as a percentage of net assets.
The board
There are five directors on the board of MCP; all are non-executive and independent of the manager. Chairman Harry Wells was appointed in 2003 and assumed his current role in 2014. The senior independent director is Gregory Shenkman, he was appointed in 2007. Anja Balfour was appointed in 2012 and is chairman of the audit committee. The other two directors are Peter Edwards (appointed in 2007) and Martin Shenfield (appointed in 2015). The board members have backgrounds in finance, investment and law.
|
|
Research: Industrials
Nabaltec has proved itself able to deliver revenue growth significantly ahead of the German chemical industry as a whole by concentrating on those applications benefiting from rising demand. Through a sustained programme of investment in capacity and product development and a reputation for quality, it has become the global leader in fine precipitated aluminium hydroxide used as environmentally friendly flame retardants.