Last close As at 05/08/2026
GBP3.78
▲ 4.00 (1.07%)
Market capitalisation
GBP1,342m
Research: Investment Companies
Worldwide Healthcare Trust (WWH) is celebrating its 25th anniversary. Managed by Sven Borho and Trevor Polischuk at OrbiMed, the trust has an enviable absolute and relative performance track record. The managers remain very constructive on the prospects for the global healthcare sector, suggesting that while President Trump has once again focused on the issue of US drug pricing, his ‘bark is worse than his bite’, and his efforts are a negotiating ploy to get the healthcare industry to the table to discuss reforms. They highlight minimal disruptions at the US Food and Drug Administration (FDA) as a result of the coronavirus, and expect an uptick in industry mergers and acquisitions (M&A) in H220 and beyond.
Worldwide Healthcare Trust |
Marking 25 years with strong performance |
Investment trusts |
30 July 2020 |
Share price/discount performance
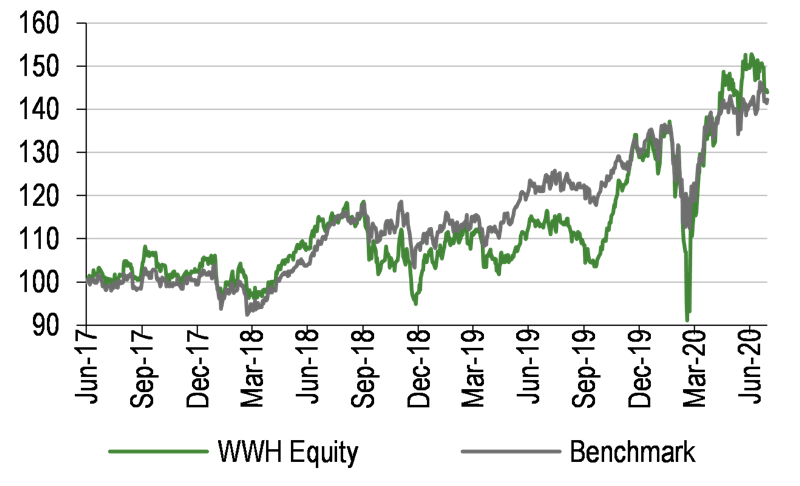
Three-year performance vs index
Gearing
Analysts
|
|||||||||||||||||||||||||||||||||||||||||||||||||||||||||||||||||||||||||||||||||||||||||||
Worldwide Healthcare Trust (WWH) is celebrating its 25th anniversary. Managed by Sven Borho and Trevor Polischuk at OrbiMed, the trust has an enviable absolute and relative performance track record. The managers remain very constructive on the prospects for the global healthcare sector, suggesting that while President Trump has once again focused on the issue of US drug pricing, his ‘bark is worse than his bite’, and his efforts are a negotiating ploy to get the healthcare industry to the table to discuss reforms. They highlight minimal disruptions at the US Food and Drug Administration (FDA) as a result of the coronavirus, and expect an uptick in industry mergers and acquisitions (M&A) in H220 and beyond.
|
WWH AGM video with manager Sven Borho |
|
|
Source: Worldwide Healthcare Trust |
The market opportunity
Healthcare stocks have performed better than the global market over the long term and, due to a favourable industry backdrop, there is potential for this to continue. Demand is robust, innovation is at an elevated level, until very recently the political environment has been more benign and there could be an acceleration in M&A, which should be supportive for the sector’s performance.
Why consider investing in WWH?
■
Well-established trust offering diversified exposure to the global healthcare sector across the market cap spectrum.
■
Strong absolute results – NAV and share price total returns of c 20% pa over the past decade and outperformance versus the MSCI World Health Care Index over the past one, three, five and 10 years.
■
Experienced managers, able to draw on the resources of industry specialist OrbiMed’s large investment team.
Regularly trading close to NAV
WWH’s shares regularly trade close to NAV. The current 1.1% premium to cum-income NAV compares to a range of an average 0.3% premium to an average 3.8% discount over the past one, three, five and 10 years. While the trust aims to generate long-term capital growth, it also pays semi-annual dividends. Based on its current share price, WWH offers a 0.7% yield.
Exhibit 1: Trust at a glance
Investment objective and fund background |
Recent developments |
|||||||||||||||||||||||||||||||||||||||||||||||||||||||||||||||||||
Worldwide Healthcare Trust’s investment objective is to invest worldwide in pharmaceutical, biotechnology and related securities in the healthcare sector to achieve a high level of capital growth. Gearing and derivative transactions are used to mitigate risk and enhance capital returns. |
■ 3 June 2020: Annual results to 31 March 2020. NAV TR +6.5% versus benchmark TR +5.7%, share price TR +8.0%. ■ 28 May 2020: Announcement of second interim dividend of 18.5p per share ■ 20 November 2019: Six-month results to 30 September 2019. NAV TR -2.7% versus benchmark TR +6.0%, share price TR -2.7%. ■ 14 November 2019: Announcement of first interim dividend of 6.5p per share (unchanged year-on-year). |
|||||||||||||||||||||||||||||||||||||||||||||||||||||||||||||||||||
Forthcoming |
Capital structure |
Fund details |
||||||||||||||||||||||||||||||||||||||||||||||||||||||||||||||||||
AGM |
July 2021 |
Ongoing charges |
0.9% |
Group |
Frostrow Capital LLP (AIFM) |
|||||||||||||||||||||||||||||||||||||||||||||||||||||||||||||||
Interim results |
November 2020 |
Net cash |
2.8% |
Manager |
OrbiMed Advisors LLC |
|||||||||||||||||||||||||||||||||||||||||||||||||||||||||||||||
Year end |
31 March |
Annual mgmt fee |
See page 8 |
Address |
25 Southampton Buildings, London, WC2A 1AL, UK |
|||||||||||||||||||||||||||||||||||||||||||||||||||||||||||||||
Dividend paid |
January, July |
Performance fee |
See page 8 |
|||||||||||||||||||||||||||||||||||||||||||||||||||||||||||||||||
Launch date |
April 1995 |
Trust life |
Indefinite |
Phone |
+44 (0)20 3008 4910 |
|||||||||||||||||||||||||||||||||||||||||||||||||||||||||||||||
Continuation vote |
Five-yearly, next in 2024 |
Loan facilities |
Up to 20% of net assets |
Website |
||||||||||||||||||||||||||||||||||||||||||||||||||||||||||||||||
Dividend policy and history (financial years) |
Share buyback policy and history (financial years) |
|||||||||||||||||||||||||||||||||||||||||||||||||||||||||||||||||||
In line with the requirement for investment trusts to pay out 85% of their income net of expenses, two interim dividends a year are paid in January and July. |
The trust has authority to purchase up to 14.99% and allot up to 10% of issued share capital. |
|||||||||||||||||||||||||||||||||||||||||||||||||||||||||||||||||||
|
|
|||||||||||||||||||||||||||||||||||||||||||||||||||||||||||||||||||
Shareholder base (as at 30 June 2020) |
Portfolio exposure by geography (as at 30 June 2020) |
|||||||||||||||||||||||||||||||||||||||||||||||||||||||||||||||||||
|
|
|||||||||||||||||||||||||||||||||||||||||||||||||||||||||||||||||||
Top 10 holdings (as at 30 June 2020) |
||||||||||||||||||||||||||||||||||||||||||||||||||||||||||||||||||||
|
||||||||||||||||||||||||||||||||||||||||||||||||||||||||||||||||||||
Source: WWH, Edison Investment Research, Bloomberg, Morningstar. Note: *N/A where not in end-June 2019 top 10.
Market outlook: Favourable industry backdrop
Over the past decade, investors have been well served by investing in healthcare stocks, as they have significantly outperformed the global market (Exhibit 2, LHS). While not immune to the coronavirus-led stock market sell-off earlier this year, healthcare stocks have bounced back strongly in recent months. Industry fundamentals remain very favourable due to secular demand growth driven by an ageing global population and rising disposable income in emerging markets. There is a high level of innovation as healthcare companies are working to address unmet medical needs, the regulatory environment is supportive with a high number of drug approvals, and an acceleration in M&A could also support the relative performance of healthcare stocks. Given the healthcare industry’s efforts to find treatments and cures for COVID-19, general sentiment towards the sector has shifted and become more favourable, although recently President Trump has once again focused on the issue of US drug pricing following his slide in the opinion polls due to his handling of the coronavirus crisis.
Absolute and relative valuations of global pharma stocks, which are by far the largest subsector of the healthcare industry, are shown in Exhibit 2 (RHS). The Datastream World Pharma index is trading on a forward P/E multiple of 16.2x, which is modestly higher than its 15.9x five-year average. Pharma stocks are trading at a 16.5% discount to the world market, which compares with a 4.6% average premium over the past five years. However, the higher P/E multiples in the wider market may be a function of depressed corporate earnings due to the coronavirus pandemic. Given the favourable industry backdrop and a more benign political attitude to the sector, investors may continue to benefit from an allocation to healthcare stocks.
|
Exhibit 2: Market performance and valuation |
|
MSCI World Health Care and MSCI World indices total returns (£) |
Absolute and relative forward P/E multiple for DS World Pharma index |
|
|
|
Source: Refinitiv, Edison Investment Research. Note: Valuation data as at 29 July 2020. |
|
Fund profile: Celebrating its 25th anniversary
Launched in 1995, WWH is traded on the Main Market of the London Stock Exchange. It is managed by OrbiMed, which is one of the largest global specialist healthcare investors. The firm has 11 regional offices with a team of more than 100 investment professionals, of whom 30 hold PhD or MD qualifications and 15 are former CEOs or company founders. OrbiMed has more than $13bn of assets under management, including c $5bn in public equities. Managers Sven Borho and Trevor Polischuk invest in the global healthcare sector, aiming to achieve a high level of capital growth. WWH is subject to a series of investment guidelines and limits:
■
a maximum 15% of the portfolio in any one individual stock at the time of acquisition;
■
at least 50% of the portfolio will normally be invested in larger companies (market cap at or above $10bn), with at least 20% in smaller companies (market cap less than $10bn);
■
a maximum 10% in unquoted securities at the time of acquisition;
■
up to 5% of the portfolio, at the time of acquisition, may be invested in each of debt instruments, convertibles and royalty bonds issued by pharma and biotech companies; and
■
a maximum of 30% of the portfolio, at the time of acquisition, may be invested in companies in each of the following subsectors: healthcare equipment and supplies, and healthcare providers and services.
The use of derivatives is permitted to enhance returns and mitigate risk, currency exposure is unhedged, and the managers may gear up to 20% of net assets; at end-June 2020, the trust had a net cash level of 2.8%. WWH’s performance is benchmarked against the MSCI World Health Care Index (sterling-adjusted). Data from OrbiMed show that from the trust’s inception in 1995 to 30 June 2020, its NAV total return has compounded at a rate of +16.3% pa, which is considerably ahead of the blended benchmark’s total return of +12.2% pa.
The fund managers: Sven Borho and Trevor Polischuk
The manager’s view: Favourable industry attributes
Polischuk explains that stock market volatility in March 2020 was severe due to the coronavirus pandemic, but WWH’s managers exercised patience rather than chasing the next cure or treatment for COVID-19. However, the trust’s performance has benefited from some of its holdings including CanSino Biologics, which is developing a vaccine for the virus, and Gilead Sciences, whose drug remdesivir is being used as a treatment for the disease. Polischuk says that in response to the pandemic there were more than 1,100 COVID-19 trials underway in less than three months, an uptick in diagnostic approvals at the US FDA and around 100 vaccine programmes commenced.
The manager comments that before President Trump’s recent re-focus on US drug pricing there had been a ‘dramatic’ shift in sentiment towards the healthcare industry with reduced headwinds and increased tailwinds, partially due to the COVID-19 outbreak, and it was ‘no longer considered on a par with the tobacco or big oil sectors’. The initial view on the healthcare industry was that it was ‘profits over patients’, but collaborative support in response to the pandemic has changed the general perception. In terms of politics, Joe Biden’s success at securing the position of Democratic candidate for the November 2020 US presidential election was seen as a pivotal win for the healthcare industry. Polischuk believes that whether Trump or Biden is elected president, the status quo should be maintained, and that universal healthcare coverage (Medicare for All) is essentially a zero probability. With regard to drug price proposals, the manager suggests that whether the next president is a Republican or a Democrat, they will ultimately be unable to ‘bash the healthcare industry’, given its investment throughout the pandemic.
While the stock market is pricing in a V-shaped economic recovery, Polischuk considers this is unlikely. He explains that during past recessions, healthcare proved to be a defensive sector. While there has been some disruption to clinical trials as a result of the virus outbreak, the FDA has remained active. The manager believes that large healthcare companies’ dividends are secure due to strong cash-flow generation, and it is ‘business as usual for a lot of the industry’. M&A has traditionally been an important theme within the sector, and Polischuk says that while activity had dwindled, he expects an inflexion in the number of deals, citing anecdotal demand for emerging biotech companies. Despite the coronavirus, there has been no slowdown in FDA drug approvals in 2020 (25 in H120), which follows the most productive period ever, with 48 novel drug approvals in 2019, 59 in 2018 and 46 in 2017. The manager explains that innovation remains the driver for the healthcare industry. With so many novel platforms, such as antibody-drug conjugates, bispecific antibodies, immunotherapy and targeted therapies, he describes it ‘a golden era’ for indications that previously lacked treatments. Polischuk says that many of the 2019 drug approvals are ‘mega-blockbuster with multi-billion-dollar annual sales potential’.
Asset allocation
Investment process: Disciplined, bottom-up stock selection
The managers are able to draw on the broad resources of OrbiMed’s investment team. They select stocks on a bottom-up basis, aiming to generate long-term capital growth. OrbiMed has employed a Public Equity Portfolio Review process since 2009. Using this framework, the team meets regularly to discuss WWH’s portfolio structure and individual holdings; this has continued during the pandemic when all staff have been working from home. Topics include clinical events, which have historically been the largest source of biotech and pharma share price volatility; regulatory events; new drug launches; doctor surveys; key opinion leader consultations and other field research. Company meetings are a very important element of the investment process.
WWH’s portfolio is diversified by geography, subsector and market cap, although more than 60% of the fund is invested in US companies, reflecting the country’s dominance in the global healthcare industry. Stocks are selected from an investible universe of around 1,000 companies, from early-stage preclinical businesses through to multinational biopharmaceutical firms. The managers seek companies with underappreciated product pipelines, robust balance sheets, strong management teams, and which are trading on reasonable valuations. At end-June 2020, WWH had 73 positions, the same number as a year earlier.
In FY20, the largest contribution to WWH’s total returns came from its investments in emerging markets, particularly in China. Changes to the country’s initial public offering (IPO) rules mean non-profitable biotech firms can now become publicly listed companies. The trust participated in many of these IPOs, including becoming a cornerstone investor, such as with CanSino Biologics. Within China, WWH also invests in blue-chip companies such as Aier Eye Hospital, Jiangsu Hengrui, and Jinxin Fertility. The managers are able to hold unlisted companies; at end-FY20, 1.0% of the portfolio was invested in pre-IPO companies (0.5% at end-FY19), while overall exposure to unquoted securities was 1.7% (1.8% at end-FY19).
Current portfolio positioning
At end-June 2020, WWH’s top 10 positions made up 39.2% of the portfolio, somewhat less concentrated than 44.2% a year earlier; six positions were common to both periods. Looking at the breakdown of the fund in Exhibit 3, over the past 12 months the largest changes on a subsector basis are higher weightings to biotechnology (+11.0pp), and healthcare providers and services (+4.9pp), with lower exposures to healthcare equipment and supplies (-6.4pp) and pharmaceuticals (5.2pp). On a regional basis, there is a higher emerging market weighting (+6.2pp), helped by the region’s outperformance, with lower exposure to developed Asia (-5.7pp), which includes the sale of Japanese company Chugai Pharmaceutical.
Exhibit 3: Portfolio sector and geographic exposure (%)
Sector |
End-June 2020 |
End-June 2019 |
Diff. (pp) |
Region |
End-June 2020 |
End-June 2019 |
Diff. (pp) |
|
Biotechnology |
39.3 |
28.3 |
11.0 |
North America |
62.6 |
63.6 |
(1.0) |
|
Pharmaceuticals |
29.0 |
34.2 |
(5.2) |
Emerging markets |
20.5 |
14.3 |
6.2 |
|
Healthcare providers/services |
13.3 |
8.4 |
4.9 |
Europe |
12.6 |
12.1 |
0.5 |
|
Healthcare equip/supplies |
13.1 |
19.5 |
(6.4) |
Developed Asia |
4.3 |
10.0 |
(5.7) |
|
Life science tools & services |
4.9 |
6.3 |
(1.4) |
|||||
Fixed & variable interest |
0.4 |
1.1 |
(0.7) |
|||||
Emerging markets baskets |
0.0 |
2.2 |
(2.2) |
|||||
100.0 |
100.0 |
100.0 |
100.0 |
Source: WWH, Edison Investment Research
In recent months Borho and Polischuk have been upgrading the quality of WWH’s portfolio. They have increased the trust’s large-cap pharma exposure due to the changing political landscape, along with a higher weighting to large-cap and emerging biotech. Exposure to healthcare providers and services was increased as the managers took advantage of severe share price weakness, especially in hospitals, during the coronavirus-led stock market sell-off. Borho and Polischuk have taken profits in life-science tools and reduced WWH’s exposure to medtech, Japan and emerging markets (including CanSino Biologics). Large-cap biotech companies Gilead Sciences and Regeneron Pharmaceuticals are two more recent disposals from the portfolio; both of these companies’ share prices had rallied, helped by their active COVID-19 programmes.
Performance: Solid long-term outperformance
Exhibit 4: Five-year discrete performance data
12 months ending |
Share price |
NAV |
MSCI World |
DS World Pharma and Biotech (%) |
CBOE UK All Companies (%) |
30/06/16 |
(0.4) |
3.7 |
12.8 |
9.4 |
1.7 |
30/06/17 |
33.1 |
20.6 |
13.6 |
10.4 |
18.3 |
30/06/18 |
8.0 |
8.0 |
3.7 |
2.5 |
9.5 |
30/06/19 |
3.1 |
3.8 |
15.6 |
12.0 |
0.3 |
30/06/20 |
34.2 |
33.6 |
17.9 |
22.2 |
(13.6) |
Source: Refinitiv. Note: All % on a total return basis in pounds sterling.
|
Exhibit 5: Investment trust performance to 30 June 2020 |
|
Price, NAV and benchmark total return performance, one-year rebased |
Price, NAV and benchmark total return performance (%) |
|
|
|
Source: Refinitiv, Edison Investment Research. Note: Three, five and 10-year performance figures annualised. Benchmark is DS World Pharma & Biotech Index until 30 September 2010 and MSCI World Health Care Index thereafter. |
|
During FY20 (ending 31 March), WWH’s NAV and share price total returns of +6.5% and +8.0%, respectively, were ahead of the benchmark’s +5.7% total return. The reporting period was essentially a year of two halves; in H120 the trust’s NAV total return was -2.7% (underperforming the benchmark by 8.7pp), while in H220 it was +9.5% (outperforming by 9.5pp). During FY20, WWH was underweight large-cap pharma and biotech companies, and overweight emerging markets and emerging biotech stocks. This strategy was detrimental in H120, as investors favoured large-cap pharma stocks over emerging biotech stocks during a period of market instability. However, the mood changed in H220, particularly in Q320 (calendar Q419) as investors refocused on industry fundamentals, and emerging biotech and emerging market stocks performed particularly strongly. Holdings in medtech companies and healthcare services firms were also positive contributors, while positions in life-science tools, speciality pharma, generics and Japanese companies detracted from the trust’s returns. WWH’s performance was also boosted by sterling weakness and the use of gearing.
The top contributors to WWH’s relative returns in FY20 were: CanSino Biologics (a Chinese company, which, among other opportunities, is developing a vaccine for COVID-19); eHealth (a US insurance broker specialising in enrolling individuals in the Medicare Advantage programme; it is the only broker that has significant online enrolment capability); and ArQule (a biotech company that received a takeover approach from Merck at a 130% premium to its pre-bid share price). Positions detracting from performance included: Alexion Pharmaceuticals (a large-cap biotech company where investors are concerned about competition to its lead products eculizumab and ravulizumab); Takeda Pharmaceutical (its shares sold off during the coronavirus-led stock market weakness, due to the company’s high level of debt incurred through its acquisition of Shire Pharmaceuticals); and Puma Biotechnology (which had a disappointing launch of its drug neratinib for breast cancer, due to adverse side effects). The trust’s managers are active in addressing underperforming positions; of the top 10 detractors in FY20, eight have been exited.
Exhibit 6: Share price and NAV total return performance, relative to indices (%)
|
One month |
Three months |
Six months |
One year |
Three years |
Five years |
10 years |
Price relative to MSCI World Health Care |
3.2 |
8.0 |
6.3 |
13.9 |
5.8 |
9.4 |
39.5 |
NAV relative to MSCI World Health Care |
2.3 |
9.5 |
7.6 |
13.3 |
6.0 |
3.4 |
26.3 |
Price relative to World-DS Pharm & Bio |
1.5 |
7.1 |
2.2 |
9.8 |
6.5 |
16.9 |
50.1 |
NAV relative to World -DS Pharm & Bio |
0.6 |
8.6 |
3.4 |
9.3 |
6.7 |
10.5 |
35.9 |
Price relative to CBOE UK All Cos |
0.0 |
12.7 |
41.4 |
55.4 |
57.6 |
73.6 |
232.1 |
NAV relative to CBOE UK All Cos |
(0.9) |
14.3 |
43.1 |
54.6 |
57.9 |
64.0 |
200.7 |
Source: Refinitiv, Edison Investment Research. Note: Data to end-June 2020. Geometric calculation.
WWH has generated solid long-term total returns, +19.2% pa in NAV terms and +20.4% pa in share price terms over the past decade. Total returns over the past 12 months have been particularly strong (NAV +33.6% and share price +34.2%) against a challenging market backdrop. In the first quarter of FY21 (ending 30 June), positive contributors to returns included speciality pharma company Horizon Therapeutics and Chinese liquid biopsy firm Burning Rock.
The trust’s relative returns are illustrated above in Exhibit 6. It has outperformed all the indices highlighted across all but one period shown. Particularly notable is how well WWH has performed versus the UK market.
|
Exhibit 7: NAV total return performance relative to benchmark over 10 years |
|
|
Source: Refinitiv, Edison Investment Research |
Discount: Back to trading close to NAV
In keeping with many other investment trusts, WWH’s valuation was very volatile during the coronavirus-led market sell-off, reaching a decade-widest discount of 16.4% on 19 March. It also traded at a discount in October and November 2019 as the trust’s NAV rallied strongly and its shares failed to keep up. However, WWH’s shares are now back trading close to NAV. The current 1.1% premium to cum-income NAV compares to an average 0.2% discount, 0.3% premium, 1.5% discount and 3.8% discount over the past one, three, five and 10 years, respectively.
WWH’s board implemented a discount control mechanism in 2004, aiming to ensure a maximum 6% share price discount to ex-income NAV in normal market conditions. It has the authority, renewed annually, to repurchase up to 14.99% and allot up to 10% of issued share capital. In FY20, c 1.0m shares (1.9% of the share base) were issued at an average 0.8% premium to cum-income NAV, raising £29.4m. Issuance has accelerated considerably so far in FY21 (see Exhibit 1).
|
Exhibit 8: Share price premium/discount to NAV (including income) over three years (%) |
|
|
Source: Refinitiv, Edison Investment Research |
Capital structure and fees
WWH is a conventional investment trust with one class of share; there are currently 57.9m ordinary shares in issue. It has an overdraft facility with JP Morgan Securities and gearing of up to 20% of NAV is permitted; at end-June 2020, the trust had a net cash level of 2.8%. WWH’s NAV and share price have risen significantly in a short space of time, and the managers are wary of near-term market volatility due to investor sentiment on COVID-19, the potential of a second wave of infections and a large increase in retail investor participation in the stock market. As such, they are awaiting a better opportunity to utilise the trust’s gearing facility.
OrbiMed is paid a base management fee of 0.65% of NAV and is eligible for a 15% performance fee for outperformance versus the benchmark (on incremental outperformance since launch, if it has been maintained for a 12-month period). Frostrow Capital is WWH’s alternative investment fund manager and is paid a tiered fee: 0.3% of the trust’s market cap up to £150m, 0.2% on £150m to £500m, 0.15% on £500m to £1bn, 0.125% on £1bn to £1.5bn, and 0.075% over £1.5bn, along with a £57,500 pa fixed fee. In FY20, WWH’s ongoing charge was 0.9%, which was in line with FY19; there were no performance fees (in FY19 the ongoing charge including the performance fee element was 1.1%).
Dividend policy and record
WWH pays semi-annual dividends in January and July. The FY20 total dividend of 25.0p per share (c 1.1x covered) was 5.7% lower year-on-year. Despite sterling weakness, net revenue return for the period decreased by a modest 1.3%, partly due to a lower exposure to higher-yielding stocks. At the end of FY20, WWH had revenue reserves of £18.3m, which after allowing for the first interim dividend payment of c £3.5m, is equivalent to more than 1x the total FY20 payment. Based on its current share price, WWH offers a 0.7% dividend yield.
Peer group comparison
WWH is a member of the AIC Biotechnology and Healthcare sector. In Exhibit 9, we highlight its five well-established peers and two Switzerland-listed funds, BB Biotech and HBM Healthcare Investments, to enable a broader comparison. WWH’s NAV total returns are above average over the past 12 months (ranking third out of eight funds) and five years (ranking second out of seven), while lagging over the past three years and past decade. On the date shown, the trust was one of seven funds trading at a premium to NAV. WWH’s ongoing charge is the lowest in the selected peer group, although a performance fee may be payable. The trust is currently ungeared and its dividend yield is 1.3pp below the mean, although it should be noted that the four peers with the highest yields pay dividends out of capital.
Exhibit 9: Selected peer group as at 29 July 2020*
% unless stated |
Market cap £m |
NAV TR |
NAV TR |
NAV TR |
NAV TR |
Discount (cum-fair) |
Ongoing charge |
Perf. |
Net |
Dividend yield (%) |
Worldwide Healthcare Trust |
2,013.4 |
25.6 |
41.5 |
72.5 |
462.8 |
1.1 |
0.9 |
Yes |
100 |
0.7 |
BB Biotech |
3,210.4 |
17.6 |
17.2 |
22.5 |
636.7 |
13.0 |
1.3 |
No |
109 |
5.0 |
BB Healthcare Trust |
760.6 |
23.4 |
53.4 |
|
|
1.6 |
1.2 |
No |
100 |
3.1 |
Biotech Growth Trust |
496.4 |
48.0 |
44.3 |
43.6 |
690.5 |
2.1 |
1.1 |
Yes |
109 |
0.0 |
HBM Healthcare Investments |
1,522.8 |
27.3 |
95.6 |
151.6 |
498.7 |
5.6 |
1.2 |
No |
100 |
2.9 |
International Biotechnology Trust |
287.5 |
21.8 |
31.5 |
36.2 |
458.0 |
1.4 |
1.3 |
Yes |
106 |
3.4 |
Polar Capital Global Healthcare |
297.1 |
11.1 |
33.4 |
52.0 |
252.2 |
(10.1) |
1.1 |
Yes |
104 |
0.9 |
Syncona |
1,658.1 |
(7.6) |
36.3 |
59.7 |
|
34.1 |
1.8 |
No |
100 |
0.0 |
Average (eight funds) |
1,280.8 |
20.9 |
44.1 |
62.6 |
499.8 |
6.1 |
1.2 |
103 |
2.0 |
|
WWH rank in peer group |
2 |
3 |
4 |
2 |
4 |
7 |
8 |
5= |
6 |
Source: Morningstar, Edison Investment Research. Note: *Performance data to 28 July 2020 based on ex-par NAV. TR = total return. Net gearing is total assets less cash and equivalents as a percentage of net assets (100 = ungeared).
The board
There are seven directors on WWH’s board, six of whom are independent of the manager. Chairman Sir Martin Smith joined the board in 2007 and assumed his current role in 2008. The other six directors and their years of appointment are: Dr David Holbrook (2007); Doug McCutcheon (2012); Sarah Bates (2013); Humphrey van der Klugt (2016); Sven Borho (2018); and Dr Bina Rawal (2019). Borho is considered a non-independent director, as he is a founder and managing partner of OrbiMed, and one of WWH’s lead managers. Holbrook has announced his intention to retire at the July 2021 AGM, while Smith will stand down at the following year’s AGM, at which stage McCutcheon will extend his term and assume the role of chairman.
|
|
Research: Healthcare
Laboratorios Farmacéuticos ROVI reported H120 operating revenue of €191.1m (+8% y-o-y), driven by strong growth in heparins (+23% to €104.0m) and in toll manufacturing (+31% to €34.8m), which offset a decrease in sales of low-margin, mature specialty pharmaceuticals. EBITDA increased by 60% to €42.4m in H120, which reflects operational leverage plus a significant benefit from improved gross margin, and reduction in R&D and SG&A. For FY20, ROVI has maintained guidance of mid-single-digit growth in total operating revenues. Despite the overall strength of heparins and toll manufacturing revenues, the company remains prudent given the COVID-19 related uncertainties. During Q220 ROVI signed a collaboration agreement with US-based biotech Moderna to provide fill-finish manufacturing for Moderna’s COVID-19 vaccine candidate outside of the US, which could provide upside if successful depending on the undisclosed terms of the deal. The US NDA filing for DORIA remains on track for H220. We value ROVI at €1.64bn.