Last close As at 05/08/2026
GBP2.22
▲ 1.00 (0.45%)
Market capitalisation
GBP508m
Research: TMT
GB Group reported strong performance in FY20 and started taking measures to preserve cash in Q420. Trading in Q121 has been mixed and while management is unwilling to provide guidance for FY21, it has confidence that in the longer term it is well positioned to benefit from the acceleration in digital transformation that should drive demand for its identity data intelligence services. We have upgraded our EPS forecasts by 5% in FY21 and 3% in FY22.
GB Group |
Managing cash now to support long-term strategy |
FY20 results |
Software & comp services |
2 July 2020 |
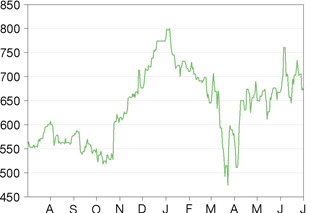
Share price performance
Business description
Next events
Analyst
GB Group is a research client of Edison Investment Research Limited |
|||||||||||||||||||||||||||||||||||||||||||||
GB Group reported strong performance in FY20 and started taking measures to preserve cash in Q420. Trading in Q121 has been mixed and while management is unwilling to provide guidance for FY21, it has confidence that in the longer term it is well positioned to benefit from the acceleration in digital transformation that should drive demand for its identity data intelligence services. We have upgraded our EPS forecasts by 5% in FY21 and 3% in FY22.
Year end |
Revenue (£m) |
EBITA* |
PBT* |
Diluted EPS* |
DPS |
P/E |
03/19 |
143.5 |
32.0 |
31.3 |
15.4 |
3.0 |
44.0 |
03/20 |
199.1 |
47.9 |
45.7 |
17.9 |
0.0 |
37.9 |
03/21e |
176.5 |
30.8 |
28.7 |
11.1 |
2.0 |
60.6 |
03/22e |
189.3 |
38.8 |
37.0 |
14.3 |
2.6 |
47.1 |
03/23e |
208.2 |
46.2 |
44.5 |
17.1 |
3.2 |
39.3 |
Note: *EBITA, PBT and EPS are normalised, excluding amortisation of acquired intangibles, exceptional items and share-based payments.
Strong FY20 performance
GB Group generated 10.7% organic constant currency revenue growth in FY20, with particularly strong growth from the Fraud division of 24.3%, Identity just ahead of the group average at 11.5% and Location lagging at 6.8%. EBITA of £47.9m beat our forecast and the 24.1% margin benefited from management starting to take cash preservation measures in Q420 as the threat from COVID-19 emerged. Year-end net debt of £35m (including unamortised bank fees) was 47% lower y-o-y.
FY21 outlook uncertain; small upgrade to estimates
As GB Group has seen mixed performance year to date, with variation by product, location and vertical, it is not in a position to give guidance for FY21. New business continues to be signed, although some sales cycles have lengthened. While the company is likely to see depressed transaction volumes this year, and to a lesser extent, weaker licence sales, the general shift in governments and corporates to provide their products and services online provides good long-term growth prospects across all three product lines. We have revised up our forecasts for FY21 and FY22 (normalised EPS up 4.7% and 3.3% respectively) and initiate a FY23 forecast for 20% EPS growth. Even with a revenue decline in FY21, we forecast net debt reducing to £13m by year-end and a net cash position by end FY22.
Valuation: Premium rating reflects growth potential
GBG trades at a premium to the UK software and IT services sectors and at the upper end of its ID management peer group on a P/E basis, reflecting its strong growth outlook (post COVID-19), high recurring revenues and strong balance sheet. Our reverse DCF analysis estimates the current share price is factoring in operating margins of 23% and revenue growth of c 14% per year from FY24, at the upper end of the group’s revenue and margin targets. Outside of COVID-19 recovery, triggers for upside could include successful cross-selling from recent acquisitions, adoption of GBG’s combined identity/location solution and in the medium term, accretive acquisitions.
Review of FY20 results
Below we include the video of the company’s results presentation.
|
Exhibit 1: Company presentation to analysts |
|
|
Source: GB Group |
GB Group provided a trading update in April, when it announced that revenues would be in the region of £199m and EBITA at least £47m. Results were slightly ahead of this, with EBITA 2.1% and normalised EPS 4.5% ahead of our forecasts. Net debt at year end had declined to £34.6m (£35.0m if unamortised bank fees are included).
Exhibit 2: FY20 results highlights
£m |
FY19a |
FY20e |
FY20a |
diff |
y-o-y |
Revenues |
143.5 |
198.9 |
199.1 |
0.1% |
38.7% |
Gross profit |
107.4 |
144.2 |
144.2 |
(0.0%) |
34.2% |
Gross margin |
74.9% |
72.5% |
72.4% |
(0.1%) |
(2.5%) |
EBITDA |
34.1 |
50.8 |
51.7 |
1.8% |
51.8% |
EBITDA margin |
23.7% |
25.5% |
26.0% |
0.4% |
2.2% |
EBITA |
32.0 |
47.0 |
47.9 |
2.1% |
49.7% |
EBITA margin |
22.3% |
23.6% |
24.1% |
0.5% |
1.8% |
Normalised PBT |
31.3 |
43.7 |
45.7 |
4.7% |
45.9% |
EPS - normalised, diluted (p) |
15.4 |
17.1 |
17.9 |
4.5% |
16.2% |
EPS - reported (p) |
7.7 |
8.6 |
8.8 |
2.8% |
14.6% |
Net debt/(cash) |
66.3 |
35.2 |
34.6 |
(1.5%) |
(47.8%) |
Net debt/EBITDA (x) |
1.9 |
0.7 |
0.7 |
Source: GB Group, Edison Investment Research Note: EBITA = operating profit before exceptional items, amortisation of acquired intangibles and share-based payments.
Revenues grew 38.7% y-o-y, or 10.7% on an organic, constant currency basis. On a half-yearly basis, organic growth was 17% in H120 and 5% in H220. H120 benefited from several one-off licences in the Fraud division. International revenues made up 56% of the total, up from 45% in FY19, reflecting the full-year contributions from acquisitions.
EBITDA increased at a faster rate than revenues, partly due to the one-off benefit from implementing IFRS 16, which removed £2.1m in lease expense from EBITDA. At the EBITA level, the margin increased 1.8pp y-o-y. The company noted that due to COVID-19 uncertainty from the start of Q420, it decided not to start certain internal projects and this gave the company a 2–3pp benefit compared to its expectations for FY20.
Net finance cost of £2.2m came in below our £3.3m forecast, which, combined with the higher than expected EBITA, resulted in normalised PBT 4.7% ahead and normalised diluted EPS 4.5% ahead of our forecast.
The company reported exceptional items totalling £1.6m. During the year, the deferred consideration for IDology was revised due to the changes in tax treatment brought about by the US CARES Act. As part of the acquisition agreement, GBG had agreed that any tax losses within IDology that were subsequently used by the group would be paid out in cash to the vendors. These were estimated at the prevailing 21% tax rate. The CARES Act allows tax losses to be calculated for the years 2014-2018 at the 35% tax rate in force then. This resulted in a restatement of various items on the balance sheet in FY19, most notably an increase in the provision for deferred consideration of £5.2m and an increase in goodwill of £5.5m and a £1m exceptional charge to the income statement in FY21.
In May, the company repaid a further £10m of its loan facility and had a net debt position of £20.5m at the end of the month. Based on 12-month trailing EBITDA, this equated to a gearing ratio of 0.4x. The company has access to an additional debt facility of £57.5m with a further £30m accordion.
Divisional performance
The table below shows performance on a divisional basis, including organic constant currency growth.
Exhibit 3: Divisional performance
£m |
FY20a |
FY20e |
FY19a |
diff |
y-o-y |
y-o-y organic |
y-o-y organic, constant currency |
Revenues |
|||||||
Fraud |
35.5 |
32.6 |
29.1 |
8.9% |
21.9% |
22% |
24.3% |
Identity |
105.4 |
106.8 |
58.2 |
-1.3% |
81.0% |
11% |
11.5% |
Location |
49.8 |
51.8 |
46.3 |
-3.9% |
7.6% |
8% |
6.8% |
Unallocated (Engage) |
8.4 |
7.7 |
9.9 |
9.1% |
-14.9% |
-15% |
-15% |
Total revenues |
199.1 |
198.9 |
143.5 |
0.1% |
38.7% |
10.3% |
10.7% |
Adjusted operating profit |
|||||||
Fraud |
13.4 |
10.0 |
9.0 |
34.3% |
48.9% |
||
Identity |
33.6 |
32.6 |
15.2 |
3.1% |
120.9% |
||
Location |
14.6 |
16.9 |
16.7 |
-13.9% |
-12.8% |
||
Unallocated (Engage) |
-13.7 |
-12.6 |
-8.9 |
8.7% |
53.7% |
||
Total adjusted operating profit |
47.9 |
47.0 |
32.0 |
2.1% |
49.7% |
||
Adjusted operating margin |
|||||||
Fraud |
37.9% |
30.7% |
31.0% |
7.2% |
6.9% |
||
Identity |
31.9% |
30.6% |
26.1% |
1.3% |
5.8% |
||
Location |
29.2% |
32.6% |
36.1% |
-3.4% |
-6.8% |
||
Unallocated (Engage) |
-162.9% |
-163.6% |
-90.2% |
0.7% |
-72.7% |
||
Total adjusted operating margin |
24.1% |
23.6% |
22.3% |
0.5% |
1.8% |
||
Source: GB Group, Edison Investment Research Note: adjusted operating profit excludes exceptional items, amortisation of acquired intangibles and share-based payments.
Identity
GBG’s largest division reported revenue growth of 81% with an adjusted operating margin of 31.9%, up 5.8pp y-o-y. Organic constant currency revenue growth was 11.5% for the year (+15% in H1 and +8% in H2). In H2, the division signed up Rank (for its UK casinos), PayPal, Adyen and Sky.
Location
This division reported revenue growth of 7.6% with an adjusted operating margin of 29.2%, down 6.8pp y-o-y. Constant currency revenue growth was 7% (14% in H 1 and 2% in H2). Towards the end of H220, the division signed a five-year contract with IBM that extends and expands an existing distribution agreement. The contract is worth at least $13.5m over the five-year period. The company noted that several new contracts were signed towards the end of H2 and therefore did not contribute materially to FY20 revenues.
Fraud
The Fraud division reported a strong year, with revenue growth of 21.9% and an adjusted operating margin of 37.9%, 6.9pp higher than in FY19. Revenue growth in H1 of 34% was boosted by multi-year licences totalling £2.1m, but we had not expected H2 growth (c 13% y-o-y) to be so robust. In H2, new customers included First Abu Dhabi Bank and Volkswagen Payments SA and the business extended the number of countries served for Arval (signed in H1) to three.
The company noted that it is seeing an increasing number of customers using more than one service. For example, FlexiGroup in Australia is using both Identity and Fraud services in Australia, and Domestic and General is using both Location and Identity services in the UK.
The company also provided detail on the split of revenues by type, namely licence, transaction and service. In the chart below we show the breakdown for both FY19 and FY20. Clearly, within both Identity and Location there has been a shift to charging by transaction as opposed to by subscription or multi-year licence. It is in these two divisions that we expect to see a larger COVID-19 impact in FY21, as lower transaction levels in certain markets will have a direct impact on transaction revenues.
Exhibit 4: Split by type of revenue
Fraud |
Identity |
Location |
Unallocated |
Group |
||||||
FY20 |
FY19 |
FY20 |
FY19 |
FY20 |
FY19 |
FY20 |
FY19 |
FY20 |
FY19 |
|
Licences |
95% |
94% |
7% |
21% |
62% |
76% |
0% |
0% |
36% |
52% |
Transactions |
0% |
0% |
89% |
78% |
33% |
23% |
0% |
0% |
55% |
39% |
Services |
5% |
6% |
4% |
1% |
5% |
1% |
100% |
100% |
9% |
9% |
Revenue contribution |
18% |
20% |
53% |
41% |
25% |
32% |
4% |
7% |
||
Source: GB Group
COVID-19 response and outlook
In the April trading update, the company highlighted the measures it was taking to ensure staff could work safely and to preserve cash for this period of uncertainty.
■
Staff are working remotely, providing support to customers and, where there is customer demand, selling remotely.
■
Staff pay is frozen, accrued bonuses for executive management for FY20 have been suspended and only essential recruitment is allowed.
■
Project spend is being assessed and only those projects vital to the company’s long-term performance will be undertaken.
■
The company will not pay a dividend for FY20 – we had estimated this would cost £6.5m in FY21.
Outlook remains uncertain
The company has seen a mixed performance, depending on the product, geography and end market. As a result, it is still not in a position to give guidance for FY21. Customer churn, solvency and bad debt are at normal levels although some customers have started taking longer to settle their invoices. The company is continuing to win new business, albeit with longer sales cycles, and has seen some countercyclical opportunities that have helped to mitigate the effect of reduced underlying activity. Renewals are comparable with the prior year.
|
Exhibit 5: FY20 revenue by sector |
|
|
Source: GB Group |
The company gave a breakdown of revenues in FY20 by vertical (Exhibit 5) – it estimates that c 18% of revenues have been hit by the COVID-19 restrictions (gaming, travel and leisure and smaller COVID challenged), with the remaining 82% seeing a mixed performance.
For Q121 trading the company has seen:
■
Location: volumes are up year on year.
■
Identity: in the US and Australia, volumes are up strongly year on year. In the UK and Europe volumes are slightly down, due to the higher exposure to sports betting and background checks. With the return of English Premier League football, sports betting is starting to pick up again.
■
Fraud: this business is mainly licence based. New customers are still being signed up, but implementation projects are sometimes taking longer.
The company has performed a scenario analysis based on various potential outcomes during FY21 and FY22 to confirm its going concern status. Its base-case scenario for going concern calculations (not guidance) is that revenues will decline 10.3% in FY21 to £175m and remain flat in FY22. Cash preservation measures already taken would reduce FY21 operating costs by £15m and save £7m from not proposing a dividend for FY20. In this scenario, there is significant headroom in covenant compliance tests and sufficient liquidity to maintain operations.
Flexing the testing to calculate at which point covenants would be breached, the company would need to see a revenue decline of 33% in FY21 (or 42% if operating costs are cut by a further 20%) before the covenant test is breached in June 2021. The breach could be remedied by reducing debt by £400k or increasing EBITDA by £130k but even without this, it would be remedied by September 2021.
Changes to forecasts
We have increased our FY21 and FY22 revenue forecasts marginally and introduce a forecast of 10% growth in FY23. We have increased our effective tax rate from 23% to 24%, based on company guidance.
Exhibit 6: Changes to estimates
£m |
FY21e |
FY21e |
|
|
FY22e |
FY22e |
|
|
FY23e |
|
old |
new |
change |
y-o-y |
old |
new |
change |
y-o-y |
new |
y-o-y |
|
Revenues |
174.6 |
176.5 |
1.1% |
(11.4%) |
187.4 |
189.3 |
1.0% |
7.3% |
208.2 |
10.0% |
Gross profit |
127.0 |
128.3 |
1.1% |
(11.0%) |
136.8 |
138.2 |
1.0% |
7.7% |
152.0 |
10.0% |
Gross margin |
72.7% |
72.7% |
0.0% |
0.3% |
73.0% |
73.0% |
0.0% |
0.3% |
73.0% |
0.0% |
EBITDA |
33.9 |
34.8 |
2.6% |
(32.7%) |
42.1 |
43.0 |
2.0% |
23.3% |
50.5 |
17.7% |
EBITDA margin |
19.4% |
19.7% |
0.3% |
(6.3%) |
22.5% |
22.7% |
0.2% |
3.0% |
24.3% |
1.6% |
EBITA |
29.9 |
30.8 |
3.1% |
(35.7%) |
37.9 |
38.8 |
2.3% |
25.8% |
46.2 |
19.0% |
EBITA margin |
17.1% |
17.5% |
0.3% |
(6.6%) |
20.2% |
20.5% |
0.3% |
3.0% |
22.2% |
1.7% |
PBT |
27.0 |
28.7 |
6.1% |
(37.3%) |
35.3 |
37.0 |
4.9% |
29.2% |
44.5 |
20.2% |
EPS - normalised, diluted (p) |
10.6 |
11.1 |
4.7% |
(38.0%) |
13.8 |
14.3 |
3.3% |
28.7% |
17.1 |
19.7% |
EPS - reported (p) |
2.8 |
1.9 |
(34.1%) |
(78.8%) |
6.2 |
4.9 |
(21.0%) |
163.4% |
8.0 |
62.1% |
Net debt/(cash) |
13.6 |
13.2 |
(2.8%) |
(61.9%) |
(5.9) |
(8.1) |
38.1% |
(161.4%) |
(35.4) |
336.1% |
Net debt/EBITDA (x) |
0.4 |
0.4 |
N/A |
N/A |
N/A |
Source: Edison Investment Research
Valuation
Exhibit 7: Peer group metrics and multiples
Rev growth (%) |
EBIT margin (%) |
EV/Sales |
EV/EBIT |
P/E |
Div yield (%) |
|||||||
CY |
NY |
CY |
NY |
CY |
NY |
CY |
NY |
CY |
NY |
CY |
NY |
|
GBG |
(11.4) |
7.3 |
17.5 |
20.5 |
7.6 |
7.1 |
43.4 |
34.5 |
60.6 |
47.1 |
0.3 |
0.4 |
Ave ID Management |
4.0 |
9.4 |
21.6 |
24.3 |
5.6 |
5.5 |
29.8 |
21.4 |
28.7 |
23.5 |
1.0 |
1.5 |
Median ID Management |
4.0 |
8.1 |
24.0 |
26.5 |
6.0 |
6.2 |
27.6 |
22.1 |
32.8 |
23.3 |
0.9 |
1.5 |
Ave UK Software |
15.4 |
10.9 |
5.4 |
8.9 |
4.5 |
4.0 |
20.4 |
10.6 |
27.4 |
22.1 |
0.6 |
0.8 |
Median UK Software |
8.7 |
7.9 |
14.3 |
18.0 |
3.2 |
3.0 |
23.2 |
16.3 |
26.5 |
19.1 |
0.0 |
0.3 |
Ave UK IT Services |
15.7 |
10.8 |
11.3 |
13.1 |
2.6 |
2.4 |
13.8 |
30.1 |
N/A |
40.9 |
1.5 |
1.8 |
Median UK IT Services |
9.5 |
8.1 |
10.9 |
15.6 |
2.3 |
2.3 |
20.2 |
21.3 |
23.0 |
25.5 |
0.6 |
2.0 |
Source: Edison Investment Research, Refinitiv (as at 29 June)
GBG trades at a premium to the UK software and IT services sectors and at the upper end of its ID management peer group on a P/E basis, reflecting its growth prospects (after COVID-19 disruption recedes) and high recurring revenues. The company also has a solid balance sheet and is cash generative, positioning it well to weather this period of uncertainty.
Our reverse DCF analysis, which uses a WACC of 7.5%, long-term growth of 3% and our forecasts to FY23, estimates the current share price is factoring in operating margins of 23% and revenue growth of c 14% per year from FY24, at the upper end of the group’s revenue and margin targets. Triggers for upside from the current level, apart from recovery as COVID-19 restrictions are reduced, could include accretive acquisitions, successful cross-selling from recent acquisitions and adoption of GBG’s combined identity/location solution.
Exhibit 8: Financial summary
£'000s |
2015 |
2016 |
2017 |
2018 |
2019 |
2020 |
2021e |
2022e |
2023e |
||
March |
IFRS |
IFRS |
IFRS |
IFRS |
IFRS |
IFRS |
IFRS |
IFRS |
IFRS |
||
PROFIT & LOSS |
|||||||||||
Revenue |
|
|
57,283 |
73,401 |
87,468 |
119,702 |
143,504 |
199,101 |
176,494 |
189,295 |
208,154 |
Cost of Sales |
(16,448) |
(17,606) |
(20,302) |
(27,092) |
(36,060) |
(54,914) |
(48,183) |
(51,110) |
(56,202) |
||
Gross Profit |
40,835 |
55,795 |
67,166 |
92,610 |
107,444 |
144,187 |
128,311 |
138,185 |
151,952 |
||
EBITDA |
|
|
11,844 |
14,772 |
18,734 |
28,741 |
34,080 |
51,739 |
34,825 |
42,956 |
50,541 |
Operating Profit (before amort. and except.) |
10,790 |
13,428 |
17,006 |
26,311 |
32,031 |
47,945 |
30,834 |
38,776 |
46,162 |
||
Acquired intangible amortisation |
(1,986) |
(2,501) |
(4,022) |
(7,885) |
(10,316) |
(19,008) |
(18,900) |
(18,900) |
(17,900) |
||
Exceptionals |
(1,629) |
(94) |
(1,410) |
(2,143) |
(4,003) |
(1,552) |
0 |
0 |
0 |
||
Share of associate |
(10) |
0 |
0 |
0 |
0 |
0 |
0 |
0 |
0 |
||
Share based payments |
(971) |
(1,245) |
(994) |
(2,375) |
(2,287) |
(4,541) |
(4,995) |
(5,495) |
(6,044) |
||
Operating Profit |
6,194 |
9,588 |
10,580 |
13,908 |
15,425 |
22,844 |
6,939 |
14,381 |
22,218 |
||
Net Interest |
(266) |
(270) |
(498) |
(508) |
(689) |
(2,218) |
(2,155) |
(1,730) |
(1,630) |
||
Profit Before Tax (norm) |
|
|
10,524 |
13,158 |
16,508 |
25,803 |
31,342 |
45,727 |
28,679 |
37,046 |
44,532 |
Profit Before Tax (FRS 3) |
|
|
5,928 |
9,318 |
10,082 |
13,400 |
14,736 |
20,626 |
4,784 |
12,651 |
20,588 |
Tax |
(1,127) |
(178) |
668 |
(2,746) |
(2,583) |
(3,562) |
(1,148) |
(3,036) |
(4,941) |
||
Profit After Tax (norm) |
8,314 |
10,395 |
13,206 |
20,642 |
24,760 |
35,210 |
21,796 |
28,155 |
33,844 |
||
Profit After Tax (FRS 3) |
4,801 |
9,140 |
10,750 |
10,654 |
12,153 |
17,064 |
3,636 |
9,615 |
15,647 |
||
Ave.Number of Shares Outstanding (m) |
119.1 |
122.7 |
131.6 |
150.6 |
158.1 |
193.6 |
194.6 |
195.3 |
196.1 |
||
EPS - normalised (p) |
|
|
7.0 |
8.5 |
10.0 |
13.7 |
15.7 |
18.2 |
11.2 |
14.4 |
17.3 |
EPS - normalised and fully diluted (p) |
|
6.7 |
8.2 |
9.9 |
13.5 |
15.4 |
17.9 |
11.1 |
14.3 |
17.1 |
|
EPS - (IFRS) (p) |
|
|
4.0 |
7.4 |
8.2 |
7.1 |
7.7 |
8.8 |
1.9 |
4.9 |
8.0 |
Dividend per share (p) |
1.9 |
2.1 |
2.4 |
2.7 |
3.0 |
0.0 |
2.0 |
2.6 |
3.2 |
||
Gross Margin (%) |
71.3 |
76.0 |
76.8 |
77.4 |
74.9 |
72.4 |
72.7 |
73.0 |
73.0 |
||
EBITDA Margin (%) |
20.7 |
20.1 |
21.4 |
24.0 |
23.7 |
26.0 |
19.7 |
22.7 |
24.3 |
||
Operating Margin (before GW and except.) (%) |
18.8 |
18.3 |
19.4 |
22.0 |
22.3 |
24.1 |
17.5 |
20.5 |
22.2 |
||
BALANCE SHEET |
|||||||||||
Fixed Assets |
|
|
51,238 |
59,364 |
105,653 |
170,284 |
438,683 |
430,219 |
412,229 |
394,148 |
376,969 |
Intangible Assets |
45,296 |
54,113 |
98,753 |
161,372 |
425,646 |
414,505 |
395,505 |
376,505 |
358,505 |
||
Tangible Assets |
2,829 |
2,234 |
2,856 |
4,700 |
4,815 |
9,420 |
10,430 |
11,349 |
12,170 |
||
Other fixed assets |
3,113 |
3,017 |
4,044 |
4,212 |
8,222 |
6,294 |
6,294 |
6,294 |
6,294 |
||
Current Assets |
|
|
33,186 |
36,189 |
48,914 |
61,121 |
76,522 |
95,984 |
104,396 |
126,331 |
156,398 |
Debtors |
17,408 |
23,774 |
30,569 |
37,969 |
54,992 |
66,554 |
63,538 |
68,146 |
74,935 |
||
Cash |
15,778 |
12,415 |
17,618 |
22,753 |
21,189 |
27,499 |
38,927 |
56,254 |
79,531 |
||
Other |
0 |
0 |
727 |
399 |
341 |
1,931 |
1,931 |
1,931 |
1,931 |
||
Current Liabilities |
|
|
(30,784) |
(32,559) |
(44,444) |
(56,942) |
(77,030) |
(86,459) |
(83,984) |
(86,482) |
(92,514) |
Creditors |
(24,305) |
(30,927) |
(36,436) |
(56,100) |
(70,302) |
(80,280) |
(77,805) |
(80,303) |
(86,335) |
||
Contingent consideration |
(5,733) |
(1,050) |
(7,122) |
(45) |
(5,287) |
(6,179) |
(6,179) |
(6,179) |
(6,179) |
||
Short term borrowings |
(746) |
(582) |
(886) |
(797) |
(1,441) |
0 |
0 |
0 |
0 |
||
Long Term Liabilities |
|
|
(7,506) |
(6,593) |
(15,940) |
(16,711) |
(116,707) |
(94,810) |
(79,075) |
(69,220) |
(59,474) |
Long term borrowings |
(3,643) |
(3,160) |
(11,499) |
(8,451) |
(85,447) |
(62,139) |
(52,139) |
(48,139) |
(44,139) |
||
Contingent consideration |
(895) |
0 |
0 |
0 |
0 |
0 |
0 |
0 |
0 |
||
Other long term liabilities |
(2,968) |
(3,433) |
(4,441) |
(8,260) |
(31,260) |
(32,671) |
(26,936) |
(21,081) |
(15,335) |
||
Net Assets |
|
|
46,134 |
56,401 |
94,183 |
157,752 |
321,468 |
344,934 |
353,565 |
364,777 |
381,379 |
CASH FLOW |
|||||||||||
Operating Cash Flow |
|
|
11,684 |
13,397 |
16,305 |
31,620 |
27,779 |
48,498 |
35,366 |
40,846 |
49,783 |
Net Interest |
(266) |
(282) |
(498) |
(545) |
(689) |
(1,768) |
(2,155) |
(1,730) |
(1,630) |
||
Tax |
(337) |
(248) |
(2,193) |
(3,247) |
(2,930) |
(6,386) |
(6,883) |
(8,891) |
(10,688) |
||
Capex |
(2,011) |
(1,762) |
(2,227) |
(2,018) |
(1,625) |
(1,339) |
(2,900) |
(3,000) |
(3,100) |
||
Acquisitions/disposals |
(18,672) |
(12,263) |
(36,840) |
(70,363) |
(255,101) |
(81) |
0 |
0 |
0 |
||
Financing |
10,954 |
790 |
24,755 |
56,668 |
157,339 |
(1,553) |
(2,000) |
(2,000) |
(2,000) |
||
Dividends |
(1,955) |
(2,277) |
(2,775) |
(3,582) |
(4,049) |
(5,761) |
0 |
(3,898) |
(5,088) |
||
Net Cash Flow |
(603) |
(2,645) |
(3,473) |
8,533 |
(79,276) |
31,610 |
21,428 |
21,327 |
27,278 |
||
Opening net debt/(cash) |
|
|
(11,846) |
(11,389) |
(8,673) |
(5,233) |
(13,505) |
65,699 |
34,640 |
13,212 |
(8,115) |
HP finance leases initiated |
0 |
0 |
0 |
0 |
0 |
0 |
0 |
0 |
0 |
||
Other |
146 |
(71) |
33 |
(261) |
72 |
(551) |
0 |
0 |
0 |
||
Closing net debt/(cash) |
|
|
(11,389) |
(8,673) |
(5,233) |
(13,505) |
65,699 |
34,640 |
13,212 |
(8,115) |
(35,392) |
Source: GB Group, Edison Investment Research
|
|
Research: Industrials
As flagged in the April trading update, Solid State’s FY20 results showed a 19.7% growth in revenues and 34.3% jump in adjusted profit before tax. Demand from the medical and food retail sectors is strong but weakness in the oil & gas and commercial aviation sectors related to the coronavirus pandemic is likely to result in lower year-on-year sales during Q2 and early Q321. While management sees potential for a Q4 recovery, the current range of FY21 profit outcomes is wide, so it is not providing guidance.