Last close As at 05/08/2026
GBP19.60
▲ 20.00 (1.03%)
Market capitalisation
GBP239m
Research: Financials
The typical 52-month original term of S&U’s Advantage motor finance loans means that it takes time for the benefit of tighter credit criteria to flow through fully and there is also a time lag before a revival in loan growth is reflected in earnings; however, both are now in prospect. Aspen property bridging is also at a point where growth may accelerate, subject to market conditions. Taken together, we estimate this could allow the group to regain revenue and profit levels approaching those of FY20 by FY23.
Written by
S & U |
Looking towards a resumption of growth |
December trading update |
Financial services |
14 December 2020 |
Share price performance
Business description
Next events
Analysts
S & U is a research client of Edison Investment Research Limited |
|||||||||||||||||||||||||||||||||||||||||||||||
The typical 52-month original term of S&U’s Advantage motor finance loans means that it takes time for the benefit of tighter credit criteria to flow through fully and there is also a time lag before a revival in loan growth is reflected in earnings; however, both are now in prospect. Aspen property bridging is also at a point where growth may accelerate, subject to market conditions. Taken together, we estimate this could allow the group to regain revenue and profit levels approaching those of FY20 by FY23.
Year end |
Revenue (£m) |
PBT* |
EPS* |
DPS |
P/E |
Yield |
|
01/20 |
89.9 |
35.1 |
239.4 |
120.0 |
8.1 |
6.2 |
|
01/21e |
81.5 |
18.4 |
122.9 |
90.0 |
15.7 |
4.7 |
|
01/22e |
82.9 |
24.9 |
165.9 |
100.0 |
11.6 |
5.2 |
|
01/23e |
91.5 |
31.2 |
208.0 |
110.0 |
9.3 |
5.7 |
|
Note: *PBT and EPS are reported. EPS are diluted.
Trading update
S&U’s December 2020 update covers the period from 1 August to 8 December. At Advantage motor finance the rate of transactions improved in the period, but growth has been tempered by temporarily avoiding self-employed and higher-risk lending. This and still strong repayment levels mean that net receivables were slightly lower than we would have expected at this stage (£253m versus our previous estimate of £261m for the January year-end). Collection rates in the period were up from Q221 at 87.5% compared with 74.1% in Q121 and 94% in the prior year. Customers on payment holidays are now below 5,000 (out of c 63,000 customers in total). Early repayments from new customers are also reported to be performing well (historically a good indicator for future credit performance). The number of transactions at Aspen property bridging has improved considerably with net receivables ahead of our estimate at £29.6m (our year-end estimate was £26m) and S&U reports strengthened loan quality with no defaults outstanding.
Background and outlook
The group acknowledges the uncertainties of navigating the path out of COVID-19 restrictions and their aftermath but is looking for a resumption of its normal growth rates in H122. Given the recovery of demand for Advantage and Aspen since the initial lockdown this seems plausible. Our estimates allow for this improvement in growth and are only slightly changed for FY21 and FY22. We have introduced an estimate for FY23 to illustrate the result of the increased levels of lending assumed and, to a lesser extent, an improved cost of risk.
Valuation
The shares trade on a price to book value multiple of 1.3x which (using a ROE/COE model) implies the assumption of a return on equity of 12.7% which is above the 10.9% we estimate for FY22 but just below our estimate for FY23 and still well below historical levels of over 16%.
Further points from the update
Payment holidays and updated FCA guidance
At the end of July Advantage had 12,900 customers on payment holidays and this had reduced to 6,500 by the time of the H121 announcement at the end of September. Subsequently this has fallen further to less than 5,000. The FCA has issued updated payment deferral guidance which applied from 25 November and extends the time frame for potential deferrals to 31 July 2021 or a maximum of six months. While there is therefore potential for further payment holidays for Advantage customers experiencing difficulties related to COVID-19, it may be the case that those most likely to be affected have already opted for payment deferral where appropriate.
Preparing for recovery at Advantage
As reported previously, Advantage is taking the opportunity of the COVID-19 hiatus to work on operational improvements that should help as activity levels return to more normal levels. These include enhancing IT connections with introducers, further customer service and affordability analysis and developing affinity relationships with lenders which it is hoped will enable the acquisition of better-quality business at a lower cost.
Cash flow and funding
S&U reported that group borrowings stood at £103m compared with £108m in July and borrowing facilities of £130m. The debt position reflects significant cash generation by Advantage since the half year end offset by investment in Aspen of £10.6m and payment of the interim dividend (c £2.7m). Gearing (net debt/equity) stood at 58% leaving considerable headroom for lending growth.
Background and outlook
This section provides updates on some of the indicators we monitor when assessing trends in the markets for the Advantage and Aspen businesses.
We start with forecasts for UK GDP and unemployment as collected by the UK Treasury. GDP forecasts for both years are lower than they were in September reflecting further tightening of anti-COVID-19 measures while unemployment figures are lower for end 2020 but higher for end 2021 as job protection measures have been extended through to next spring. For Advantage, a key potential sensitivity is unemployment, so the forecasts suggest some risk of a deferral of adverse impact into the next calendar year. However, as noted earlier, it may be the case that customers most exposed to the adverse impact of the pandemic have already become evident, with prudent levels of provisioning already being made.
Exhibit 1: Comparison of independent economic forecasts for the UK (November)
% |
Average |
Average of new forecasts |
Low |
High |
GDP growth |
||||
2020 |
(10.6) |
(11.0) |
(12.4) |
(8.9) |
2021 |
5.3 |
4.8 |
0.7 |
7.6 |
Labour Force Survey unemployment rate Q4 |
||||
2020 |
6.4 |
6.1 |
4.5 |
9.1 |
2021 |
7.2 |
7.2 |
5.0 |
9.6 |
Source: HM Treasury
Exhibit 2 shows that the recent tightening of restrictions has affected consumer confidence which has moved back towards its earlier post-pandemic low point. Prospectively, weathering the high-risk winter period from a public health perspective and the build-up of the vaccination programme should have a positive effect on confidence. Exhibit 3 shows that the unemployment rate has started to move up although it is a lagging indicator and is still being cushioned by government job protection measures. Redundancies, however, have shown a substantial increase, as feared. Both indicators seem likely to worsen before easing given the economic forecasts shown above.
|
Exhibit 2: GFK UK consumer confidence indicator |
Exhibit 3: UK redundancies and unemployment |
|
|
|
Source: Bloomberg (last value November 2020) |
Source: Bloomberg (last value September 2020) |
|
Exhibit 2: GFK UK consumer confidence indicator |
|
|
Source: Bloomberg (last value November 2020) |
|
Exhibit 3: UK redundancies and unemployment |
|
|
Source: Bloomberg (last value September 2020) |
Next are data on used car transactions and used car finance. Exhibit 4 shows the sharp drop in used car transactions in CY20 when compared with the monthly figures for the prior two years. The striking point here is how well volume has recovered since the initial lockdown. Exhibit 5 tells a similar story for used car finance, in line with S&U’s comments about recent demand.
|
Exhibit 4: Used car transactions 2018, 2019 and 2020 |
Exhibit 5: Used car finance through dealerships |
|
|
|
Source: SMMT, Edison Investment Research |
Source: Finance and Leasing Association. Note: By volume. |
|
Exhibit 4: Used car transactions 2018, 2019 and 2020 |
|
|
Source: SMMT, Edison Investment Research |
|
Exhibit 5: Used car finance through dealerships |
|
|
Source: Finance and Leasing Association. Note: By volume. |
As far as used car prices are concerned, these have been buoyant in 2020 with strong consumer demand and reduced supply pushing prices up with the Autotrader retail price index showing like-for-like increases of over 7% y-o-y in the three months to November. However, auctioneers Aston Barclay, for example, suggest some normalisation is underway in the market as supply increases. Prospectively, 2021 could see some further weakening if repossessions and voluntary terminations rise significantly. Nevertheless, Advantage’s exposure to lower auction prices on repossessions is limited by the relatively low value of the vehicles it finances (average loan in H121: £6,500).
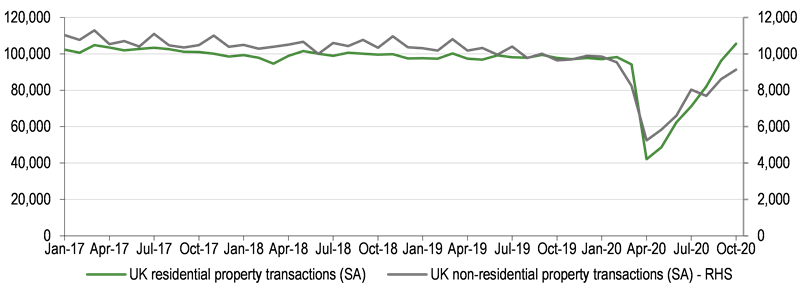
Turning to Aspen property bridging, Exhibit 6 shows the number of UK non-residential and residential transactions with residential being most relevant for Aspen. Both have seen an extended post lockdown bounce with a stronger move evident for residential transactions. While these figures show the broad market background for transactions, as a small business Aspen should have significant scope for expansion as it is now more established in the market and has gained experience having lent more than £100m since it was founded.
|
Exhibit 6: UK property transactions (seasonally adjusted) |
|
|
Source: HM Revenue & Customs. Note: Figures for August to October 2020 are provisional |
Changes in estimates
Changes in our revenue and earnings estimates for FY21 and FY22 are modest (Exhibit 7). For FY21 these partly reflect the level of receivables for Advantage and Aspen indicated in the update. For FY22 we have allowed for slightly higher revenue and impairments to reflect non-performing debt remaining on the books in the wake of the pandemic’s impact this year. We have also changed our dividend estimates on the assumption that the board may take into account prospective dividend cover rather than sticking rigidly to a twice covered dividend; on our estimates cover would increase from 1.4x to 1.9x from FY21 to FY23.
Exhibit 7: Changes to estimates
Year-end |
Revenue (£m) |
PBT (£m) |
EPS (p) |
DPS (p) |
||||||||
Old |
New |
Change (%) |
Old |
New |
Change (%) |
Old |
New |
Change (%) |
Old |
New |
Change (%) |
|
2021e |
82.0 |
81.5 |
-0.6% |
18.6 |
18.4 |
-1.1% |
124.3 |
122.9 |
-1.1% |
62.0 |
90.0 |
45.2% |
2022e |
80.5 |
82.9 |
3.0% |
24.8 |
24.9 |
0.1% |
165.7 |
165.9 |
0.1% |
83.0 |
100.0 |
20.5% |
2023e |
91.5 |
31.2 |
208.0 |
110.0 |
||||||||
Source: Edison Investment Research
Exhibit 8 provides a summary of key elements of our forecasts including our newly introduced forecast for FY23. While the latter forecast is tentative, it is based on broadly stable underlying ratios for risk-adjusted yield and the increases in loan books set out at the top of the table. Motor finance transactions are expected to return close to their FY20 level in FY23. Given that Aspen property bridging is still at a relatively small scale we have allowed for a step up in the size of the book; however, we note that if the performance of this lending were to disappoint then management has indicated a conservative approach would be taken. Similarly, if market conditions for Advantage were to prove less favourable then the pace of lending would be likely to be more moderate.
Exhibit 8: Estimate summary
Year-end January (£000) |
FY20 |
FY21e |
FY22e |
FY23e |
Number of new motor loans |
23,334 |
16,911 |
22,300 |
23,150 |
Motor finance receivables at period end |
280,757 |
250,790 |
266,813 |
282,935 |
Bridging receivables at period end |
20,993 |
30,500 |
57,000 |
105,000 |
Revenue |
||||
Motor finance |
85,465 |
77,827 |
75,988 |
78,715 |
Property bridging |
4,474 |
3,659 |
6,949 |
12,835 |
Total |
89,939 |
81,486 |
82,937 |
91,550 |
Impairments |
||||
Motor finance |
(16,507) |
(32,361) |
(21,639) |
(18,498) |
Property bridging |
(713) |
(630) |
(1,112) |
(2,054) |
Total |
(17,220) |
(32,991) |
(22,751) |
(20,552) |
Other cost of sales |
(19,872) |
(14,761) |
(19,311) |
(20,960) |
Administration expenses |
(12,413) |
(10,867) |
(11,322) |
(12,817) |
EBITDA |
40,434 |
22,866 |
29,553 |
37,221 |
Depreciation |
(450) |
(561) |
(565) |
(500) |
Operating profit / loss |
39,984 |
22,305 |
28,988 |
36,722 |
Finance expense |
(4,850) |
(3,861) |
(4,131) |
(5,562) |
Pre-tax profit |
35,134 |
18,444 |
24,857 |
31,160 |
Tax |
(6,252) |
(3,531) |
(4,723) |
(5,920) |
Net profit |
28,882 |
14,913 |
20,134 |
25,239 |
EPS fully diluted (p) |
239.4 |
122.9 |
165.9 |
208.0 |
Dividend per share (p) |
120.0 |
90.0 |
100.0 |
110.0 |
Source: Company accounts, Edison Investment Research
Valuation
As we discussed in our last note in October, P/E comparisons with peers are difficult to interpret given the impact of forward-looking provisions in the post-COVID-19 period so for the moment we simply update our ROE/COE calculations. If we assume a cost of equity of 10% and long-term growth of 2% then the share price at the time of writing (1,930p) would be consistent with an ROE of 12.7%, which is above the 10.9% we estimate for FY22 but just below the 12.9% implied by our new estimate for FY23. Arguably, even that year might not reflect a full recovery from the impact of COVID-19 and historically S&U has achieved higher returns on equity (the historical five-year average is over 16%).
Exhibit 9: Financial summary
£'000s |
2017 |
2018 |
2019 |
2020 |
2021e |
2022e |
2023e |
||
Year end 31 January |
|||||||||
PROFIT & LOSS |
|||||||||
Revenue |
|
|
60,521 |
79,781 |
82,970 |
89,939 |
81,486 |
82,937 |
91,550 |
Impairments |
(12,194) |
(19,596) |
(16,941) |
(17,220) |
(32,991) |
(22,751) |
(20,552) |
||
Other cost of sales |
(12,871) |
(17,284) |
(15,751) |
(19,872) |
(14,761) |
(19,311) |
(20,960) |
||
Administration expenses |
(8,332) |
(9,629) |
(10,763) |
(12,413) |
(10,867) |
(11,322) |
(12,817) |
||
EBITDA |
|
|
27,124 |
33,272 |
39,515 |
40,434 |
22,866 |
29,553 |
37,221 |
Depreciation |
|
|
(253) |
(294) |
(414) |
(450) |
(561) |
(565) |
(500) |
Op. profit (incl. share-based payouts pre-except.) |
|
|
26,871 |
32,978 |
39,101 |
39,984 |
22,305 |
28,988 |
36,722 |
Exceptionals |
0 |
0 |
0 |
0 |
0 |
0 |
0 |
||
Non recurring items |
0 |
0 |
0 |
0 |
0 |
0 |
0 |
||
Investment revenues / finance expense |
(1,668) |
(2,818) |
(4,541) |
(4,850) |
(3,861) |
(4,131) |
(5,562) |
||
Profit before tax |
|
|
25,203 |
30,160 |
34,560 |
35,134 |
18,444 |
24,857 |
31,160 |
Tax |
(4,861) |
(5,746) |
(6,571) |
(6,252) |
(3,531) |
(4,723) |
(5,920) |
||
Profit after tax |
|
|
20,342 |
24,414 |
27,989 |
28,882 |
14,913 |
20,134 |
25,239 |
Average Number of Shares Outstanding (m) |
12.0 |
12.1 |
12.1 |
12.1 |
12.1 |
12.1 |
12.1 |
||
Diluted EPS (p) |
|
|
169.1 |
202.4 |
232.0 |
239.4 |
122.9 |
165.9 |
208.0 |
EPS - basic (p) |
|
|
170.7 |
203.8 |
233.2 |
239.6 |
123.0 |
166.1 |
208.2 |
Dividend per share (p) |
91.0 |
105.0 |
118.0 |
120.0 |
90.0 |
100.0 |
110.0 |
||
EBITDA margin (%) |
44.8% |
41.7% |
47.6% |
45.0% |
28.1% |
35.6% |
40.7% |
||
Operating margin (before GW and except.) (%) |
44.4% |
41.3% |
47.1% |
44.5% |
27.4% |
35.0% |
40.1% |
||
Return on equity |
15.2% |
16.7% |
17.6% |
16.8% |
8.3% |
10.9% |
12.9% |
||
BALANCE SHEET |
|||||||||
Non-current assets |
|
|
138,004 |
181,015 |
185,383 |
197,806 |
187,617 |
215,255 |
257,156 |
Current assets |
|
|
57,763 |
84,178 |
95,430 |
108,275 |
98,637 |
113,320 |
135,654 |
Total assets |
|
|
195,767 |
265,193 |
280,813 |
306,081 |
286,254 |
328,574 |
392,810 |
Current liabilities |
|
|
(17,850) |
(7,927) |
(6,722) |
(7,424) |
(3,544) |
(3,809) |
(4,127) |
Non current liabilities inc pref |
(38,450) |
(104,450) |
(108,724) |
(119,183) |
(101,397) |
(135,111) |
(185,825) |
||
Net assets |
|
|
139,467 |
152,816 |
165,367 |
179,474 |
181,313 |
189,654 |
202,858 |
NAV per share (p) |
1,177 |
1,276 |
1,375 |
1,493 |
1,508 |
1,577 |
1,687 |
||
CASH FLOW |
|||||||||
Operating cash flow |
|
|
(27,431) |
(43,418) |
10,530 |
4,946 |
31,650 |
(21,668) |
(38,214) |
Net cash from investing activities |
(308) |
(1,040) |
(785) |
(265) |
(1,106) |
(250) |
(250) |
||
Dividends paid |
(9,548) |
(11,377) |
(13,080) |
(14,461) |
(13,104) |
(11,883) |
(12,125) |
||
Other financing (excluding change in borrowing) |
21 |
12 |
14 |
14 |
2 |
0 |
0 |
||
Net cash flow |
|
|
(37,266) |
(55,823) |
(3,321) |
(9,766) |
17,442 |
(33,801) |
(50,589) |
Source: S&U accounts, Edison Investment Research
|
|
Research: Healthcare
Kazia Therapeutics announced the final data from both parts of the Phase I dosing study of cantrixil for the treatment of metastatic ovarian cancer. Of the 16 patients evaluable for efficacy, one had a complete response (CR) and two had a partial response (PR). This response rate data has not changed significantly since the dosing portion of the study was completed in 2018. The company will seek partners for the further development of the product, while it focuses its efforts on paxalisib.