Lookers delivered a solid H118 report against a challenging UK new car backdrop, and in comparison to a period that included a record first quarter. We summarise the key points here:
■
Reported H118 group revenues of £2.58bn (H117 £2.46bn) represented growth of 5%, including flat new car revenues.
■
Reported H118 gross profit of £271m (+3% vs. H117 £264m) was supported by continued growth in used cars and aftersales businesses.
■
Reported H118 adjusted profit before tax of £43.1m (-14.1% vs H117 £50.2m) reflected the tough Q117 comparatives, a higher interest charge as well increased costs from investment in people, technology and property.
■
Reported H118 adjusted EPS of 9.07p (H117 10.49p) was down 13.5%.
■
Reported H118 dividend per share of 1.48p (H117 1.41p) was an increase of 5.0% in line with our expectations, covered 6.1x by adjusted earnings and reflecting the company’s progressive dividend policy. We expect a similar increase in the full year dividend.
■
Strong cash conversion with working capital reduced and net debt lowered to £54.5m (H117 £61.9m).
■
Share buyback remains ongoing, following the announcement in March of a £10m programme. At 30 June 2018, the company had acquired and cancelled c 3 million shares at a cost of £3.1m.
Exhibit 1: Lookers H118 key data
Half year to June |
H117 |
H118 |
% |
£m |
|
|
change |
Revenues |
2,458.5 |
2,576.5 |
4.8% |
Operating profit (adjusted) |
58.1 |
52.8 |
-9.1% |
Profit before tax (adjusted) |
50.2 |
43.1 |
-14.1% |
Net income (adjusted) |
41.6 |
35.9 |
-100.0% |
EPS (p) (reported) |
9.07 |
9.71 |
7.1% |
EPS (p) (adjusted) |
10.49 |
9.07 |
-13.5% |
DPS (p) |
1.41 |
1.48 |
5.0% |
Net debt |
61.9 |
54.5 |
-12.0% |
Freehold/long leasehold property per share (p) |
74 |
78 |
5.4% |
NAV per share (p) |
93 |
105 |
12.9% |
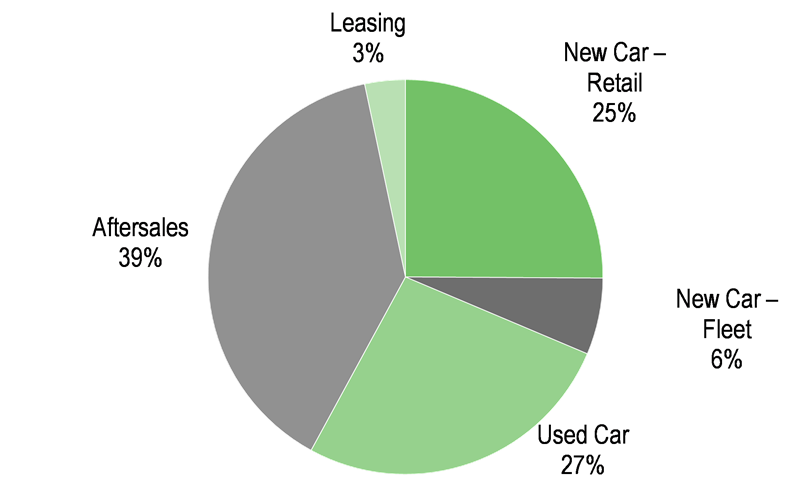
Used car and aftersales segments continue to contribute around two thirds of group profitability, aided by their higher margin business dynamics.
Exhibit 2: H118 revenue by activity
|
Exhibit 3: H118 gross profit by activity
|

|
|
|
|
|
Exhibit 2: H118 revenue by activity
|
|
|
|
Exhibit 3: H118 gross profit by activity
|
|
|
|
New car sales were broadly stable at £1.3bn with a significant 12% increase in used car sales and a healthy 6% improvement from the aftersales segment. Group gross margin was a healthy 10.5% (Q117 10.7%), as a fall in new and used car margins was largely offset by an improvement in the aftersales segment. The small leasing business maintained its gross profit contribution.
Exhibit 4: Lookers H1 divisional analysis
Year-end December |
2017 |
2018 |
% change |
% change |
(£m) |
H117 |
H217 |
FY17 |
H118 |
H118 vs H117 |
H118 vs H217 |
New car – retail |
822 |
677 |
1499 |
808 |
(2)% |
19% |
New car – fleet |
490 |
488 |
978 |
503 |
3% |
3% |
Used car |
887 |
815 |
1702 |
996 |
12% |
22% |
Aftersales |
216 |
193 |
409 |
228 |
6% |
18% |
Leasing |
44 |
64 |
108 |
41 |
(7)% |
-36% |
Group revenues |
2,459 |
2,237 |
4,696 |
2,576 |
5% |
15% |
Gross profit by segment |
|
|
|
|
|
|
New car – retail |
71 |
63 |
134 |
68 |
(4)% |
8% |
New car – fleet |
17 |
14 |
31 |
17 |
0% |
21% |
Used car |
69 |
64 |
133 |
72 |
4% |
13% |
Aftersales |
98 |
91 |
189 |
105 |
7% |
15% |
Leasing |
9 |
8 |
17 |
9 |
0% |
13% |
Group gross profit |
264 |
240 |
504 |
271 |
3% |
13% |
Gross margin |
|
|
|
|
|
|
New car – retail |
8.6% |
9.3% |
8.9% |
8.4% |
|
|
New car – fleet |
3.5% |
2.9% |
3.2% |
3.4% |
|
|
Used car |
7.8% |
7.9% |
7.8% |
7.2% |
|
|
Aftersales |
45.4% |
47.2% |
46.2% |
46.1% |
|
|
Leasing |
20.5% |
12.5% |
15.7% |
22.0% |
|
|
Group gross margin |
10.7% |
10.7% |
10.7% |
10.5% |
|
|
New cars (H118: 51% group sales; 31% group gross profit)
As expected, a decrease in the UK new car market was visible in H118 with a y-o-y decline in registrations of 6.3%. Within that, the retail new car market reduced by 4.9% and the fleet market reduced by 7.3%. The market decline was more pronounced in Q118, given the tougher comparison from the pull forward effect seen in 2017 in advance of changes to VED.
Of the issues that affected the market last year
■
VED change was not repeated so the important March/April registration period returned to normal this year.
■
The issues related to the use of Personal Contract Purchase (PCP) finance plans appear to have been given a clean bill of health for new car and higher quality used car deals.
■
The demonisation of diesel continued to have an adverse impact on new car purchases but the sharp decline in demand in H217 has now stabilised to a degree at lower levels. Residual values have recovered so used profitability for diesels has started to recover.
■
Brexit concerns continue to weigh on consumer and business confidence.
Lookers saw modest sales growth from April and overall kept new car revenues broadly flat on H117. Within this figure, Lookers’ new car retail revenues fell 2% y-o-y but grew 19% on a sequential basis from H217. New car fleet turnover increased 3% y-o-y against the market decline of 6%. New car retail gross profit declined by 4%, reflecting the wider market weakness. However, a sensible attitude to maintaining margins kept new car fleet gross profit flat y-o-y.
We discuss the outlook for the UK new car market in detail later on.
Used cars (H118: 39% group sales; 27% group gross profit)
The UK used car market remained relatively more stable during the first half, although a modest 2.6% dip in Q118 was followed by just a 0.4% fall in Q218. Exhibit 5 outlines UK used car H1 transactions, indicating that the market is still at a healthy level.
Exhibit 5: UK used car transactions, six months to June
|

|
|
|
Lookers viewed the H118 used car market as buoyant and once again managed to outperform the market. This was aided by the manufacturer deal it took on in December, but more generally arising from the assertive actions it is taking to accelerate used car sales. Lookers’ used car revenues increased by 12% y-o-y and 22% sequentially. Gross profit increased by 4% y-o-y and 13% sequentially. Although the average selling price increased, profit per unit was maintained at the same level. Lookers has driven used car volume growth each year over the last five years and continues to recognise the segment as a significant opportunity and intends to drive growth here.
Aftersales (H118: 9% group sales; 39% group gross profit)
Lookers delivered 6% revenue growth and 7% gross profit growth y-o-y, boosting gross profit margin by 80bp. The company has worked on increasing capacity and retaining customers. The use of PCP finance packages and service plans in both new and used car deals is continuing to encourage customers to use Lookers’ dealership facilities. Service plan penetration increased to 39% in H118 having been stable at 38% since 2014 and the number of live service plans is now comfortably above 100k providing an effective annuity for the high margin aftersales business.
UK car market prospects remain subdued
The SMMT (Society of Motor Manufacturers and Traders) new car registration forecast for 2018 has been revised up fractionally as the year has progressed. The forecast released in early August, which is derived from the average consensus of a panel of forecasters, is now for a decline of 4.1% to 2.436m units from 2.541m in 2017. A further 1.9% decline is anticipated in 2019. New light commercial vehicle (van) sales are expected to fall by 0.8% to 0.359m vehicles this year and remain broadly stable in 2019. Both car and van sales remain at very high levels in historical terms.
The implication of these forecasts is the new car market will see a more moderate fall in sales of c 2% in H218, compared to the 6.3% decline in H1.
While the distortion in the new car market caused by the April 2017 VED changes have now largely worked through the comparisons, the confidence of buyers remains low, both for business and private consumers. This is despite what we would consider are supportive overall economic fundamentals in terms of labour markets and the low interest rate environment. The tarnishing of diesel as a main engine choice, which in our view may be misguided given the improved emissions of Euro 6-compliant diesel engines, continues to defer purchase decisions. Diesel’s share of the new car market continued to fall sharply in H118 to 32.3%, down from 47.7% in 2016 and a peak of 50.8% in 2012.
Exhibit 6: UK annual new car registrations (millions) (2000-2019e)
|

|
|
|
We feel the concerns of the FCA regarding the use of PCP plans has been addressed in the main, especially with regards to larger dealerships and new and younger used car sales. The main stumbling block appears to be Brexit, which continues to weigh heavily on the timing of vehicle replacement decisions.
As mentioned, the SMMT forecast has just been modestly improved to a decline of 4.1% in the current year. However, it is unclear how much allowance this makes for what appears to be the potential for significant supply-side disruption in H218 from the introduction of the new vehicle testing regime in Europe, the Worldwide Harmonised Light Vehicle Test Procedure (WLTP). Lookers does not currently believe WLTP will represent a material issue, but it recognises that it has the potential to result in some volatility to the supply of new vehicles. Overall, Lookers continues to view the business implications of the current political climate, Brexit and exchange rates as “Unhelpful.” However, management has stated it is happy with FY18 market estimates.
Neutral impact expected by Lookers from WLTP
WLTP is a testing system being introduced in the European Union to measure fuel consumption and CO2 emissions from passenger cars, as well as pollutant emissions. It follows recent emission testing scandals and is designed to provide more realistic and accurate data. It replaces the previous regime from the 1980s called the NEDC (New European Driving Cycle). The main difference is the NEDC lab test used a theoretical driving cycle, whereas WLTP tests models over a variety of driving conditions, including actual driving data.
For every car type, every engine variant is tested for the lightest and heaviest version. The regime is therefore more complex for manufacturers in terms of the numbers of models to be tested.
Initially coming into force from 1 September 2017, WLTP is to replace NEDC for all vehicles from 1 September 2018. The interim period has been one of transition. Any vehicles produced since 1 June 2018 can only be sold after 1 September 2018 if they are processed under WLTP. Cars produced before this date that are not WLTP tested have a 12-month derogation period for up to 10% of a manufacturer’s total sales volumes during which time they can be registered. It appears that some manufacturers may encourage some pre-registration of non-compliant vehicles before the September deadline.
In addition, the supply of compliant new vehicles in the busy September registration month may be abnormally constrained and possibly spread new registrations more evenly through the end of 2018 and even into 2019. With pre-registrations likely to unwind after the deadline, the supply of high quality, nearly new cars could boost used sales but at a likely detriment to margins.
Lookers is not expected to be alone in being affected by these factors as WLTP is an industry-wide issue. Clearly the impact for each retailer will likely be dependent on brand mix. Lookers’ management feels that the transition to WLTP may distort registrations over the period, boosting August and lowering September and subsequent months, but expect the overall impact on H218 to be relatively neutral. We thus expect to see modestly lower new car revenues year-on-year for Lookers in H218 due to the potential supply-side constraint, strong used car sales and a solid aftersales performance. The overall retail operating margin is likely to remain stable due to the factors affecting both used and new car markets.
Management has indicated that the weak H217 profitability appears to have been an anomaly. An analysis of the contribution to PBT by half year indicates an historic trend of closer to 65% from H1 and 35% from H2. Management believes that notwithstanding WLTP, a reversion to the more normal historic trend in FY18 is highly likely. The impact of the sharp fall in new car diesel sales in the UK and its effect on residual values only really started to affect the market from June 2017. There was therefore a large step down in H217, which led to the lower profit contribution especially from used cars. The split was exacerbated by the record Q1 performance in 2017, due to the distortions caused by the change to VED rates in the UK. As trends and most importantly residual values have now stabilised, management expects a much stronger H2 performance in the current year than in FY17.
Exhibit 7: H1-H2 historic trend analysis and FY18 forecast (Edison)
|

|
Source: Company reports, Edison Investment Research
|