Last close As at 05/08/2026
—
— 0.00 (0.00%)
Market capitalisation
—
Research: Investment Companies
Fidelity Asian Values (FAS) is managed by Nitin Bajaj, who aims to both grow and preserve shareholders’ capital, seeking double-digit annual total returns over a three- to five-year timeframe. The manager seeks to mitigate large capital losses in the portfolio by avoiding companies with high valuation multiples, extended balance sheets, modest margins and low liquidity. He is mindful to keep sufficient resources available to take advantage of investment opportunities when they arise. The last chance for investors to exercise their FAS subscription shares is on 29 November 2019, with the exercise price representing a 1.8% discount to the current share price.
Fidelity Asian Values |
Last subscription share opportunity coming up |
Investment trusts |
31 October 2019 |
Share price/discount performance
Three-year performance vs index
Gearing
Analysts
|
|||||||||||||||||||||||||||||||||||||||||||||||||||||||||||||||||||||||||||||||||||||
Fidelity Asian Values (FAS) is managed by Nitin Bajaj, who aims to both grow and preserve shareholders’ capital, seeking double-digit annual total returns over a three- to five-year timeframe. The manager seeks to mitigate large capital losses in the portfolio by avoiding companies with high valuation multiples, extended balance sheets, modest margins and low liquidity. He is mindful to keep sufficient resources available to take advantage of investment opportunities when they arise. The last chance for investors to exercise their FAS subscription shares is on 29 November 2019, with the exercise price representing a 1.8% discount to the current share price.
|
Superior growth prospects in the Asia-Pacific region |
|
|
Source: International Monetary Fund, Edison Investment Research |
The market opportunity
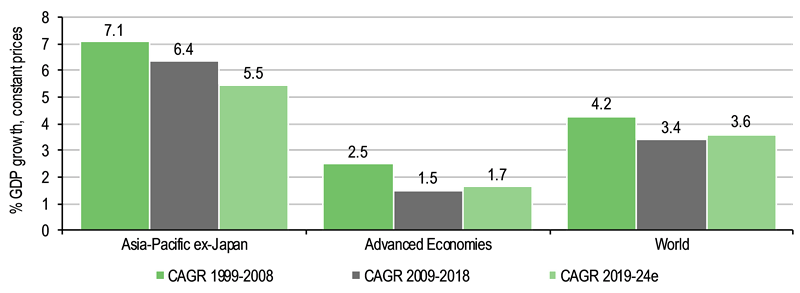
As shown in the chart above, Asia has higher growth prospects compared with developed markets and the global economy; factors for this include consumption growth and infrastructure spending. Equity valuations in the region are also relatively attractive, suggesting investors may benefit from an allocation to Asia as part of a global portfolio.
Why consider investing in Fidelity Asian Values?
■
Well-defined, repeatable investment process – good businesses, with good management teams, bought at a good price.
■
Diversified Asian exposure, primarily in smaller-cap companies; the manager aims to invest in the ‘winners of tomorrow’.
■
Focus on long-term capital growth and preservation.
■
Mid- and long-term outperformance versus the benchmark.
■
Recent step-up in FAS’s dividend yield.
Now regularly trading at a premium
FAS is currently trading at a 0.1% discount to cum-income NAV, which compares to the 2.5% average premium over the last 12 months and the 2.2% to 7.8% range of average discounts over the last three, five and 10 years. While the trust’s manager focuses on capital growth and preservation, in recent years there has been a regular progression in the annual dividend (see Exhibit 1). FAS currently offers a 2.2% dividend yield.
Exhibit 1: Trust at a glance
Investment objective and fund background |
Recent developments |
||||||||||||||||||||||||||||||||||||||||||||||||||||||||||||||||||||||||||||||||||||||||||||||
Fidelity Asian Values aims to generate long-term capital growth principally from the stock markets in the Asia Pacific ex-Japan region. It is benchmarked against the MSCI All Countries Asia ex-Japan index, with a proposal at the December 2019 AGM to change to the MSCI All Countries Asia ex-Japan Small Cap index. |
■ 25 October 2019: Announcement of the final exercise date for subscription rights (29 November 2019). ■ 15 October 2019: results for the year ended 31 July 2019. NAV TR +8.2% versus benchmark TR +3.9%. Share price TR +12.3%. Declaration of 8.8p per share annual dividend. ■ 18 June 2019: announcement of the appointment of Clare Brady as a non-executive director with effect from 1 August 2019. ■ 16 April 2019: results for the half-year ended 31 January 2019. NAV TR |
||||||||||||||||||||||||||||||||||||||||||||||||||||||||||||||||||||||||||||||||||||||||||||||
Forthcoming |
Capital structure |
Fund details |
|||||||||||||||||||||||||||||||||||||||||||||||||||||||||||||||||||||||||||||||||||||||||||||
AGM |
6 December 2019 |
Ongoing charges |
1.17% (FY18) |
Group |
FIL Investments International |
||||||||||||||||||||||||||||||||||||||||||||||||||||||||||||||||||||||||||||||||||||||||||
Interim results |
April 2020 |
Net gearing |
0.1% |
Manager |
Nitin Bajaj |
||||||||||||||||||||||||||||||||||||||||||||||||||||||||||||||||||||||||||||||||||||||||||
Year end |
31 July |
Annual mgmt fee |
Variable (see page 8) |
Address |
Beech Gate, Millfield Lane, Lower Kingswood, Tadworth, Surrey, KT20 6RP |
||||||||||||||||||||||||||||||||||||||||||||||||||||||||||||||||||||||||||||||||||||||||||
Dividend paid |
December |
Performance fee |
None |
||||||||||||||||||||||||||||||||||||||||||||||||||||||||||||||||||||||||||||||||||||||||||||
Launch date |
13 June 1996 |
Trust life |
Indefinite, subject to vote |
Phone |
0800 41 41 10 or 0800 41 41 81 (IFAs) |
||||||||||||||||||||||||||||||||||||||||||||||||||||||||||||||||||||||||||||||||||||||||||
Continuation vote |
Five-yearly, next 2021 |
Loan facilities |
None |
Website |
|||||||||||||||||||||||||||||||||||||||||||||||||||||||||||||||||||||||||||||||||||||||||||
Dividend policy and history (financial years) |
Share buyback policy and history (financial years) |
||||||||||||||||||||||||||||||||||||||||||||||||||||||||||||||||||||||||||||||||||||||||||||||
Dividends are paid annually in December. |
Renewed annually, FAS has the authority to repurchase up to 14.99% of shares and allot shares up to the equivalent of 10% of the issued share capital. Allotments in the chart below include the exercise of subscription shares. |
||||||||||||||||||||||||||||||||||||||||||||||||||||||||||||||||||||||||||||||||||||||||||||||
|
|
||||||||||||||||||||||||||||||||||||||||||||||||||||||||||||||||||||||||||||||||||||||||||||||
Shareholder base (as at 30 September 2019) |
Portfolio exposure by geography (as at 30 Sept 2019, excluding cash) |
||||||||||||||||||||||||||||||||||||||||||||||||||||||||||||||||||||||||||||||||||||||||||||||
|
|
||||||||||||||||||||||||||||||||||||||||||||||||||||||||||||||||||||||||||||||||||||||||||||||
Top 10 holdings (as at 30 September 2019) |
|||||||||||||||||||||||||||||||||||||||||||||||||||||||||||||||||||||||||||||||||||||||||||||||
|
|||||||||||||||||||||||||||||||||||||||||||||||||||||||||||||||||||||||||||||||||||||||||||||||
Source: FAS, Edison Investment Research, Bloomberg, Morningstar. Note: *N/A where not in end-September 2018 top 10.
Market outlook: Favourable growth and valuation
Over the last five years, Asian equities have outpaced the performance of UK shares, but trailed the global market, all in sterling terms (Exhibit 2, LHS). As shown in the front-page chart, Asia has superior growth prospects, helped by consumption growth and infrastructure spending. Despite this backdrop, Asian equities continue to trade at a discount to the world market (Exhibit 2, RHS). Near-term investor concerns include a slowdown in economic growth, which is partly due to the escalation in tensions between the US and its trading partners. However, investors with a longer-term perspective may wish to consider an allocation to Asia given its relatively favourable growth and valuation backdrop.
|
Exhibit 2: Market performance and valuation |
|
Performance of indices, last five years (in £ terms) |
Valuation of Asia ex-Japan equities |
|
|
|
Source: Refinitiv, Edison Investment Research. Note: At 30 October 2019. |
|
Fund profile: Focus on undervalued businesses
Launched in June 1996, FAS is listed on the Main Market of the London Stock Exchange. Since 1 April 2015 the lead manager has been Nitin Bajaj, who aims to achieve long-term capital growth from a diversified portfolio of Asia ex-Japan equities. The manager is able to draw on the broad resources of Fidelity’s Asia Pacific ex-Japan investment team, which includes five dedicated small-cap analysts. He seeks companies that are trading at a discount to their intrinsic value.
Bajaj invests across the market cap spectrum, generally favouring smaller companies, and there are no set limits on geographic and sector exposure, although he restricts single country and sector weightings to 25% and 15% of the fund respectively. Guidelines state that, at the time of investment, up to 10% of gross assets may be invested in a single company, a maximum of 5% may be in companies listed or domiciled outside the Asian region (if they have a high economic exposure to the area) and up to 5% may be unlisted securities (if they are expected to list in the foreseeable future). Derivatives are permitted as a cheaper alternative form of gearing to bank loans (contracts for difference) and to hedge equity market risks, while the manager seeks to improve FAS’s returns by taking short positions. Total derivative exposure is limited to 40% of NAV based on gross assets and 30% of NAV based on net market exposure. In the medium to long term, the board expects net market exposure to be 90–115%. At end-September 2019, net market gearing was 0.1%. FAS’s currency exposure is generally unhedged.
The trust’s performance is benchmarked against the MSCI All Countries Asia ex-Japan index. However, as the manager finds more mispriced securities at the smaller end of the market-cap spectrum, there will be a proposal at the 6 December 2019 AGM to change the benchmark to the MSCI All Countries Asia ex-Japan Small Cap index. If approved, the benchmark change will be effective from the beginning of the second half of FY20 (1 February 2020); there will be no change in the way FAS is managed.
The fund manager: Nitin Bajaj
The manager’s view: Choppy markets likely to continue
Bajaj acknowledges that markets across Asia and the rest of the world have been choppy over the last year. Investors are weighing up the favourable backdrop of low interest rates and fiscal stimulus versus the less palatable slowdown in economic growth and this conflict is leading to stock market volatility. The manager says this environment is not uncommon for the later stages of a business cycle. In 2018, the broad Asian market delivered a below-average total return, while small-caps in aggregate declined. So far in 2019, larger companies, especially growth stocks, have performed better than small caps and value stocks (across the globe, not just in Asia). Bajaj says growth or value leadership in the market is ‘part and parcel of investing’ and although it is difficult to forecast the magnitude of the swings in style, the trends always reverse.
The manager undertakes a quarterly review of the markets and notes there has been no material change in the macro environment; important drivers continue to be the stage of the US economic cycle, the property market and the level of credit in the China, along with unforeseen events such as the dispute between the US and its trading partners. All of these factors are contributing to stock market volatility. Bajaj suggests no one knows where we are in the US economic cycle and although recent Chinese data suggest the economy is stabilising, it is impossible to call the trend.
In terms of corporate earnings estimate reductions, the manager says it is important to determine when company valuations make sense. Global estimates have declined, in aggregate, by around 15% since the peak in May 2018, as economic growth has moderated. Bajaj notes that the shares of good-quality companies are still being dragged down in the market, although there are pockets of relative strength in Asia, such as China A shares. Generally, small caps have suffered multiple compression; the manager says there are plenty of cheap stocks in the polarised market, with many companies trading on forward P/E multiples of less than 10x. He emphasises that FAS’s portfolio continues to hold high-quality stocks, although its aggregate forward P/E multiple of 8.9x is at the low end of the historical range of Bajaj’s tenure. While the fund has a lower valuation versus the index, it also has an above-index return on equity.
The manager says his investment philosophy, which has been built around years of practice and observation, remains unchanged: he buys good companies, run by good people, at a good price. There are c 140 names in FAS’s portfolio and the manager says he has been able to deploy capital into small-cap stocks that are being ignored by investors.
Asset allocation
Investment process: Bottom-up stock selection
Bajaj favours undervalued smaller-cap companies that can grow into ‘the winners of tomorrow’ and have not been recognised by the wider market. There is an intense focus on avoiding large losses in the portfolio; to help achieve this, the manager seeks to invest in good businesses with robust balance sheets, run by competent and honest managers, at a price that provides a margin of safety for errors. There are c 18,000 listed companies in Asia, providing a deep pool of investment opportunities. The manager highlights three elements of the investment process:
■
The business: Bajaj says this is the first and most critical step. He and his team aim to understand the key drivers of each business, its industry structure, management team, history, a firm’s competitive advantage and durability. The team analyses the last 15–20 years of a company’s financial statements to understand its returns on capital over an economic cycle. This analysis is followed by many meetings with a firm’s management team and other interested parties, including its customers and competitors. The manager is only interested in investing in companies with high-quality management teams.
■
Valuation: Bajaj says the entry point for a new position is important, as it sets the base price for compounding capital and determines a margin of safety. Valuation metrics employed by the team vary, depending on which are the most logical for each company.
■
Downside protection: to help mitigate the risk of big losses in FAS’s portfolio, the manager avoids companies with untested business models, or which have high levels of debt. He does not overpay for a good business or pay a reasonable price for a bad business and will not initiate a position during an industry down cycle.
Current portfolio positioning
At end-September 2019, FAS’s top 10 positions made up 22.6% of NAV, which was broadly in line with 22.3% a year earlier; three positions were common to both periods. The fund’s small-cap bias is illustrated in Exhibit 3, with a 54.6pp overweight in smaller companies with market caps up to £1bn and a 48.4pp underweight to larger-cap firms compared with the current benchmark.
Exhibit 3: Portfolio exposure by market cap (% unless stated)
Portfolio end- |
Portfolio end- |
Change |
Index |
Active weight |
Trust weight/ |
|
>£10bn |
13.2 |
21.1 |
(7.9) |
61.6 |
(48.4) |
(0.4) |
£5-10bn |
5.1 |
3.5 |
1.6 |
15.0 |
(9.9) |
(0.4) |
£1-5bn |
21.5 |
25.3 |
(3.8) |
13.6 |
7.9 |
3.2 |
£0-1bn |
55.3 |
53.2 |
2.0 |
0.7 |
54.6 |
1.0 |
Other index/unclassified* |
5.0 |
(3.2) |
8.2 |
9.1 |
(4.1) |
0.8 |
100.0 |
100.0 |
100.0 |
Source: Fidelity Asian Values, Edison Investment Research. Note: Adjusted for cash. *Includes short positions.
Over the 12 months to end-September, the largest geographic change is a higher weighting to India (+7.5pp, Exhibit 4). The manager’s unconstrained approach is illustrated by the fund’s meaningful deviations compared with the benchmark, such as its underweight in China (-17.0pp) and overweights in India (+12.5pp) and Indonesia (+8.1pp).
FAS’s underweight exposure versus the benchmark in China/Hong Kong reflects the manager’s cautious view on the Chinese housing bubble; he is avoiding Chinese domestic financial and real estate stocks due to their high levels of leverage. Within China, Bajaj focuses on market leaders that are trading on cheap valuations, such as condiments maker Fufeng, BOC Aviation, the largest aircraft lessor in Asia, and battery manufacturers Chaowei Power and Tianneng Power International.
The trust’s US exposure includes IT services company Cognizant, which has a significant presence in India, and generic drug company Mylan, which has production bases in India and Malaysia and is benefiting from higher volumes of generic drugs within the pharmaceutical industry.
FAS has modest exposure to frontier markets, including a recent new position in Vietnam. Vietnam Engine and Agricultural Machinery Corporation makes engines and farm equipment, but is also the largest car manufacturer in the country, with joint ventures with Ford, Honda and Toyota.
In terms of sector exposure (Exhibit 5), FAS’s largest deviations versus the index are overweights in industrials (+6.0pp), consumer discretionary (+5.4pp) and utilities (+5.3pp), with underweights in financials (-5.9pp) and IT (-5.6pp). Although underweight financials in aggregate, Bajaj has increased FAS’s exposure to non-bank financials in India. Over the last 12–18 months, there has been a crisis in the sector following a default from infrastructure financier Infrastructure Leasing & Financial Services (IL&FS), one of the largest non-bank lenders. This has led to extreme investor risk aversion and the manager says valuations in the sector have come down to attractive levels. He explains that non-bank lenders provide essential credit within the Indian economy, as a large part of the population is under-banked or unable to obtain credit from traditional lenders. Within the sector, Bajaj focuses on the companies he considers to have the best business models, with the best management teams and the best underwriting standards; he stresses that, in keeping with his investment process, valuation entry points have to provide enough of a margin of safety.
Exhibit 4: Portfolio geographic exposure vs benchmark (% unless stated)
Portfolio end- |
Portfolio end- |
Change |
Index |
Active weight |
Trust weight/ |
|
India |
22.9 |
15.4 |
7.5 |
10.4 |
12.5 |
2.2 |
China |
20.7 |
22.1 |
(1.4) |
37.8 |
(17.0) |
0.5 |
Indonesia |
10.5 |
10.5 |
0.0 |
2.4 |
8.1 |
4.4 |
South Korea |
9.6 |
10.7 |
(1.1) |
14.3 |
(4.8) |
0.7 |
Taiwan |
7.7 |
9.9 |
(2.2) |
13.5 |
(5.9) |
0.6 |
USA |
6.0 |
N/S |
N/A |
0.0 |
6.0 |
N/A |
Philippines |
5.1 |
6.4 |
(1.3) |
1.3 |
3.8 |
3.9 |
Hong Kong |
4.7 |
5.7 |
(1.0) |
10.6 |
(5.9) |
0.4 |
Singapore |
4.1 |
4.7 |
(0.6) |
3.8 |
0.3 |
1.1 |
Thailand |
2.3 |
4.8 |
(2.5) |
3.4 |
(1.1) |
0.7 |
Other |
6.5 |
9.8 |
(3.3) |
2.4 |
4.1 |
2.7 |
100.0 |
100.0 |
100.0 |
Source: Fidelity Asian Values, Edison Investment Research. Note: Adjusted for cash. *N/S = not stated, previously included in other.
Exhibit 5: Portfolio sector exposure vs benchmark (% unless stated)
Portfolio end- |
Portfolio end- |
Change |
Index |
Active weight |
Trust weight/ |
|
Consumer discretionary |
19.0 |
16.0 |
3.0 |
13.6 |
5.4 |
1.4 |
Financials |
17.6 |
16.9 |
0.7 |
23.4 |
(5.9) |
0.8 |
Industrials |
12.9 |
13.2 |
(0.3) |
6.9 |
6.0 |
1.9 |
Information technology |
12.3 |
11.7 |
0.5 |
17.8 |
(5.6) |
0.7 |
Utilities |
8.6 |
8.9 |
(0.2) |
3.3 |
5.3 |
2.6 |
Consumer staples |
7.6 |
7.5 |
0.1 |
5.4 |
2.2 |
1.4 |
Healthcare |
6.8 |
6.3 |
0.5 |
2.8 |
4.0 |
2.4 |
Materials |
5.4 |
5.3 |
0.1 |
4.4 |
1.0 |
1.2 |
Energy |
4.4 |
4.1 |
0.3 |
4.4 |
(0.0) |
1.0 |
Real estate |
3.6 |
3.4 |
0.2 |
5.9 |
(2.3) |
0.6 |
Communication services |
1.9 |
6.7 |
(4.9) |
12.0 |
(10.1) |
0.2 |
100.0 |
100.0 |
100.0 |
Source: Fidelity Asian Values, Edison Investment Research. Note: Adjusted for cash.
Performance: Outperforming over the mid/long term
Exhibit 6: Five-year discrete performance data
12 months ending |
Share price |
NAV |
Blended |
MSCI AC Asia |
FTSE All-Share |
30/09/15 |
(8.4) |
(3.7) |
(6.3) |
(6.0) |
(2.3) |
30/09/16 |
53.8 |
49.5 |
36.6 |
36.6 |
16.8 |
30/09/17 |
14.5 |
10.0 |
19.1 |
19.1 |
11.9 |
30/09/18 |
8.9 |
1.7 |
4.7 |
4.7 |
5.9 |
30/09/19 |
7.4 |
5.5 |
2.5 |
2.5 |
2.7 |
Source: Refinitiv. Note: All % on a total return basis in pounds sterling. *Blended benchmark is MSCI AC Far East ex-Japan index to 31 July 2015 and MSCI AC Asia ex-Japan index thereafter.
In FY19 (to 31 July), despite the headwind of small caps underperforming the broader market, FAS’s NAV and share price total returns of +8.2% and +12.3% were well ahead of the benchmark’s +3.9% total return. Bajaj comments that although investor sentiment towards Asian equities has been negatively affected by the US-China trade dispute, he is willing to hold high-conviction positions through short-term blips. Positive contributors include low-cost airline Cebu Pacific, Kentucky Fried Chicken franchisee Fast Food Indonesia and food additives maker Fufeng, whereas less successful positions include IT services company Cognizant, which has undergone a change in management and has experienced client-specific issues.
|
Exhibit 7: Investment trust performance to 30 September 2019 |
|
Price, NAV and benchmark total return performance, one-year rebased |
Price, NAV and benchmark total return performance (%) |
|
|
|
Source: Refinitiv, Edison Investment Research. Note: Three, five and 10-year performance figures annualised. Blended benchmark is MSCI AC Far East-ex Japan index to 31 July 2015 and MSCI AC Asia ex-Japan index thereafter. |
|
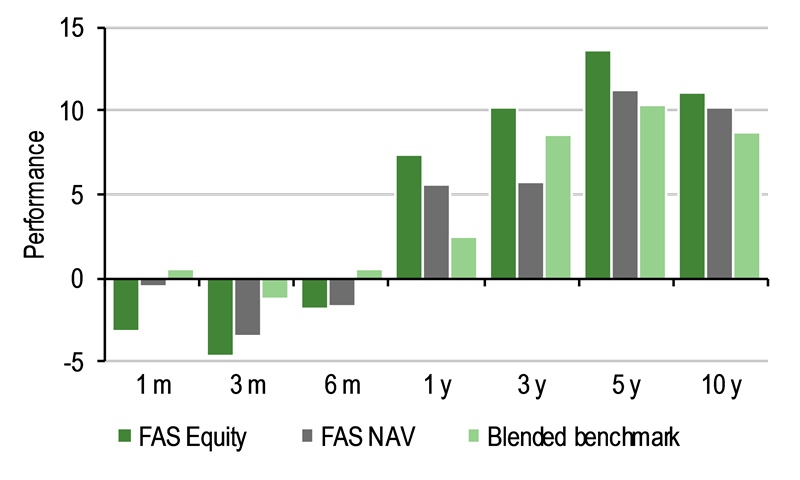
Exhibit 8 shows FAS’s relative returns. Its NAV total return has outperformed the benchmark over one, five and 10 years, while its share price total return is also above the index’s total return over three years. The trust’s performance in recent months has been negatively affected by the continued rotation away from value stocks, and an underweight exposure to Taiwan, which has performed relatively well. FAS has outperformed the bellwether UK index in both NAV and share price terms over one, three, five and 10 years, particularly over the last five and 10 years.
|
Exhibit 8: Share price and NAV total return performance, relative to indices (%) |
||||||||
|
One month |
Three months |
Six months |
One year |
Three years |
Five years |
10 years |
|
Price relative to MSCI AC Asia ex-Japan |
(3.7) |
(3.5) |
(2.4) |
4.8 |
4.8 |
14.9 |
25.2 |
|
NAV relative to MSCI AC Asia ex-Japan |
(1.1) |
(2.3) |
(2.3) |
3.0 |
(7.6) |
3.5 |
15.1 |
|
Price relative to MSCI AC Far East ex-Japan |
(3.5) |
(3.6) |
(2.3) |
5.7 |
4.7 |
14.5 |
22.7 |
|
NAV relative to MSCI AC Far East ex-Japan |
(0.9) |
(2.4) |
(2.2) |
3.9 |
(7.7) |
3.1 |
12.8 |
|
Price relative to FTSE All-Share |
(6.0) |
(5.9) |
(6.2) |
4.6 |
10.0 |
35.8 |
29.3 |
|
NAV relative to FTSE All-Share |
(3.4) |
(4.7) |
(6.0) |
2.8 |
(3.0) |
22.4 |
18.9 |
|
|
Source: Refinitiv, Edison Investment Research. Note: Data to end-September 2019. Geometric calculation. |
||||||||
|
Exhibit 9: NAV total return performance relative to benchmark over five years |
||||||||
|
||||||||
|
Source: Refinitiv, Edison Investment Research |
||||||||
Capital structure and fees
FAS has 72.5m ordinary shares in issue and 11.1m subscription shares outstanding. The final exercise period for the subscription shares is the 25 business days preceding the last business day on 29 November 2019, at a price of 392.75p per share.
Bajaj believes the trust’s performance is driven by stockpicking, so he does not employ high levels of gearing; when deemed appropriate, he uses long contracts for difference, which are a cheaper source of funding than bank debt. At end-September 2019, net market gearing was 0.1%.
FAS has a variable management fee (effective since 1 November 2018) based on the trust’s performance versus the benchmark. The base fee is 0.7% of net assets per year, with a maximum of 0.9% and a minimum of 0.5%. In FY19, the trust’s variable management fee was 0.78%, 15bp lower than 0.93% in FY18. The FY19 ongoing charges will be released with the full annual report but are expected to be lower than the FY18 figure of 1.17%.
FAS is subject to a five-yearly continuation vote, with the next due at the 2021 AGM.
Dividend policy and record
FAS pays an annual dividend in December, from revenue rather than capital reserves. In FY19, the trust’s revenue return was 10.7p per share (+87.7% year-on-year), whereas the 8.8p proposed dividend is 60% higher compared with 5.5p in FY18. Despite this significant increase in the annual distribution, the board stresses that the fund’s objective is long-term capital growth and the dividend is a function of the trust’s level of income in any financial year. Based on its current share price and the FY19 dividend, FAS offers a 2.2% dividend yield.
Peer group comparison
FAS is a member of the nine-strong AIC Asia Pacific sector (Exhibit 11). Its NAV total returns are above the peer group average over five years, ranking fourth, broadly in line over 10 years, while lagging over one and three years. FAS is one of the two funds trading at the narrowest discount. Its ongoing charge (based on FY18) is the second highest, although no separate performance fee is payable, and it has an above-average dividend yield (based on FY19), ranking second (0.6pp above the mean).
To enable a broader comparison, we also highlight the two funds in the AIC Asia Pacific Smaller Companies sector, which the board considers to be a more appropriate sector for the trust, given its large weighting in small-cap stocks. Its NAV total returns are significantly ahead of this sector’s average over five years and ahead over three years, while lagging over the last one and 10 years.
Exhibit 11: Asian peer groups as at 30 October 2019*
% unless stated |
Market |
NAV TR |
NAV TR |
NAV TR |
NAV TR |
Discount |
Ongoing charge |
Perf. |
Net |
Dividend |
Fidelity Asian Values |
290.0 |
8.4 |
10.2 |
69.1 |
168.1 |
(0.1) |
1.2 |
No |
100 |
2.2 |
Aberdeen New Dawn |
273.6 |
22.4 |
27.7 |
54.4 |
154.5 |
(12.0) |
0.9 |
No |
109 |
1.7 |
Edinburgh Dragon |
511.5 |
24.3 |
26.3 |
57.9 |
161.6 |
(12.4) |
0.8 |
No |
104 |
1.0 |
Invesco Asia Trust |
184.9 |
12.5 |
18.0 |
62.9 |
177.4 |
(13.0) |
1.0 |
No |
100 |
2.6 |
Pacific Assets |
348.4 |
14.4 |
18.3 |
64.0 |
206.7 |
(1.9) |
1.2 |
No |
100 |
1.0 |
Pacific Horizon |
181.7 |
23.3 |
33.7 |
72.0 |
155.1 |
(10.2) |
1.0 |
No |
109 |
0.0 |
Schroder Asian Total Return |
349.9 |
17.6 |
31.6 |
89.5 |
157.5 |
(0.1) |
0.9 |
Yes |
102 |
1.7 |
Schroder AsiaPacific |
726.8 |
16.3 |
22.0 |
73.5 |
210.0 |
(11.3) |
0.9 |
No |
100 |
2.2 |
Witan Pacific |
207.2 |
10.8 |
11.6 |
52.9 |
130.2 |
(8.7) |
1.0 |
Yes |
100 |
2.1 |
Average (9 funds) |
341.6 |
16.7 |
22.1 |
66.2 |
169.0 |
(7.7) |
1.0 |
103 |
1.6 |
|
FAS rank in sector |
5 |
9 |
9 |
4 |
4 |
1= |
2 |
5 |
2 |
|
AIC Asia Pacific Smaller Cos |
||||||||||
Aberdeen Standard Asia Focus |
352.0 |
7.4 |
5.0 |
28.7 |
238.6 |
(12.9) |
1.2 |
No |
102 |
1.8 |
Scottish Oriental Smaller Cos |
295.8 |
11.0 |
5.3 |
35.3 |
227.3 |
(13.5) |
1.0 |
Yes |
100 |
1.2 |
Average (2 funds) |
323.9 |
9.2 |
5.2 |
32.0 |
233.0 |
(13.2) |
1.1 |
101 |
1.5 |
Source: Morningstar, Edison Investment Research. Note: *Performance to 29 October 2019 based on ex-par NAV. TR = total return. Net gearing is total assets less cash and equivalents as a percentage of net assets.
The board
There are six directors on FAS’s board, all of whom are non-executive and independent of the manager. Chairman Kate Bolsover joined the board on 1 January 2010 and assumed her current role on 9 December 2014. Philip Smiley was also appointed to the board on 1 January 2010 and has been the trust’s senior independent director since 30 November 2015. Grahame Stott was appointed as a director on 24 September 2013, Michael Warren on 29 September 2014 and Timothy Scholefield on 30 September 2015.
The newest director is Clare Brady, a chartered company secretary and a graduate of the London School of Economics, who joined the board on 1 August 2019; she is also a member of the management engagement, nomination and audit committees. Brady has extensive experience as a governance professional in the banking and financial services sectors (previous employers include Barclays Capital, Deutsche Bank, HSBC and Republic National Bank of New York). Brady has also held a number of positions in the public sector, including as a director at the International Monetary Fund, based in Washington DC.
FAS’s board will continue to be refreshed over the next two years. Over time, it should revert to five directors; Smiley has announced his intention to retire in the coming year.
|
|
Research: Investment Companies
The Merchants Trust (MRCH) offers investors the potential for long-term capital growth along with a high and growing level of income. Helped by the refinancing of the trust’s high-cost, long-term debt, for FY20 (ending 31 January) the board’s intention is that MRCH’s annual dividend will be at least 4.2% higher year-on-year. Manager Simon Gergel at Allianz Global Investors (AllianzGI) is optimistic about the trust’s prospects, citing a broad opportunity set due to attractive valuations in the UK stock market. He says that at some stage the deeply depressed sentiment towards UK shares should improve, which could lead to a meaningful revaluation of the domestic market.