Is Yatirim Menkul Degerler
Written by
Is Yatirim Menkul Degerler |
A steady ship |
Outlook and FY16 results |
Financial services |
21 February 2017 |
Share price performance
Business description
Next events
Analysts
|
||||||||||||||||||||||||||||||||||||||||||||||||||||
Despite exceptional political events in Turkey during 2016, Is Yatirim’s (ISY) FY16 results showed that its core investment banking business performed well, contributing to strong consolidated net profits, 33% ahead of FY15. Two of its subsidiaries suffered losses but steps have been taken to reduce these in FY17 and other segments performed better than forecast against a challenging backdrop. ISY continues to have a strong balance sheet and is committed to making high distributions to shareholders, so we have maintained our dividend forecast at 10 kuruş.
Year end |
Revenue (TRYm) |
PBT* |
EPS* |
DPS |
P/E |
Yield |
12/15 |
377.5 |
33.7 |
11.4 |
10.0 |
12.0 |
7.3 |
12/16 |
438.9 |
41.6 |
15.2 |
12.68** |
9.0 |
9.3 |
12/17e |
448.0 |
104.7 |
18.7 |
12.68 |
7.3 |
9.3 |
12/18e |
486.8 |
122.9 |
22.0 |
12.68 |
6.2 |
9.3 |
Note: *PBT and EPS are normalised, excluding amortisation of acquired intangibles, exceptional items and share-based payments. **FY16 DPS will be voted on at the AGM.
Good results, especially in the circumstances
Equity and derivative trading in Turkey were broadly flat year-on-year, while ISY’s core investment banking business increased its share of both markets and maintained its market leadership in equity margin trading, asset management and debt issuance, to deliver non-consolidated net profits of TRY87.8m, 82% ahead of FY15 (TRY48.3m). The performance of the subsidiaries was more mixed, with the private equity investments and non-performing loans business facing particularly difficult trading conditions, but asset management and Is Investment Trust delivered higher profits than in 2015. Consolidated net profit of TRY53.9m was ahead of our estimates and the FY15 result. In this outlook note we will give an overview of the whole company and the markets it operates in before examining the FY16 results in more detail.
Estimates modified
While the FY16 results are encouraging and there are tentative signs of a more stable political scene in 2017, we have lowered our forecast revenue and consolidated net profit to account for a possible reduction in FX trading revenues due to a regulation change. Although this reduces our EPS estimates, it does not encroach on our dividend forecast, which assumes that the proposed level of 12.68 kuruş is maintained (above our previous estimate), equating to a yield of 9.3%.
Valuation: Cautious
ISY remains on a lower P/E multiple and higher dividend yield than our selected peer group of major European banks that have investment banking operations. Its price to book value multiple is more closely aligned, at c 0.7x. A ROE/COE approach implies that the market is applying a high country risk premium, as might be expected, leaving room for the valuation to rise if that premium were to fall. An improvement in the political background could be positive for both the required return and the actual return on equity, and therefore positive for the shares.
Investment summary
Company description: Turkey’s leading investment bank
Is Yatirim (ISY), or Is Investment in English, is Turkey’s leading investment bank and part of the İşbank Group, which is the largest private bank in Turkey and owns 71.7% of ISY’s shares. ISY benefits from its parent’s high standing in the investment and business community and large distribution network. ISY was founded in 1996 and has leading market shares in Turkish investment banking activities including equity, bond and derivatives trading, and the issuance of equity and debt. It is also a market leader in asset management as well as having significant private equity interests and a share in Is Investment Trust (whose assets it manages).
Valuation: Risk priced in
As before, we have used a basket of European banks in the absence of any listed local peers. Compared to these, ISY has a substantially higher dividend yield and prospective return on equity and trades at a lower earnings multiple. Our ROE/COE model, explained in more detail on page 10, implies that the market is pricing in considerable country risk. An improvement in the political situation in Turkey could reduce investors’ required return on equity, and therefore increase the value of ISY’s shares, as well as make business conditions better for ISY’s subsidiaries.
Financials: Sensitive to wider economic conditions
ISY’s core investment banking business performed well in 2016, despite considerable headwinds in the form of political unrest and a generally difficult economic climate. Two of the group companies, Is Private Equity and Efes NPL Asset Management were more strongly affected by adverse business conditions, although both are expected to fare better in 2017 as a result of financial and management measures to reduce losses. Is Asset Management and Is Investment Trust both turned in net income above FY15 levels, and those results in such a difficult year may be encouraging for investors, particularly if 2017 brings an improved operating environment. There is some uncertainty around a change to rules governing leverage on FX trading, which could reduce revenues from that activity.
Sensitivities: Geopolitics and the local economy
As stated above and in previous notes, domestic, regional and global political concerns affect ISY, whose fortunes are linked to the performance of the Turkish economy and capital markets, but good results in a difficult year such as 2016 attest to the quality and diversity of ISY’s businesses. Any improvement in conditions should be good for trading and could reduce the country risk premium currently implied. We note the following issues:
■
Political concerns: The failure of a coup in July and the subsequent consolidation of power by the elected government appears to have resolved any leadership challenges and provided a mandate for the government to make progress in resolving internal and regional security concerns. A rapprochement with Russia also bodes well in that regard and peace talks are taking place between rebels and the Syrian government, brokered by Russia, Turkey and Iran.
■
Economic concerns: A high current account deficit makes Turkey’s economic growth vulnerable to foreign capital outflows, as has been seen in 2016. This is exacerbated by wider concerns about emerging market growth and the prospect of US interest rate increases presaged by recent comments from members of the Federal Open Market Committee.
Company description: A diversified investment bank
Is Investment was founded in December 1996 as the investment banking arm of İşbank, which is Turkey’s largest private sector bank. ISY was listed in 2007 and retains its leading position in Turkish capital markets with c TRY6.5bn of assets, representing around 30% of the sector and TRY23.2bn of AUM, around 25% of the sector. It is the only Turkish investment house with a corporate governance rating (9.36/10 at the last review) and has a credit rating of AA+(tur) and a stable outlook from Fitch. As well as offices across Turkey, it has a presence in London (Maxis Investments) and Kazakhstan and employs a total of 25 people abroad in addition to c 350 in Turkey. In the rest of this section we will describe the main business segments, the management team and then look at the climate of Turkish capital markets before examining the FY16 results.
Business segments
Exhibit 1 lists ISY’s subsidiaries, its stake in each business and their contributions to net profit in 2016. ISY consolidates the two companies in which it has less than a 50% interest because of the significant influence it has on their activities.
Exhibit 1: ISY group companies 31 December 2016
Activity |
Company name (in English) |
Ticker |
ISY ownership |
FY16 net profit (TRYm) |
Securities brokerage |
Is Yatirim Menkul Degerler (Is Investment) |
|
100.0% |
87.8 |
Foreign-based subsidiaries |
Maxis Investments, Is Investment Gulf |
(2.7) |
||
Investment Trust |
Is Yatirim Ortakligi (Is Investment Trust) |
ISYAT |
28.9% |
5.6 |
Portfolio management |
Is Asset Management |
70.0% |
11.6 |
|
Private Equity |
Is Girisim Sermayesi (Is Private Equity) |
ISGSY |
29.1% |
(9.1) |
Asset Management |
Efes NPL Asset Management |
74.0% |
(17.7) |
|
Subtotal |
75.5 |
|||
Elimination* |
(21.6) |
|||
Total |
53.9 |
Source: Is Yatirim data. Note: *Dividend and revenue eliminations between subsidiaries.
Is Yatirim Menkul Degerler (Is Investment, ISMEN)
This is the investment bank itself and the main operating entity of the group. Its market shares for its various activities are described in more detail in the results section on pages 4-6 below, but it is Turkey’s leading investment bank and has considerable standing as the investment banking arm of İşbank, which in turn was founded by Ataturk in 1924 to be Turkey’s national bank. It remains Turkey’s only listed investment bank on the star index and has been the first Turkish investment bank to join the International Securities Market Association (ISMA), to launch a hedge fund and has pioneered various financial products and derivatives in Turkey.
Is Yatirim Ortakligi (Is Investment Trust, ISYAT)
ISYAT was established in 1995 as a closed-ended fund and went public in 1996. Around 95% of its shares are traded on the Borsa Istanbul and its capital is managed by another group company, Is Asset Management. It is the largest investment trust in Turkey, with net assets of TRY235m (£52m) as of 31 December 2016, which mainly comprised fixed income assets (61.9%), with equities, cash and other investments making up 14.9%, 6.7% and 16.4%, respectively. It is benchmarked to a blend of Turkish equity and fixed income indices and has a strategy weighted to corporate debt, but with significant flexibility to invest in government bonds and equities as well.
Is Girisim Sermayesi (Is Private Equity, ISGSY)
Separate coverage of ISGSY is available on our website and includes details of its investee companies. It was established in 2002 to invest in companies from the wide range of mid-sized private enterprises that form the bulk of the Turkish economy. A summary of its investments is below, which had a total NAV of TRY139.3m at 31 December 2016, up from TRY131.9m a year earlier. ISGSY also has current assets of TRY119.4m and liabilities of TRY2.6m, giving equity of TRY256.1m. Is Investment consolidates Is Private Equity’s investee companies and reports their value at historic cost, whereas they are held at fair value in Is Private Equity’s accounts. Although valuations have been affected by difficult trading in recent months, the trust has made 14 exits at an average IRR of 26.5% and at a cash exit multiple of 2.3x in US dollar terms, since inception.
Exhibit 2: ISGSY investee companies
Investee company |
Sector |
Amount invested (TRY) |
% ownership |
Value at 31 December (TRY) |
Mika Tur |
Tourism |
11.3m |
20.0% |
13.7m |
Radore |
Data centres |
17.5m |
25.5% |
18.3m |
Numnum (Istanbul Food and Beverage Group) |
Food and drink |
37.0m |
61.7% |
36.2m |
Toksöz Sports |
Clothing retail |
29.4m |
55.0% |
31.6m |
Ortopro |
Healthcare |
US$14.6m |
83.6% |
23.5m |
Nevotek |
Technology |
US$3.0m |
81.2% |
16.0m |
Total |
159.3m |
139.3m |
Source: Is Girisim, TRY3.65/US$ (as at 14 February 2017)
Is Asset Management
Is Asset Management is 70% owned by ISY and offers both discretionary and non-discretionary services, mainly to mutual and pension funds. The latter in particular have been growing in Turkey (Exhibit 3) as a large population of young people begins to save towards retirement, more women enter the workforce and the population ages. Despite the growth shown below, the private saving to GDP ratio remains under 13%, vs c 20% for other comparable countries,1 and demographic, economic and other indicators point to continued growth in the medium term.
IMF Country report No. 16/105: Turkey, selected issues, April 2016, page 5.
|
Exhibit 3: Turkish mutual and pension fund AUM development |
|
|
Source: Is Yatirim, Edison Investment Research |
Efes NPL Asset Management
Efes NPL was established in 2011 to buy and sell non-performing loans (NPLs), principally from Turkish banks, at a discount and take on the operational task of loan collection. Turkish regulations mean that the originator of a loan is unable to reduce the interest rate to accommodate a distressed borrower, and provisions they make against doubtful loans are not tax-deductible. On sale, loans’ interest rates can be amended and the crystallised loss is allowable for tax purposes, which motivates banks to sell their NPLs. The recent turbulence experienced in Turkey has inhibited Efes NPL’s ability to collect loans and interest, leading to losses in 2016, although a new general manager has been appointed who is implementing a turnaround plan.
Management and ownership
The nine-member supervisory board is headed by Ilhami Koç, who became chairman in 2013 having previously been CEO. Seven of the nine, including Mr Koç, have held senior management positions at İşbank or ISY and the others include a range of finance professionals and academics with experience of global and Turkish capital markets. The executive board has six members, led by General Manager Riza Kutlusoy. All but one of them have served at ISY or İşbank since at least the 1990s. Brief biographies of Messrs Koç and Kutlusoy are on page 12 and a detailed corporate governance report is available here, which rates ISY at 93.6%.
ISY’s largest shareholder is İşbank and the next three are subsidiaries of the bank: Is leasing, Is Factoring and Camis Yatirim Holding, which own 71.7% of the shares between them. 40.2% of İşbank is owned by its own pension fund and 28.1% by the Republican People’s Party (the main opposition party in the Turkish parliament), with the remainder being free float.
Sensitivities
Economy and geopolitics
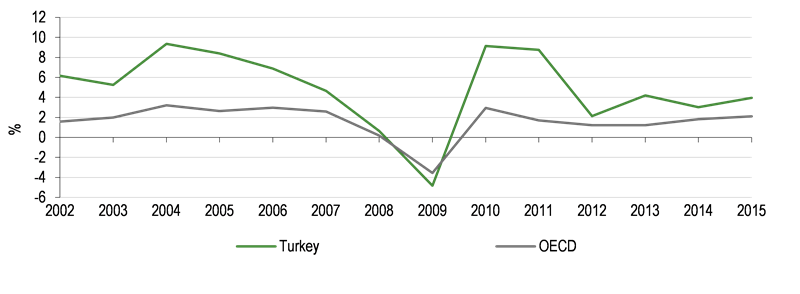
Turkey’s economy has recorded strong GDP growth for most of the last 15 years, outperforming the OECD as a whole and initially recovering strongly from the financial crisis. The last five years have seen lower growth, partly as a result of political turbulence in Turkey and its neighbours. The country has historically relied on foreign direct investment to fund growth, which has been difficult to attract with a major war in Syria to the south, slow growth in the EU (a major export market for Turkey) and an attempted coup in July 2016. On the other hand, the recent improvement of relations with Russia is important: Russia is a major trade partner and one of the three countries (along with Iran and Turkey) now organising peace talks between the Syrian government and rebels; Russians are also normally among Turkey’s main tourist nationalities and Russian airlines have now resumed flights there. Although significant political uncertainty remains, a continued stabilisation of the domestic and regional situation would likely be good for the economy, and particularly for Is Private Equity and Efes NPL Asset Management.
|
Exhibit 4: Turkish and OECD GDP growth, 2002-present |
|
|
Source: World Bank |
Against the background of recent political turmoil, the GDP growth shown in Exhibit 4 has been resilient and the performance of the BIST 100 Index has been strong. In recent months both Turkish equity and bond markets appear to have been affected more by the dollar’s strength since November 2016 than by domestic political events. In equities, that news has been good for domestic investors, with the BIST 100 performing well in lira terms. ISY’s revenues are correlated to financial market activity, for which the performance of the BIST 100 Index is one indicator, and the performance of the investment bank was strong in FY16 (as explained below). For much of the year Turkish government bonds yields fell, before moving back to levels seen in Q1 after November, partly driven by the post-election rise in US government bond yields.
|
Exhibit 5: BIST 100 Index, January 2016 to present |
Exhibit 6: Turkish two-year bond yields |
|
|
|
Source: Bloomberg |
Source: Bloomberg |
|
Exhibit 5: BIST 100 Index, January 2016 to present |
|
|
Source: Bloomberg |
|
Exhibit 6: Turkish two-year bond yields |
|
|
Source: Bloomberg |
Inflation has remained high in Turkey, at over 7.5%, which the central bank has tried to control with high interest rates (currently 8%). These are not conducive to economic growth, although we note that commentators expected a 0.5% increase in January 2017 that did not materialise, leading to a rise in the BIST 100 but further Turkish lira weakness. Although the political and economic outlook in 2017 is uncertain, the performance of Turkish markets in 2016, a year in which they faced strong headwinds, provides a measure of comfort.
Regulatory environment
A possible change to rules governing FX trading may reduce permitted leverage from 100:1 to 10:1, and increase initial margin requirements. This may reduce ISY’s revenues from FX business, but it remains to be seen whether professional investor clients will be bound by these rules. We have borne the potential effect in mind in setting our FY17 and FY18 estimates.
Overview of Q4 and FY16 results
Here we discuss ISY’s performance in each area of activity. Performance statistics for Q4 and FY16 are summarised in Exhibit 7 and later charts and tables illustrate longer-term changes.
Exhibit 7: Performance by market area
Performance by market area |
Q415 |
Q416 |
Y-o-y (%) |
FY15 |
FY16 |
Y-o-y (%) |
Market share (%) |
Derivatives trading (TRYbn) |
27.0 |
42.9 |
58.9 |
100.0 |
132.0 |
32.0 |
11.4 |
Equities trading (TRYbn) |
43.2 |
39.3 |
(9.0) |
151.0 |
160.0 |
6.0 |
7.9 |
FX margin trading (US$bn) |
186.0 |
217.0 |
16.7 |
||||
Debt securities issuance (TRYbn) |
5.8 |
4.3 |
(25.9) |
19.5 |
18.8 |
(3.6) |
20.8 |
M&A deals closed (number) |
4.0 |
3.0 |
(25.0) |
9.0 |
8.0 |
(11.1) |
|
Equity margin trading loans o/s (TRYm) |
433.0 |
273.0 |
(37.0) |
433.0 |
273.0 |
(37.0) |
22.0 |
Assets under management (TRY bn) |
20.6 |
27.6 |
34.0 |
20.6 |
27.6 |
34.0 |
|
Of which: Mutual funds |
8.7 |
11.3 |
29.9 |
8.7 |
11.3 |
29.9 |
23.0 |
Pension funds |
8.7 |
11.2 |
28.7 |
8.7 |
11.2 |
28.7 |
19.0 |
Other funds |
3.2 |
5.1 |
59.4 |
3.2 |
5.1 |
59.4 |
Source: Is Yatirim, Edison Investment Research
Areas with strong performance included derivatives trading, where a 2% growth in the overall market in Turkey was magnified by ISY’s greater market share (rising from 8.8% to 11.4%, Exhibit 8). Equity trading had a slightly weaker fourth quarter but still performed well in FY16 as a whole because of a strong first nine months. The size of the market shrank 1.2%, but again ISY captured a larger portion of it (7.9% vs 7.4% in FY15) and increased its trading activity by 6% year-on-year.
|
Exhibit 8: ISY Securities trading volume and market share |
|
|
Source: Is Yatirim data, Edison Investment Research |
ISY remained the leading investment bank for debt security issuance with 21% market share, a decline on 2015 (24%). The split between debt security IPOs and private placements conducted by ISY has continued to move in favour of placements, as has the wider market.
|
Exhibit 9: Turkey’s debt securities issuance market |
Exhibit 10: Is Investment debt securities issuance |
|
|
|
Source: Is Yatirim data, Edison Investment Research |
|
Exhibit 9: Turkey’s debt securities issuance market |
|
|
Source: Is Yatirim data, Edison Investment Research |
|
Exhibit 10: Is Investment debt securities issuance |
|
|
Source: Is Yatirim data, Edison Investment Research |
Equity margin trading was more challenging, with both a fall in the size of the market and a reduction in ISY’s market share, from 29% to 22%. FX margin trading has now reached sufficient scale and persistence to be reported as a separate indicator, a successful diversification of the group’s income streams. Arbitrage is among other areas it is exploring for further diversification.
|
Exhibit 11: Equity margin trading volume |
Exhibit 12:ISY FX margin trading volume |
|
|
|
Source: Is Yatirim data, Edison Investment Research |
|
Exhibit 11: Equity margin trading volume |
|
|
Source: Is Yatirim data, Edison Investment Research |
|
Exhibit 12:ISY FX margin trading volume |
|
|
Source: Is Yatirim data, Edison Investment Research |
Is Asset Management grew net profits by 27% in FY16 and management expects to be able to maintain momentum because assets under management have continued to rise faster than the growing mutual and pension fund market, increasing market shares slightly to 19% and 23% of pension and mutual fund assets, respectively. Consolidated AUM, which includes the assets of Is Investment Trust, reached TRY27.6bn. Is Investment Trust’s shares were up 4.35% over 2016, as well as paying a dividend of 13 kuruş (a 13% yield on the cum-dividend price). Unsurprisingly, the share price reacted to the attempted coup in July, falling from TRY0.86 to TRY0.80, but it recovered to TRY0.99 by the year-end.
|
Exhibit 13: Development of assets under management since 2007 |
|
|
Source: Is Yatirim data. Note: AUM denominated in Turkish lira. |
The analysis of revenues in Exhibit 14 shows FY16 interest and trading income flat year-on-year, partly as a result of the reduction in interest rates in September. This was more than offset by the growth of commission revenues where brokerage and corporate finance both had increases of over 40% vs FY15. As we wrote in our last note, ISY offers derivative trading outside Turkey, which is a significant differentiator from most of its domestic competitors. The M&A market was slower than in 2015, mainly due to the political situation in Turkey, but Is Investment advised on three deals that closed in Q4, bringing the total for the year to eight. Equity IPO activity was muted and we understand that ISY has not budgeted for participation in any IPOs in 2017. Asset management also delivered a solid contribution.
Exhibit 14: Revenue analysis
TRYm |
Q415 |
Q416 |
Y-o-y (%) |
FY15 |
FY16 |
Y-o-y (%) |
Interest and trading income |
61.4 |
55.0 |
(10.5) |
211.0 |
212.5 |
0.7 |
Commission revenues |
51.6 |
62.2 |
20.6 |
166.6 |
226.5 |
36.0 |
of which: |
||||||
Brokerage |
36.2 |
42.1 |
16.4 |
108.5 |
160.2 |
47.7 |
Corporate finance |
4.8 |
9.0 |
86.8 |
17.9 |
25.2 |
40.9 |
Asset management |
9.9 |
10.5 |
6.4 |
37.8 |
38.4 |
1.6 |
Other commissions |
0.7 |
0.6 |
(14.4) |
2.5 |
2.8 |
10.5 |
Total revenue |
113.0 |
117.2 |
3.7 |
377.5 |
438.9 |
16.3 |
Source: Is Yatirim data, Edison Investment Research
Annual cost growth of 13% year-on-year was driven in part by the decline in the Turkish lira (down 17.3% vs the US dollar over 2016), which made costs denominated in foreign currencies higher, and by higher transaction volumes. The reduction of the cost ratio to 81% from 83% despite the FX headwind is encouraging.
Exhibit 15: Cost analysis
TRYm |
Q415 |
Q416 |
Y-o-y (%) |
FY15 |
FY16 |
Y-o-y (%) |
Marketing sales and distribution |
28.4 |
35.7 |
25.7 |
84.0 |
117.0 |
39.3 |
General administration |
62.6 |
59.2 |
(5.5) |
226.7 |
235.5 |
3.9 |
Other operating expenses |
1.0 |
1.0 |
1.4 |
3.9 |
3.3 |
(13.7) |
Total costs |
92.1 |
95.9 |
4.2 |
314.5 |
355.8 |
13.1 |
% of revenue |
81 |
82 |
83 |
81 |
Source: Is Yatirim data, Edison Investment Research
Finally we look at net profit by business segment (Exhibit 16), which sums to a consolidated net profit of TRY53.9m, slightly exceeding our forecast of TRY53.5m, with some variation among the underlying segments. Both Is Private Equity and Efes NPL Asset Management had difficult years, affected by the political situation in Turkey and the region. Efes in particular has faced challenges: it has been difficult to make collections and losses have mounted through the year. The business now has a new manager and a new strategy has been adopted, which is expected to reduce losses in FY17. The performances of Is Private Equity’s investee companies are expected to improve as well: they have had rights issues that will enable them to reduce interest costs and better performance is expected in FY17. The contribution to Is Yatirim’s consolidated net profit was TRY5.6m, vs TRY1.7m in FY15. Is Investment, the main operating entity in the group, saw the best performance of any segment compared with FY15. This was helped by generally resilient markets as described above, enabling it to report a return on equity (ROE) of 15.5% for the year.
Exhibit 16: Net profit analysis
TRYm |
Q415 |
Q416 |
Y-o-y (%) |
FY15 |
FY16 |
Y-o-y (%) |
Is Investment only |
7.3 |
20.0 |
174% |
48.3 |
87.8 |
82% |
Foreign-based subsidiaries |
-1.6 |
-1.0 |
-38% |
-5.7 |
-2.7 |
|
Is Investment Trust |
1.5 |
1.5 |
0% |
1.7 |
5.6 |
|
Is Private Equity |
-3.8 |
-3.4 |
-11% |
-7.3 |
-9.1 |
(25%) |
Is Asset Management |
2.2 |
3.2 |
45% |
9.1 |
11.6 |
27% |
Efes NPL Asset Man. |
7.2 |
-3.9 |
n.a. |
12.9 |
-17.7 |
N/A |
Elimination Adjustments |
0.2 |
-2.8 |
n.a. |
-18.5 |
-21.6 |
(17%) |
Consolidated Net Profit |
13.0 |
13.6 |
5% |
40.5 |
53.9 |
33% |
Source: Is Yatirim data, Edison Investment Research
Changes to estimates
We have adjusted our FY17 estimates and introduced forecasts for FY18. Although FY16 results were strong, we have taken a conservative approach to the possible impact of the FX leverage restriction and reduced our revenue estimate for ISY by assuming that revenues at the investment bank are flat from FY16 to FY17. This feeds through to lower net profit for the main operating entity than previously forecast and reduces EPS similarly. It does not affect our forecast dividends, which we estimate will be covered 1.9x by earnings in FY17. We expect losses at Is Private Equity and Efes NPL to be reduced and that other segments will continue to perform well. On 20 February the board of directors resolved to propose a dividend of 12.68 kuruş per share at the AGM in April, a 91% payout ratio equivalent to a 9.3% yield on the current share price of TRY1.36.
Exhibit 17: Estimate changes and comparison with actual FY16 results
Revenue (TRYm) |
Attributable profit (TRYm) |
EPS (Kr) |
DPS (Kr) |
|||||||||
Estimate |
Actual |
% difference |
Estimate |
Actual |
% difference |
Estimate |
Actual |
% difference |
Estimate |
Actual |
% difference |
|
2016 |
425.4 |
438.9 |
3.2% |
53.5 |
53.9 |
0.7% |
15.1 |
15.2 |
0.5% |
10.0 |
12.68 |
26.8% |
Old |
New |
% change |
Old |
New |
% change |
Old |
New |
% change |
Old |
New |
% change |
|
2017e |
457.1 |
448.0 |
-2.0% |
75.2 |
66.5 |
-11.6% |
21.2 |
18.7 |
-11.7% |
10.0 |
12.68 |
26.8% |
2018e |
486.8 |
78.1 |
22.0 |
10.0 |
12.68 |
26.8% |
||||||
Source: Is Yatirim data, Edison Investment Research
Valuation
As we have noted in the past, there are no other quoted investment banks with the same regional presence or business mix as ISY and we therefore compare it to a basket of European banks with substantial investment banking operations. These comparators’ share prices have recovered in H216 from fears of a global economic slowdown, the expectation of US interest rates remaining low for longer and poor performance at the end of FY15. ISY’s shares have performed similarly well in H216, but did not fall as much in the first half, rising 25% in 2016 as a whole, while the peers fell 12% on average over the year. Despite this, ISY still has a considerably higher prospective dividend yield (provided the payout is maintained) and return on equity and trades at a lower P/E multiple than peers. It is more closely aligned with the group on a price to book value (P/BV) basis.
Exhibit 18: Peer valuation
P/E (x) |
P/BV (x) |
Dividend yield (%) |
Return on equity (%) |
Return on assets (%) |
||||||
2017e |
2018e |
2017e |
2018e |
2017e |
2018e |
2017e |
2018e |
2017e |
2018e |
|
Is Yatirim Menkul Degerler |
7.3 |
6.2 |
0.8 |
0.8 |
9.3 |
9.3 |
11.2 |
12.8 |
1.0 |
1.2 |
Average |
13.1 |
9.8 |
0.7 |
0.7 |
3.4 |
3.8 |
5.6 |
7.0 |
0.3 |
0.4 |
BNP Paribas |
9.4 |
8.6 |
0.7 |
0.7 |
5.0 |
5.4 |
8.2 |
8.4 |
0.4 |
0.4 |
UBS |
12.7 |
11.0 |
1.1 |
1.0 |
4.1 |
4.8 |
8.0 |
9.4 |
0.4 |
0.5 |
Credit Suisse Group |
16.5 |
10.7 |
0.7 |
0.7 |
4.5 |
4.6 |
4.4 |
7.0 |
0.2 |
0.4 |
Société Générale |
9.5 |
8.7 |
0.6 |
0.6 |
5.2 |
5.7 |
6.7 |
7.0 |
0.3 |
0.3 |
Barclays |
17.1 |
11.4 |
0.7 |
0.7 |
1.3 |
1.3 |
3.9 |
5.7 |
0.3 |
0.4 |
Deutsche Bank |
13.3 |
8.6 |
0.4 |
0.4 |
0.3 |
1.3 |
2.1 |
4.3 |
0.2 |
0.4 |
Source: Bloomberg, Edison Investment Research. Note: Prices at close of business on 20 February 2017.
We also use an ROE/COE approach to value ISY: a long-term growth rate of 4% and the group average estimated ROE for the peers of 7% gives a derived cost of equity for them of 8.2%. The same calculation using our estimated FY18 ROE of 12.5% and a 5% growth rate for ISY implies a cost of equity of 16.9%. This is above the Bloomberg-calculated figure of 14.2% and both, for the moment, are above the return on equity. However, this level of return on equity appears strong given the challenging trading environment. A more favourable geopolitical background could be positive for both the return on equity and the required return.
We note that the ROE/COE valuation is sensitive to the ROE input used: a change of 50bp to the ROE makes a c 500bp difference to the implied multiple of book value.
Exhibit 19: Financial summary
TRYm |
2014 |
2015 |
2016 |
2017e |
2018e |
||
Year end 31 December |
IFRS |
IFRS |
IFRS |
IFRS |
IFRS |
||
PROFIT & LOSS |
|||||||
Revenue |
|
|
372.4 |
377.5 |
438.9 |
448.0 |
486.8 |
Operating expenses |
(266.5) |
(314.5) |
(355.8) |
(346.2) |
(370.3) |
||
Other income/expense (net) |
(2.1) |
(8.5) |
(24.5) |
(6.0) |
(6.0) |
||
Operating profit |
|
|
103.8 |
54.6 |
58.6 |
95.8 |
110.5 |
Share of profit of equity accounted investees |
(.3) |
(.7) |
(4.0) |
(4.0) |
(4.0) |
||
Net financials |
(3.0) |
(20.1) |
(13.0) |
12.9 |
16.3 |
||
Exceptionals |
0.0 |
0.0 |
0.0 |
0.0 |
0.0 |
||
Profit Before Tax (norm) |
|
|
100.5 |
33.7 |
41.6 |
104.7 |
122.9 |
Profit Before Tax (FRS) |
|
|
100.5 |
33.7 |
41.6 |
104.7 |
122.9 |
Tax |
(7.9) |
(11.3) |
(20.8) |
(23.5) |
(26.7) |
||
Profit After Tax (norm) |
|
|
92.6 |
22.4 |
20.8 |
81.2 |
96.2 |
Profit After Tax (FRS) |
|
|
92.6 |
22.4 |
20.8 |
81.2 |
96.2 |
Minority interest |
29.7 |
(18.1) |
(33.1) |
14.7 |
18.1 |
||
Net income (norm) |
|
|
62.9 |
40.5 |
53.9 |
66.5 |
78.1 |
Net income (FRS) |
|
|
62.9 |
40.5 |
53.9 |
66.5 |
78.1 |
Average Number of Shares Outstanding (m) |
355.0 |
355.0 |
355 |
355 |
355 |
||
EPS - normalised fully diluted (Kr) |
|
|
17.7 |
11.4 |
15.2 |
18.7 |
22.0 |
EPS - IFRS (Kr) |
|
|
17.7 |
11.4 |
15.2 |
18.7 |
22.0 |
Dividend per share (Kr) |
13.24 |
10.00 |
12.68 |
12.68 |
12.68 |
||
BALANCE SHEET |
|||||||
Fixed Assets |
|
|
168.8 |
194.8 |
190.3 |
195.0 |
195.0 |
Intangible Assets |
61.2 |
61.4 |
57.1 |
57.1 |
57.1 |
||
Tangible Assets |
34.8 |
32.8 |
34.2 |
34.2 |
34.2 |
||
Other |
72.7 |
100.6 |
99.0 |
103.7 |
103.7 |
||
Current Assets |
|
|
5,186.4 |
5,586.4 |
6,327.6 |
6,187.3 |
6,195.4 |
Investments |
708.6 |
768.4 |
400.9 |
400.9 |
400.9 |
||
Trade receivables |
1,380.8 |
1,815.0 |
1,737.5 |
1,737.5 |
1,737.5 |
||
Cash and equivalents |
2,907.0 |
2,733.8 |
3,939.3 |
3,939.3 |
3,939.3 |
||
Other |
189.9 |
269.2 |
249.8 |
109.5 |
117.6 |
||
Total Assets |
|
|
5,355.1 |
5,781.2 |
6,517.9 |
6,382.3 |
6,390.4 |
Current Liabilities |
|
|
(4,295.0) |
(4,697.5) |
(5,427.8) |
(5,246.9) |
(5,221.8) |
Short term borrowings |
(3,140.1) |
(3,177.6) |
(3,821.6) |
(3,821.6) |
(3,821.6) |
||
Trade payables |
(981.2) |
(1,337.3) |
(1,421.4) |
(1,421.4) |
(1,421.4) |
||
Other |
(173.7) |
(182.7) |
(184.8) |
(3.9) |
21.1 |
||
Long Term Liabilities |
|
|
(102.2) |
(175.5) |
(209.8) |
(210.0) |
(210.0) |
Long term borrowings |
(90.1) |
(140.6) |
(171.0) |
(171.0) |
(171.0) |
||
Other long term liabilities |
(12.1) |
(34.9) |
(38.8) |
(39.0) |
(39.0) |
||
Total Liabilities |
|
|
(4,397.2) |
(4,873.0) |
(5,637.6) |
(5,456.9) |
(5,431.8) |
Equity attributable to ordinary shareholders |
|
|
557.3 |
558.2 |
563.4 |
593.8 |
608.8 |
Minority interest |
|
|
400.6 |
350.0 |
316.9 |
331.6 |
349.7 |
Total shareholders’ equity |
|
|
958.0 |
908.2 |
880.3 |
925.4 |
958.6 |
Number of shares at year end (m) |
|
|
355 |
355 |
355 |
355 |
355 |
NAV per share (TRY) |
|
|
1.57 |
1.57 |
1.59 |
1.67 |
1.72 |
Source: Is Yatirim Menkul Degerler data, Edison Investment Research
|
||||||||||||||||||||||||||||||||||
|
|