Last close As at 06/08/2026
GBP16.80
▲ 20.00 (1.20%)
Market capitalisation
GBP316m
Research: Investment Companies
The Biotech Growth Trust (BIOG) is managed by Geoff Hsu and Richard Klemm at OrbiMed Capital, one of the leading global healthcare asset managers. The year 2018 proved to be tough for the trust’s performance as biotech companies delivering negative news were heavily penalised, while those delivering good news went unrewarded. However, the managers are optimistic about BIOG’s prospects. They cite a rich industry innovation pipeline that includes a series of technologies with multi-billion-dollar revenue potential; a favourable regulatory environment; and a higher level of deal activity, including major pharma company Bristol-Myers Squibb’s recent bid for Celgene (one of BIOG’s largest holdings) at a significant premium to its pre-bid share price.
The Biotech Growth Trust |
Industry backdrop remains favourable |
Investment trusts |
15 February 2019 |
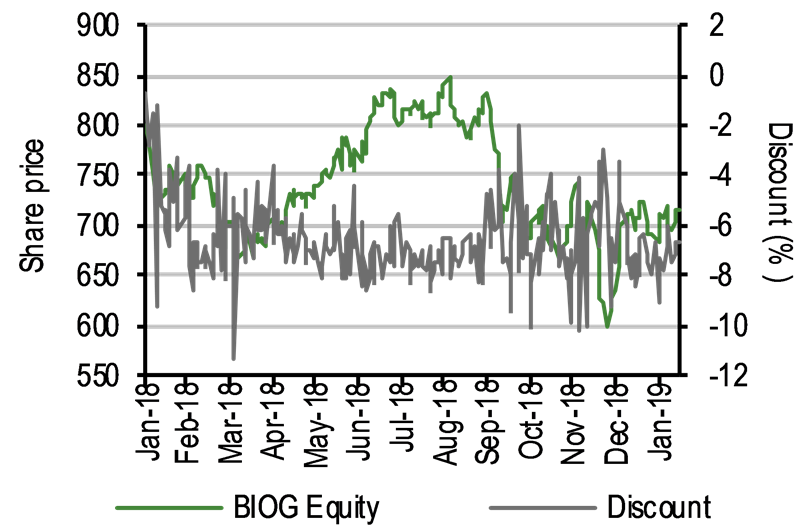
Share price/discount performance
Three-year performance vs index
Gearing
Analysts
|
|||||||||||||||||||||||||||||||||||||||||||||||||||||||||||||||||||||||||||||||||||||||||||||
The Biotech Growth Trust (BIOG) is managed by Geoff Hsu and Richard Klemm at OrbiMed Capital, one of the leading global healthcare asset managers. The year 2018 proved to be tough for the trust’s performance as biotech companies delivering negative news were heavily penalised, while those delivering good news went unrewarded. However, the managers are optimistic about BIOG’s prospects. They cite a rich industry innovation pipeline that includes a series of technologies with multi-billion-dollar revenue potential; a favourable regulatory environment; and a higher level of deal activity, including major pharma company Bristol-Myers Squibb’s recent bid for Celgene (one of BIOG’s largest holdings) at a significant premium to its pre-bid share price.
12 months ending |
Share price |
NAV |
NASDAQ Biotech (%) |
World-DS Pharm & Bio (%) |
FTSE World |
31/01/15 |
52.5 |
44.9 |
43.7 |
30.8 |
17.3 |
31/01/16 |
(22.1) |
(13.7) |
(11.7) |
0.5 |
(0.1) |
31/01/17 |
15.5 |
15.3 |
17.8 |
12.3 |
33.6 |
31/01/18 |
15.0 |
6.8 |
9.7 |
9.4 |
12.7 |
31/01/19 |
(12.5) |
(5.7) |
4.5 |
7.5 |
0.9 |
Source: Refinitiv. Note: All % on a total return basis in pounds sterling.
Investment strategy: Rigorous bottom-up analysis
The managers are able to draw on the broad resources of OrbiMed to construct a diversified portfolio of biotech stocks, aiming to generate long-term capital growth. Potential investee companies undergo thorough fundamental research, which includes an assessment of their product pipelines. The portfolio typically has around 50 stocks and is diversified across the market cap spectrum; holdings can be classified in one of three ‘buckets’: large-cap, emerging and early-stage biotech companies. The majority of BIOG’s holdings are in US companies, which dominate the global biotech market, although the fund has exposure to other areas including Europe and China.
Market outlook: Supportive industry backdrop
During 2018, the high-beta nature of biotech stocks led to significant drawdowns during periods of stock market weakness such as in October and December. However, over the long term, the sector has outperformed the global equity market by quite some margin. Industry fundamentals remain robust, with innovative technologies under development and a supportive regulatory environment, and there appears to be an uptick in merger and acquisition (M&A) activity. These factors have historically been supportive for biotech share prices.
Valuation: Broadly in line with historical averages
BIOG is trading at a 6.7% discount to cum-income NAV, close to the middle of the 0.8% to 11.3% range over the last 12 months. Over the last one, three, five and 10 years the trust has traded at average discounts of 6.6%, 6.2%, 5.9% and 5.3% respectively. BIOG does not pay a dividend – it aims to generate capital growth and the majority of portfolio companies are early stage and investing for future growth rather than distributing income.
Exhibit 1: Trust at a glance
Investment objective and fund background |
Recent developments |
||||||||||||||||||||||||||||||||||||||||||||||||||||||||||||||||||||||
The Biotech Growth Trust seeks capital appreciation through investing in the worldwide biotechnology industry. Performance is measured against its benchmark index, the NASDAQ Biotechnology Index (sterling adjusted). |
■ 9 November 2018: interim results for six months ending 30 September 2018. NAV TR +19.9% versus benchmark TR +22.9%. Share price TR +17.9%. ■ 24 May 2018: annual results for 12 months ending 31 March 2018. NAV TR ■ 16 May 2018: appointment of Geoff Hsu as non-independent director following the retirement of Sven Borho. |
||||||||||||||||||||||||||||||||||||||||||||||||||||||||||||||||||||||
Forthcoming |
Capital structure |
Fund details |
|||||||||||||||||||||||||||||||||||||||||||||||||||||||||||||||||||||
AGM |
July 2019 |
Ongoing charges |
1.1% |
Group |
Frostrow Capital LLP |
||||||||||||||||||||||||||||||||||||||||||||||||||||||||||||||||||
Annual results |
May 2019 |
Net gearing |
7.8% |
Manager |
OrbiMed Capital |
||||||||||||||||||||||||||||||||||||||||||||||||||||||||||||||||||
Year end |
31 March |
Annual mgmt fee |
See page 7 |
Address |
25 Southampton Buildings, |
||||||||||||||||||||||||||||||||||||||||||||||||||||||||||||||||||
Dividend paid |
N/A |
Performance fee |
See page 7 |
||||||||||||||||||||||||||||||||||||||||||||||||||||||||||||||||||||
Launch date |
June 1997 |
Trust life |
Indefinite (subject to vote) |
Phone |
+44 (0) 20 3008 4910 |
||||||||||||||||||||||||||||||||||||||||||||||||||||||||||||||||||
Continuation vote |
Every five years – next 2020 |
Loan facilities |
See page 7 |
Website |
|||||||||||||||||||||||||||||||||||||||||||||||||||||||||||||||||||
Portfolio sector exposure (adjusted for gearing) |
Share buyback policy and history (financial years) |
||||||||||||||||||||||||||||||||||||||||||||||||||||||||||||||||||||||
Following an adjustment to the investment objective in October 2013, BIOG is no longer required to invest the majority of assets in companies with a market capitalisation below $3bn at the time of acquisition. |
Renewed annually, the trust has authority to purchase up to 14.99% and allot up to 10% of issued share capital. There is a discount control mechanism in place with a target level of no more than a 6% discount to NAV. |
||||||||||||||||||||||||||||||||||||||||||||||||||||||||||||||||||||||
|
|
||||||||||||||||||||||||||||||||||||||||||||||||||||||||||||||||||||||
Shareholder base (as at 31 January 2019) |
Portfolio exposure by geography (as at 31 December 2018) |
||||||||||||||||||||||||||||||||||||||||||||||||||||||||||||||||||||||
|
|
||||||||||||||||||||||||||||||||||||||||||||||||||||||||||||||||||||||
Top 10 holdings (as at 31 December 2018) |
|||||||||||||||||||||||||||||||||||||||||||||||||||||||||||||||||||||||
|
|||||||||||||||||||||||||||||||||||||||||||||||||||||||||||||||||||||||
Source: The Biotech Growth Trust, Edison Investment Research, Bloomberg, Morningstar. Note: *N/A where not in end-December 2017 top 10.
Market outlook: Potential for improved sentiment
The performance of biotech shares and the global stock market are shown in Exhibit 2 (LHS). Over the last decade, biotech stocks have delivered a superior total return, albeit with a higher level of volatility. However, this outperformance is largely as a result of a period of meaningful biotech share price appreciation between early 2013 and mid-2015, and over the last five years the two indices have performed broadly in line. To put valuations into a historical context, the Datastream global biotech index is trading on a 19.5x forward P/E multiple, which is broadly in line with its 10-year average of a c 20% premium to the US market and modestly lower than its 10-year c 30% average premium compared with global pharma stocks. There is potential for improved investor sentiment towards the biotech sector compared with lacklustre interest in 2018, when the sector experienced significant drawdowns in periods of general stock market weakness. The biotech industry innovation pipeline remains robust, with a series of new technologies being developed that have multi-billion-dollar revenue potential; the regulatory environment is benign; and so far in 2019, there appears to be an increased appetite for industry mergers and acquisitions (M&A) – all of which are factors that could provide support for biotech share prices.
|
Exhibit 2: Biotech index performance and valuation |
|
NASDAQ Biotech and FTSE World indices (10 years, £-based) |
World-DS Biotech P/E relative to World-DS Pharma and US-DS (10 years) |
|
|
|
Source: Refinitiv, Edison Investment Research. Note: Using Datastream biotech, pharmaceutical and US indices. |
|
Fund profile: Managed by a global healthcare specialist
BIOG was launched in June 1997 and is listed on the Main Market of the London Stock Exchange. Since May 2005, the trust has been managed by OrbiMed, one of the world’s largest specialist healthcare investment companies (c $14bn of assets under management). OrbiMed has more than 80 investment professionals, many of whom have PhD or medical degrees and/or are former founders or CEOs of healthcare companies, investing in both public and private healthcare companies across the size spectrum. BIOG is managed by Geoff Hsu and Richard Klemm, who are based in New York; they aim to generate long-term capital growth from a diversified global portfolio of around 50 biotech stocks, selecting shares on a bottom-up basis without reference to the benchmark (sterling adjusted NASDAQ Biotechnology index).
Investment guidelines stipulate that at the time of purchase, a maximum 15% of NAV may be invested in a single stock, up to 10% is permitted in unquoted investments, and a maximum $15m may be invested in private equity funds managed by OrbiMed. Gearing of up to 20% is permitted; at end-December 2018, net gearing was 7.8%. Data from BIOG to end-September 2018, show that since OrbiMed took over the management of the trust in May 2005, its NAV total return of 793.5% is 102.4pp ahead of the benchmark’s 691.1% total return. Over the same period, BIOG outperformed the FTSE All-Share index by 624.4pp.
The fund managers: Geoff Hsu and Richard Klemm
The managers’ view: Positive industry fundamentals
Hsu explains that 2018 was a very difficult year in terms of investment performance. BIOG has consistently had an overweight exposure to large-cap biotech technology stocks, which suffered from negative investor sentiment during 2018; meaning that even companies that delivered positive news did not perform well in share price terms. Hsu cites Alexion Pharmaceuticals, which had a series of positive trial data and announced a joint venture with Complement Pharma to co-develop a preclinical inhibitor for neurodegenerative disorders. Alexion also consistently beat consensus earnings numbers; however, its share price did not respond to the good news, declining by 18.7% during the year.
The manager says that biotech industry fundamentals remain very positive. In 2018, there were a record 59 new molecular entities approved by the US Food and Drug Administration (FDA), which beat the previous record of 53 in 1996. There was also a record number of generic approvals last year. However, Hsu says that investors need to be mindful of the increased competition that comes with a higher number of drug approvals, underlining the importance of developing novel therapies. He believes that this issue of higher competition contributed to biotech share prices’ failure to react positively to good news in 2018. The manager remains optimistic on the outlook for industry innovation, which can be a key performance driver for the biotech sector. He argues there are multi-billion dollar opportunities from a variety of technologies such as protein correctors, gene therapy/silencing, CAR-T products, and bispecific antibodies.
Hsu believes that the attractive valuations of some biotech companies will lead to more industry M&A. Early in January 2019, Bristol-Myers Squibb announced the acquisition of Celgene for a significant c 50% premium, after the target company had declined to a record low P/E multiple. The manager says this deal indicates that corporates are seeing value in the biotech sector, and he views the two companies’ businesses as very complementary, with potential for the deal to bring significant synergies. Within emerging biotech, major pharma company Eli Lilly has announced the acquisition of Loxo Oncology; it is paying c $8bn in cash (a c 70% premium) for a portfolio of targeted medicines to treat cancers. Hsu is encouraged by these announced deals, as he viewed the lack of M&A activity in H218 as disappointing; he believes that a buoyant deal environment could lead to higher biotech company valuations.
The manager attended the important J.P. Morgan Healthcare Conference in January this year and reports that, generally, investor sentiment is mildly positive. He notes that December 2018 was a terrible period for equity markets, with high-beta sectors, such as biotech, being hit particularly hard. Hsu believes that M&A so far this year has contributed to better investor sentiment, and a series of initial public offerings (IPOs) in the pipeline, following on from a high level in 2018.
While the manager remains positive on the prospects for the biotech sector, he notes that now Democrats have control of the House of Representatives, discussions on drug pricing may once again become more high profile. While this issue is not currently major headline news, the manager says an increased focus by US politicians on potential price controls would not be helpful for the performance of biotech stocks.
Asset allocation
Investment process: Investing across the size spectrum
Managers Hsu and Klemm aim to generate long-term capital growth from a diversified portfolio of biotech stocks across the market cap spectrum. Reflecting the country’s dominance in the global biotech industry, the majority of the fund is invested in US companies. The managers are able to draw on the broad resources of OrbiMed’s investment team to identify investment ideas. Potential investee companies are subject to thorough fundamental research, including an assessment of the product pipeline, and the identification of likely stock price catalysts. Company meetings are a key element of the research process, to understand the development programmes and commercial prospects for individual drugs. Stocks may be purchased if early-stage companies are approaching profitability, if a company is viewed as a potential takeover candidate, or ahead of anticipated positive clinical data. OrbiMed’s investment team’s clinical background means that it is well-placed to understand a product’s clinical potential. Holdings are reassessed regularly to ensure that the investment case still holds true. BIOG’s portfolio is essentially split into three subsectors: large-cap – companies with robust earnings growth that are trading on reasonable valuations; emerging – companies with products that have been launched recently, or are in late-stage development; and early-stage – companies with novel products that are in an early stage of development, with potential to deliver positive clinical data.
Current portfolio positioning
As shown in Exhibit 1, the portfolio concentration in BIOG’s top 10 holdings is broadly similar year on year (65.4% at end-December 2018 versus 65.6% a year before). In terms of geographic exposure, the largest changes during 2018 were a 3.6pp reduction in North America and a 3.1pp increase in continental Europe.
Exhibit 3: Portfolio geographic exposure (%)
Region/country |
End-December 2018 |
End- December 2017 |
Change (pp) |
North America |
88.5 |
92.1 |
(3.6) |
Continental Europe |
7.8 |
4.7 |
3.1 |
United Kingdom |
0.2 |
0.9 |
(0.7) |
Other |
2.9 |
1.6 |
1.3 |
Unquoted |
0.6 |
0.7 |
(0.1) |
Total |
100.0 |
100.0 |
Source: The Biotech Growth Trust, Edison Investment Research
Hsu highlights BIOG’s largest holding, Biogen, one of the companies that are most advanced in developing a product to treat Alzheimer’s disease. This would address a huge unmet medical need, and the manager believes that a drug that could affect the progression of this condition has the potential to be the largest selling pharmaceutical ever. In the US, there are 5.7m patients with Alzheimer’s (the sixth leading cause of death in the country), which is more than the 5.1m cancer patients. Hsu says that so far, all late-stage trials for Alzheimer’s products have failed. However, he remains optimistic of a breakthrough, as every ‘failed’ trial has shown some degree of efficacy. He notes that the FDA has lowered the bar for approval of novel therapies. Biogen and partner Eisai’s Phase III trial data for aducanumab for early Alzheimer’s disease are due in 2019/20, and the manager believes that positive developments in the treatment of Alzheimer’s could be an important catalyst for the biotech sector, including the potential for revaluation.
Vertex Pharmaceuticals is BIOG’s second-largest position. The company had positive data in Q418 for its product to treat cystic fibrosis, and the manager is expecting another readout early in 2019. Hsu says that Vertex has a solid growth profile and is a much “cleaner” story than many other companies in the biotech sector, although this does mean the company has a higher valuation. Other top 10 positions include Sarepta Therapeutics, which is using gene therapy in the development of products to treat Duchenne muscular dystrophy; Regeneron Pharmaceuticals, a company with an emerging pipeline that the manager believes is underappreciated; and Argenx, which is developing a FcRn-antagonist for the treatment of myasthenia gravis that could have multiple uses for many diseases (known as a ‘pipeline in a product’). The manager also highlights Argenx’s efgartigimod product, which is a first-in-class antibody with a novel mechanism of action, for the treatment of patients with severe autoimmune diseases.
Performance: Difficult period in 2018
Last year was a tough period for BIOG’s investment performance; its NAV and share price total returns of -14.3% and -19.9% respectively lagged the benchmark’s -3.2% total return. As discussed in The managers’ view section, the trust’s large-cap companies did not respond positively to good news; in addition, firms that released negative headlines saw their share prices severely punished. In December 2018, emerging biotech stocks performed particularly poorly during a period of general stock market weakness, and BIOG’s holding in DBV Technologies fell by c 70% following an announcement that the company was withdrawing its marketing application for a peanut allergy therapy following discussions with the FDA. Regulatory concerns centred around the lack of details on manufacturing procedures and quality controls. As shown in the exhibits below, BIOG’s performance has got off to a better start in 2019, which was helped by the announced acquisition of top 10 holding Celgene by Bristol-Myers Squibb at a more than 50% premium to its pre-bid price.
|
Exhibit 4: Investment trust performance to 31 January 2019 |
|||||||||
Price, NAV and benchmark total return performance, one-year rebased |
Price, NAV and benchmark total return performance (%) |
||||||||
|
|
||||||||
|
Source: Refinitiv, Edison Investment Research. Note: Three, five and 10-year performance figures annualised. |
|||||||||
|
Exhibit 5: Share price and NAV total return performance, relative to indices (%) |
|||||||||
|
One month |
Three months |
Six months |
One year |
Three years |
Five years |
10 years |
||
Price relative to NASDAQ Biotechnology |
0.7 |
(0.7) |
(7.5) |
(16.2) |
(13.9) |
(19.3) |
2.1 |
||
NAV relative to NASDAQ Biotechnology |
1.2 |
0.2 |
(6.8) |
(9.7) |
(14.0) |
(15.1) |
(0.4) |
||
Price relative to World-DS Pharm & Bio |
9.7 |
2.8 |
(11.4) |
(18.6) |
(12.1) |
(20.5) |
54.4 |
||
NAV relative to World-DS Pharm & Bio |
10.3 |
3.7 |
(10.8) |
(12.3) |
(12.1) |
(16.4) |
50.5 |
||
Price relative to FTSE World |
5.9 |
3.4 |
(8.4) |
(13.3) |
(23.5) |
(22.5) |
60.8 |
||
NAV relative to FTSE World |
6.5 |
4.3 |
(7.8) |
(6.5) |
(23.6) |
(18.5) |
56.7 |
||
Price relative to FTSE All-Share |
6.1 |
3.2 |
(4.9) |
(9.0) |
(9.6) |
5.2 |
107.4 |
||
NAV relative to FTSE All-Share |
6.7 |
4.1 |
(4.2) |
(1.9) |
(9.6) |
10.7 |
102.1 |
||
|
Source: Refinitiv, Edison Investment Research. Note: Data to end-January 2018. Geometric calculation. |
|||||||||
|
Exhibit 6: NAV total return performance relative to benchmark over 10 years |
|||||||||
|
|||||||||
|
Source: Refinitiv, Edison Investment Research |
|||||||||
BIOG’s relative returns are shown in Exhibit 5. Weakness in 2018 has affected the trust’s long-term record, and it has now performed broadly in line with the benchmark over the last 10 years, albeit with a c 18% pa return in absolute terms. BIOG’s long-term relative performance versus global healthcare stocks, world and UK equities is much more impressive. The trust has outperformed the FTSE All-Share index over 10 years by a considerable margin, while also performing by a more modest amount over five years.
Discount: Modestly wider than historical averages
Exhibit 7 shows BIOG’s share price premium/discount to cum-income NAV over the past three years. The trust has generally traded at a discount, but over the period there have been a few instances where it traded at a modest premium. BIOG’s current 6.7% discount is in the middle of the range of discounts over the last 12 months of 0.8% to 11.3%, and compares with the narrow range of average discounts of 5.3% to 6.6% over the last one, three, five and 10 years.
|
Exhibit 7: Share price premium/discount to NAV (including income) over three years (%) |
|
|
Source: Refinitiv, Edison Investment Research |
Capital structure and fees
BIOG is a conventional investment trust with one class of share; there are currently 53.0m ordinary shares in issue. The trust has an overdraft facility with J.P. Morgan Securities priced at the US Federal Funds Open rate + 0.45%. At end-December 2018, net gearing was 7.8%.
OrbiMed is paid an annual management fee of 0.65% of BIOG’s NAV, while Frostrow Capital (the trust’s Alternative Investment Fund Manager) receives an annual fee equal to 0.30% per year of the company’s market cap, plus a fixed amount of £60k per year. There is a 16.5% performance fee in place for outperformance versus the benchmark, split 15.0% and 1.5% between OrbiMed and Frostrow respectively. No performance fee was paid in FY18. During this period BIOG’s ongoing charge was 1.1%, which was in line with the prior financial year.
Dividend policy and record
BIOG’s remit is to generate capital growth rather than income. In addition, the early-stage nature of most of its portfolio companies means they invest for future growth rather than paying dividends. As a result, BIOG’s last dividend payment was 0.2p per share in 2001. The 1.1p per share revenue income in FY18 was c 30% lower than 1.6p generated in FY17; the lower level of income was partially due to sterling appreciation over the period. During FY18, BIOG’s revenue deficit reduced from £1.9m to £1.3m.
Peer group comparison
BIOG is a member of the AIC Sector Specialist: Biotech & Healthcare sector. To enable a broader comparison, in Exhibit 8 we also include two Switzerland-listed companies, BB Biotech and HBM Healthcare Investments. BIOG’s NAV total returns rank first out of five funds over 10 years, but are below average over the other periods shown. The trust is one of three funds trading at a discount to NAV. Its ongoing charge and level of gearing is broadly average. As discussed in the prior section, BIOG generally does not pay a dividend.
Exhibit 8: Biotech and healthcare investment companies, as at 12 February 2019*
% unless stated |
Market cap £m |
NAV TR |
NAV TR |
NAV TR |
NAV TR |
Discount (ex-par) |
Ongoing charge |
Perf. |
Net gearing |
Dividend yield |
Biotech Growth Trust |
377.1 |
(1.3) |
28.6 |
41.9 |
410.7 |
(6.9) |
1.1 |
Yes |
108 |
0.0 |
BB Biotech |
2,922.1 |
(0.8) |
45.0 |
77.5 |
403.1 |
9.3 |
1.3 |
No |
103 |
4.4 |
BB Healthcare |
514.8 |
34.5 |
|
|
|
1.4 |
1.3 |
No |
113 |
2.6 |
HBM Healthcare Investments |
992.1 |
10.4 |
40.2 |
120.3 |
260.0 |
(6.6) |
1.2 |
Yes |
100 |
3.3 |
International Biotechnology |
237.1 |
8.4 |
49.8 |
83.6 |
334.5 |
1.7 |
1.1 |
Yes |
100 |
4.4 |
Polar Capital Global Healthcare |
262.1 |
15.9 |
43.1 |
59.4 |
|
(6.0) |
1.2 |
Yes |
123 |
0.9 |
Syncona |
1,765.5 |
44.4 |
90.0 |
94.7 |
|
28.3 |
1.0 |
No |
100 |
0.9 |
Worldwide Healthcare Trust |
1,386.7 |
11.0 |
58.2 |
99.5 |
361.5 |
0.7 |
0.9 |
Yes |
109 |
0.7 |
Average |
1,057.2 |
15.3 |
50.7 |
82.4 |
354.0 |
2.7 |
1.1 |
107 |
2.1 |
|
Trust rank in sector (eight trusts) |
6 |
8 |
7 |
7 |
1 |
8 |
6 |
4 |
8 |
Source: Morningstar, Edison Investment Research. Note: *Performance to 11 February 2019 based on ex-par NAV. TR = total return. Net gearing is total assets less cash and equivalents as a percentage of net assets.
The board
BIOG has six directors on its board, five of whom are considered independent: Andrew Joy (appointed March 2012, chairman since July 2016); Professor Dame Kay Davies (appointed March 2012); Steven Bates (appointed July 2015); the Rt Hon Lord Willetts (appointed November 2015); and Julia Le Blan (appointed July 2016). The non-independent director is one of BIOG’s managers, Geoff Hsu; he joined the board in May 2018, following the retirement of another OrbiMed partner, Sven Borho, who was appointed as a director of BIOG’s stablemate Worldwide Healthcare Trust.
|
|
Research: Investment Companies
Deutsche Beteiligungs (DBAG) is making steady progress on its investment agenda, with three new acquisitions and several follow-on funding rounds totalling €40.2m completed in Q119. DBAG’s Fund VII has so far been able to allocate 56% of its investment commitments in seven transactions, reflecting solid portfolio ramp-up. Meanwhile, weaker market sentiment has burdened DBAG’s portfolio valuation by c €47.8m (or c 14%) vs Q418. Around 17% of the company’s current portfolio represents holdings acquired within the last 12 months and still valued at cost.