IG Design Group |
Grand designs |
Full year results |
Care & household goods |
1 July 2016 |
Share price performance
Business description
Next events
Analysts
IG Design Group is a research client of Edison Investment Research Limited |
|||||||||||||||||||||||||||||||||||||||||||||||||
IG Design (formerly International Greetings) has delivered a strong set of results, with constant currency revenue growth of 4.4%. There are gains at both gross and operating margin level, while net debt has reduced by more than expected. The new branding emphasises that IGR is more than an efficient, commodity business and that its skillsets can be leveraged across adjacent categories. The US opportunity is by far the largest and the new local management team is making a strong start. The share price has started to grasp the changing proposition, but has yet to fully reflect it.
Year end |
Revenue (£m) |
PBT* |
EPS* |
DPS |
P/E |
Yield |
03/15 |
229.0 |
9.6 |
11.8 |
1.00 |
13.6 |
0.6 |
03/16 |
237.0 |
10.1 |
13.6 |
2.50 |
11.8 |
1.6 |
03/17e |
250.0 |
12.2 |
14.4 |
3.25 |
11.2 |
2.0 |
03/18e |
260.0 |
14.1 |
15.4 |
4.00 |
10.5 |
2.5 |
Note: *PBT and EPS are normalised, excluding amortisation of acquired intangibles, exceptional items and share-based payments.
US on a roll
Each of the group’s operating regions posted revenue growth in local currency for FY16 as unit volumes grew to record levels. The benefits from investment in manufacturing and product and design innovation are now flowing through, with a 0.8% uplift in gross margin to 18.3% in the year. The Australian business (12% group revenues) is recovering well, but the standout performance was in the US (28% FY16 revenues), where the new CEO has been in situ for just over a year and has put together an energetic team. US sales in local currency were ahead by 7% (13% in sterling), with a 34% uplift in operating profit. Capacity has been increased with additional conversion facilities and new retail channels have been cultivated, notably the drugstore sector and exports to other American countries. Market share in the US market is around 10%, giving plenty of expansionary scope.
Global funding arrangements in place
Post year-end, the group announced the successful renegotiation of its banking arrangements, consolidating the facilities to HSBC from a wider consortium, on improved terms. With the ongoing substantial reduction in net debt, IG Design (IGR) can make further investment in leveraging its core expertise in design, sourcing and efficient manufacture to supply its customers with a broader range of product, within the Celebrations, Stationery & Creative Play and Giftware categories.
Valuation: Starting to reflect opportunity
The share price has risen 29% in 12 months (up from 31.5p in June 2013) as the market has recognised the transformation from an indebted manufacturer in deflation-prone commodity markets into a confident, global, design-led, efficient partnership supplier to retail channels. Post the latest gains, the valuation is level with US-based home/lifestyle brands (the nearest peers). The strong cash flow and management views on capital allocation indicate a progressive dividend stream.
Investment summary
Company description: Design-led manufacturer and supplier
IG Design Group (formerly International Greetings) designs, manufactures and sources product globally in the celebrations, stationery and creative play and gifting product categories. The UK is the group’s core manufacturing base, but it has other manufacturing facilities in China, the US and the Netherlands, with the UK, US, Australia and other European countries being important trading areas. Having inherited a legacy of a balance sheet overburdened by an earlier buy-and-build strategy, management has considerably reduced levels of group debt, despite a major investment programme in upgrading manufacturing facilities. Markets are and will remain highly competitive, so optimising manufacturing efficiency while providing exemplary customer service are prerequisites. IG Design is the third largest global supplier of gift packaging (after American Greetings and Hallmark). Around one-third of product is sold under the group’s own proprietary generic brands (including Tom Smith in crackers and Kids Create in creative play) or brands that it has licensed from Disney, Universal and others (c 12% of group revenues). It supplies products at all pricing levels and has a particularly strong position in the value sector in Europe and the US.
Valuation: Discount closed
The days of the deep discount have passed and the business is now recognised as having finished the repair and recovery phase and moved into one where it is addressing its global market opportunities. Having moved ahead strongly, the share price may now pause, but is 75% backed with assets and trading on a valuation par with other home and lifestyle brands on both EV/EBITDA and P/E. The dividend, having been restored in FY15, was increased well ahead of earnings as it moves towards a target cover of 3.0x. The implied progression is obviously well ahead of the market.
Financials: Forecasts raised, debt forecast lowered
■
The results were in line with the year-end trading update, which had pointed to an outperformance against previous expectations.
■
FY17 PBT forecast raised by 10% and EPS +13%. New FY18e numbers show 7% further progress on EPS, on relatively modest top-line assumptions.
■
Debt paydown ahead of model. With capex forecast at £6m for FY17 and FY18 and a substantial uplift in the dividend, we still see the strong cash flow allowing for net debt reducing to £15m by the end of the current year and £11m at end FY18e, despite a rising tax charge.
■
M&A activity is more likely, but only where synergies are obvious and provide the group with adjacent categories or incremental channels.
Sensitivities: Currency, competition, seasonality
The US dollar and the euro are important group currencies, with raw material costs predominantly in local currency, US dollars and in renminbi for goods sourced in China, with the consequent benefit on translation likely in the face of weaker sterling post the Brexit vote. Underlying consumer demand is a constant issue and customers are relentless in their pursuit of value, and deflation will remain an issue at the commodity end of the scale. There is little growth in underlying markets, but longstanding trading relationships help visibility. Small acquisitions can extend the customer reach and the scope of the product offering. Raw material, freight and energy costs are key inputs. In such competitive markets, optimising manufacturing efficiency and procurement is essential, and the best way to protect market share is by ensuring exemplary customer service and innovative design. While growth is targeted at everyday product, Christmas product is of key importance.
Celebrations, Stationery & Creative Play and Gifting
From its origins as a manufacturer of gift wrap, through being a manufacturer of gift packaging product, the newly renamed IG Design Group (retaining the ticker IGR) now has a broader focus within the categories of:
■
celebrations – primarily gift packaging and greetings products;
■
stationery and creative play; and
■
design-led giftware.
The new branding moves the story on to the next stage and draws attention towards the core design competence of the group, which can be leveraged across a broader range of product categories. The exposure to seasonal product (eg for Christmas, or Valentine’s Day), which was a distinct characteristic of the group, has been managed by a focus on growing the ‘everyday’ categories, which accounted for 48% of FY16 revenues.
The business is genuinely global, with manufacturing operations in China, the Netherlands, the UK and the US. Revenues and operating profits by geography are shown below, but this masks the true spread of the business as the UK/Asia segment includes the sourcing activities for goods sold into different territories, with UK turnover by destination nearer to one-third of the total and with the proportion of sales to customers in the US running a very close second following strong growth in FY16.
|
Exhibit 1: FY16 revenues by geography |
Exhibit 2: FY16 operating profit by geography |
|
|
|
Source: Company accounts |
|
Exhibit 1: FY16 revenues by geography |
|
|
Source: Company accounts |
|
Exhibit 2: FY16 operating profit by geography |
|
|
Source: Company accounts |
Now known by the name The Design Group, it supplies a huge number and range of products – around half a billion units per year, including over 80m crackers, 750m stickers and c 850m metres of giftwrap in the year just reported. This implies an average unit wholesale price of 45-50p, and retailing at a (rough) average of around £1. These products are supplied into an exceptionally broad range of retail customers, from the mass-market brands in the US such as Costco, Target and Walmart, through the major traditional multiple grocers and the discounters in the UK, the discount/dollar stores, regional retailers and drugstores, as well as niche and upscale retailer groups and online retailers. The group’s products are sold in more than 80 countries, with long-term (not necessarily contractual) relationships with over 5,400 customers (with over 150,000 outlets between them). Some of these trading relationships have lasted over 20 years and the group was recently one of only three global suppliers to be awarded ‘No one tries harder for customers’ status by Tesco. The largest customer represents 8% of sales.
Licensed product across the group makes up around 12% of group revenues, but concentrated down on a relatively narrow and focused portfolio. This principally consists of a mix of perennial properties, such as Peppa Pig and classic Disney characters, with some ‘hotter’ additional licences such as Frozen, Minion, Marvel Avengers, Star Wars and, most recently Emojis which, despite being newer, have potential ‘staying power’. The retail segment has become increasingly risk averse in its stock decisions, but many of the Disney or Universal properties have the momentum to drive sales even in dull markets. The licensed portfolio is less prominent in the US business.
The group manufactures around 44% of the product, which it sells by value and has a broad supplier base, with a heavy bias to China and the Far East. It employed an average of just under 2,000 people in FY16, 79% of whom worked in production and distribution, principally in China, the UK (the two largest manufacturing geographies), the Netherlands and the US. Common IT infrastructure is facilitating the use of the main design studios across the group’s global manufacturing and sourcing, as well as providing the more obvious benefits in sales and CRM.
The newly redefined areas of focus given above are not the reporting categories, nor will they be for now, with the full breakdown of figures being in their geographical format. However, the Design Group has given a breakdown of revenues. The UK is the largest element of Celebrations revenues at 45%, with the US at 29%, and Australia and Europe each accounting for 13%. Stationery & Creative Play has a greater bias to the UK at 57%, with the US again at 29%, but less exposure to European markets at 3% and Australia at 11%. Europe is currently the largest element of the Gifting category at 58% of revenues, followed by the UK at 38%.
Exhibit 3: Revenue by activity
£m |
FY16 |
FY15 |
Change (%) |
Celebrations |
184.4 |
176.4 |
4.5% |
Stationery & Creative Play |
38.3 |
37.2 |
3.0% |
Gifting |
14.3 |
15.4 |
-7.1% |
237.0 |
229.0 |
3.5% |
Source: Company accounts
Disciplines installed and balance sheet repaired
IGR originated as a giftwrap printing company established in Wales in the late 1970s by Anders Hedlund (whose family interests still account for 40% of the group’s equity, 38% on a diluted basis). By the 1990s, the group had expanded to include other seasonally related products, selling predominantly to UK wholesalers. It floated on AIM in 1996, at which point sales were around 90% UK, 90% in buyers’ own-brand and 90% oriented to the Christmas season, with a buy-and-build strategy. A number of acquisitions followed, but the internal disciplines and structures necessary to support the larger group were lacking and weaknesses were exposed when markets softened in 2007. The balance sheet was significantly stretched, with gearing at 168% at end FY09. A new FD specialising in restructuring and control implementation was appointed and in January 2009 Paul Fineman was appointed group CEO, having joined the group in 2007 with the acquisition of Anker (a UK-based supplier of stationery and children’s activity kits). Paul initially focused on instilling commercial disciplines, having had many years of experience in the industry, joining his family firm, Anker, after college. Anthony Lawrinson took over as CFO in October 2011, joining from Reliance Security Group, with prior experience in a range of sectors including O2 and Hickson International.
Tight financial management has seen the gearing situation first brought under control then actively managed down and at a notably faster pace than we had anticipated. The result is that the group has strong support from its bankers, with facilities recently renegotiated with HSBC on improved terms. More importantly, the strict discipline on cash management has given the executive team the comparative freedom to be able to make operational decisions (in particular the significant capital investment programme across its key manufacturing facilities) in the interests of building the group’s future rather than simply focusing on paying back the debt. In FY09, the group had gearing of 168%. EBITA was roughly the same level as the interest bill, EBITDA at 2.3x interest and the market was understandably sceptical that the group could pull through in a dull underlying market. Seven years on and net gearing is 25%, with EBITDA 6.0x the interest bill in FY16. The group also has state-of-the-art manufacturing at its key sites, with compliance with onerous customer requirements on environmental factors, which gives a strong competitive advantage.
Designing the growth opportunities
The adoption of the core theme of design-led expertise brings an element of coherence to the group that it has lacked, and has been a legacy of the earlier acquisitional strategy. It has better resonance across the group’s markets than the International Greetings name, which promoted the misconception that the group was a manufacturer of greetings cards. Each region is now using the ‘design group’ identity, with the ‘ig’ picked out in different colourways. The corporate and product brands will be retained below, where those identities have their own value, such as the Tom Smith brand in the cracker market.
The overarching strategy is to grow the group both organically and through inorganic initiatives. Taking the latter first, these could be M&A-based opportunities, addressing adjacent markets or product categories, adding recognised brands, leveraging the group’s scale or acting as a market consolidator. A key consideration is the available synergies on any combined business, which rules out any potential acquisition that would not fit into the three newly identified areas of celebrations, stationery and creative play and giftware. Taking ownership is not a prerequisite and management is open to opportunities in partnerships and joint ventures that open up new and incremental channels and categories within the same product groupings. Given the size of the group, targets and opportunities are not likely to be start-ups, but will have established some market presence.
The strategic themes fall into the following categories, as defined by management:
■
Achieve market-leading positioning in gift packaging. The ‘heavy lifting’ on manufacturing efficiency and ensuring customers’ sustainability and environmental requirements are met has now been done. The creative prowess is a central tenet of the business, with the aim of being the supplier with which the retailers want to deal. At the moment, management estimates its market share to be of the order of 45% in UK/Asia and in Australia and around 30% in Europe. The more substantial opportunity is in the US, where market share is more like 10%. Progress here was stalled by the tragic sudden death of the US CEO in 2014. A new CEO, Gideon Schlessinger, was appointed in April 2015, bringing extensive retail experience across a variety of categories. His strong profile with the regional supermarkets and 60,000 outlet drugstores is extending the group’s channel reach, and his detailed knowledge of other American markets is opening new opportunities there.
Gift packaging is also not limited to wrapping presents. The Design Group is also pursuing opportunities in the ‘retail collateral’ market – in this context the provision of high-quality bags for upmarket retail brands and stores, particularly in the fashion and beauty segments. Management estimates the value of this highly fragmented market at around £300m in the UK. Partyware is an adjacent product category, often with the same buyers as the existing range, with obvious synergies with existing competencies and resources.
■
Focus on stationery and creative play. This area gives the group the opportunity to leverage its design capabilities and its licensed portfolio. The group has the Kids Create brand and can use this and other generic brands to develop the market opportunity worldwide. The US is the obvious market for this product category to be developed and first moves have been made to introduce the Kids Create brand here.
■
Nurturing valuable relationships. While the curation of customer relationships is obvious, there is also a need to work closely with suppliers to ensure product quality, compliance and the timeliness of deliveries. The group rebranding should remove a level of complexity in some of these supplier relationships. As mentioned above, many of the group’s customers have been so for decades and the group can show good growth by adding product and adding value to those same customers.
■
Leveraging group expertise. Investment in systems has facilitated communication across the group, as well as providing the practical capabilities, such as the transfer of digital imagery and specifications to the different group locations. This enables coherent and consistent ranges to be co-ordinated. The experience of upgrading the manufacturing in the Netherlands was harnessed to help with the planning and implementation of the capital investment programme in Wales.
■
Balancing the business. This is about reducing risk and optimising returns and is an ongoing process. The group has product across the value, mid-market and premium segments, giving it greater resilience to economic fluctuations and the option to manage margin through mix. The internationalisation of the business similarly reduces the vulnerability to localised variations in demand, while the mix between customer own-brand, owned generic brands and licensed product can be managed to a degree to optimise margin. The shift from Christmas and seasonal product towards ‘everyday’ product has already been mentioned.
■
Investing in people. Providing training and career development opportunities is easier in a larger group, while giving the employees the most appropriate tools to do their jobs and the communications tools to spread best practice can be leveraged across a larger base.
Sensitivities
Currency: the group’s larger currency risk is on purchases, with the main exposure being to the US dollar and the Chinese renminbi. On sales, key currencies are sterling, the US dollar and the euro, and IGR hedges against expected future sales for which there are firm commitments.
The group’s financial performance is subject to a number of sensitivities, most particularly underlying consumer demand, itself a factor of economic confidence. This will obviously vary across the economies in which the group operates and we assume little fundamental growth in markets. Given that people are unlikely to stop wanting to give each other presents or have parties, having attractive designs, products that are widely available and sensibly priced is crucial to maximising market share. High service standards need to be (at least) maintained to protect share in a competitive marketplace, while innovation and design skills help to retain retailer interest and also help recoup margin lost through a deflationary trading environment.
The group has a very broad spread of customers, so concentration of revenue is not a particular issue. The largest customer on a group-wide basis accounts for just over 8% of group sales. Small acquisitions can broaden the customer reach. Online competition has had limited impact on the market to date, taking an estimated 3-4% share in developed markets, with online retailers being customers in their own right for gift-wrapped shipments. As described elsewhere, the market is heavily populated and highly competitive. Expansion into the retail collateral market gives another income stream and can be extended or used to maximise manufacturing efficiency.
Licence management: IGR has longstanding formal relationships with key brand owners including Disney, historically an important entry ticket to obtaining other key licences. Licences for Universal Studios and Star Wars (now Disney-owned), added last year to the stable of perennial properties, have performed very strongly. Licences likely to perform well in the current year are less led by fashion/film tie-in. Rates vary by player and generally have minimum guarantees attached. The US business is more driven by generic brands.
Seasonality: while there are other smaller peaks during the year, Christmas is the group’s key selling period and a poor Christmas would have a notable impact on the financial outturn. Working capital climbs from July, peaking in November, before falling sharply in December and January as seasonal debtors settle their accounts. The group’s intention is to continue to work at increasing the proportion of everyday product to partially offset the effect. The benefit of having substantial Christmas business is the visibility it affords, allowing for efficient scheduling of work through the factories.
As for all manufacturers, raw material and energy costs are a perennial concern, with paper the largest element of cost, followed by labour. Continuous improvements to the efficiency of manufacturing will help to offset inflationary input costs. Moving to more modern machinery also lowers the environmental impact, particularly the transition away from solvents to water-based inks.
The group’s pension schemes are all defined contribution and there are no especial issues here.
Valuation
There is no one obvious valuation methodology. Therefore, we continue to look at it from three perspectives: peer comparison, a DCF basis and underlying asset value. None of these methods provides a definitive valuation, but in combination they give a context for the pricing of the stock.
One quoted direct peer
There are no directly comparable quoted peers in the UK and the overall competition is highly fragmented. The most substantial international operators are:
■
Hallmark Cards, a privately owned US company with 2015 revenues of $3.7bn. Hallmark has rationalised its manufacturing base and reorganised into three operations: Hallmark Greetings, Hallmark Home & Gifts and Hallmark Retail.
■
American Greetings Corporation, which was quoted on NYSE until being taken private by the Weiss family in 2013. It generated revenues of $1.9bn in the year to February 2016, down 5.5% on the previous year, with the impact of currency movements affecting the comparison. Its sales in the gift packaging and party goods segment of around $340m were up by c 1% on FY15, representing 18% of overall net sales (FY15: 17%).
■
CSS Industries, again a US firm but still quoted and on a smaller scale, with historic sales of $317m, up 1% year-on-year and with a bias to Christmas product. There are no publicly available forecasts.
Given that there is no direct peer group, we have cast our net a little wider and looked at three other US-based manufacturers and distributors of relatively low-ticket consumer goods/gifts: Party City (supply and retail of party goods, Halloween merchandise); Lifetime Brands (kitchen gadgets); and JAKKS Pacific (toys, consumer licensed products); and CSS (see above). With these comparators, IGR is now trading on a 33% discount on historic EV/revenue, reflecting the higher rating of the retail business of Party City, up to par on EV/EBITDA and at a discount on a current year P/E basis narrowed to 2%.
Exhibit 4: Peer group valuations
EV/Sales (x) |
EV/EBITDA (x) |
P/E (x) |
||||
|
2015 |
2016 |
2015 |
2016 |
2015 |
2016 |
Lifetime Brands |
0.50 |
0.49 |
8.21 |
16.90 |
14.40 |
|
JAKKS |
0.34 |
0.31 |
5.66 |
3.78 |
10.72 |
9.78 |
Party City |
1.45 |
1.40 |
9.53 |
8.60 |
12.48 |
10.60 |
CSS |
0.80 |
4.70 |
13.40 |
|
||
|
||||||
Average |
0.77 |
0.73 |
7.03 |
6.19 |
13.38 |
11.59 |
|
||||||
IGR (annualised) |
0.51 |
0.47 |
7.19 |
6.53 |
12.31 |
11.33 |
Source: Bloomberg, Edison Investment Research. Note: Prices as at 30 June 2016.
DCF
Running a DCF has some relevance in industries that are long established and still growing, albeit at a modest underlying rate, but comes with the usual provisos regarding the sensitivity of the model to the underlying assumptions. Taking a terminal growth rate of 1%, the market is currently attributing a WACC of 9.3%. A 2% terminal growth rate and a 10% WACC give an equivalent share price of 155p compared with the current market valuation of 161p, ahead of the broad peer group.
Exhibit 5: DCF under varying terminal growth and WACC assumptions
------------------Terminal growth rate------------------ |
|||||||
-1% |
0% |
1% |
2% |
3% |
4% |
||
-------------WACC------ |
13% |
104.3 |
106.2 |
108.5 |
111.2 |
114.5 |
118.5 |
12% |
113.8 |
116.4 |
119.4 |
123.0 |
127.4 |
132.9 |
|
11% |
125.0 |
128.3 |
132.3 |
137.2 |
143.4 |
151.2 |
|
10% |
138.1 |
142.6 |
148.0 |
154.8 |
163.6 |
175.3 |
|
9% |
153.8 |
159.9 |
167.5 |
177.2 |
190.2 |
208.4 |
|
8% |
172.9 |
181.4 |
192.3 |
194.0 |
227.1 |
257.5 |
|
Break-even WACC |
8.6% |
8.9% |
9.3% |
9.7% |
10.1% |
10.6% |
|
Source: Edison Investment Research
Solid asset backing
On the basis of the balance sheet as at the end of March 2016, the value of the net assets attributable to the owners of the parent company was worth 120.4p per share, or 114.7p after minorities, giving asset backing of 75% of the current share price.
Financials
Exhibit 6: Upgrades to forecasts
EPS (p) |
PBT (£m) |
EBITDA (£m) |
|||||||
Old |
New |
% change |
Old |
New |
% change |
Old |
New |
% change |
|
2016 |
12.1 |
13.6 |
+12 |
10.1 |
10.1 |
u/c |
17.2 |
16.5 |
-4 |
2017e |
12.8 |
14.4 |
+13 |
11.1 |
12.2 |
+10 |
18.2 |
18.5 |
+2 |
2018e |
- |
15.4 |
N/A |
- |
14.1 |
N/A |
- |
20.5 |
N/A |
Source: Company accounts, Edison Investment Research. Note: FY16 new = actual.
We have revisited our forecasts in light of the FY16 figures and progress on debt reduction, with a consequent reduction in the interest cost and with the EPS line benefiting further from a lower tax charge than we had anticipated earlier. It is still very early stages to attempt to revise forecasts based on the implications of the Brexit vote. However, it is worth reiterating that this is very much a global group, with 67% of revenues earned outside the UK and around one-third of products manufactured sold in the countries in which they are made. On a mechanistic basis, sterling weakness prompts a translational benefit on earnings, with a partial offset on more expensive sourcing of product from Asia priced in US$ and of raw material prices, particularly paper.
|
Exhibit 7: Long-term earnings and margin record and forecasts |
|
|
Source: Company accounts, Edison Investment Research |
The FY16 figures show revenue growth in local currency terms in all regions, with higher gross and operating margins. The gross margin improvements (17.5% up to 18.3%) reflect the full year benefit of the efficiency gains post the capital project in Wales, combined with recovery in Australia and the progress in the US under the new management team. The shift in mix, diluting the commodity part of the offer, is also having a positive impact. The underlying gross margin target is for 20% of sales.
In terms of overheads, the increase outstripped the growth in sales, with the additional investment in the team in the US to give the capacity to address the considerable growth opportunities, as well as more head office capacity. PBIT margin is targeted to move back towards 7%. Finance costs did not decrease overall, but this was due to the mark-to-market effect on Australian provisions, which should now reverse. Our numbers show a marked step down in the interest payments in FY17e and further reduction in FY18e as the overall level of debt again reduces.
While the group was predominantly a manufacturer of commodity product, principally giftwrap, it was difficult to envisage top-line growth and the investment case centred around (i) manufacturing efficiency to combat deflationary pricing pressures and (ii) taking market share from those that could not or would not invest in their businesses to meet best practice and reduce unit cost. It is now the case that our model is predicated on top-line growth through those gains in market share and through changes in the mix, increasing the level of value add and leveraging the design and procurement skills at the heart of the group. The greatest opportunity here is undoubtedly in the US, which may well advance more strongly than we are currently anticipating in our figures. That top-line growth should be amplified in the operating profit line by the continuing investment in efficiency and greater contribution from the newer product lines. With a reducing interest line, the adjusted pre-tax growth is well supported. At the bottom line, there will be a more muted progression as the minority charge will increase (Australia) as profitability recovers and the effective tax charge rises, reflecting the higher proportion of earnings generated in the US.
|
Exhibit 8: UK/Asia revenue and operating margin |
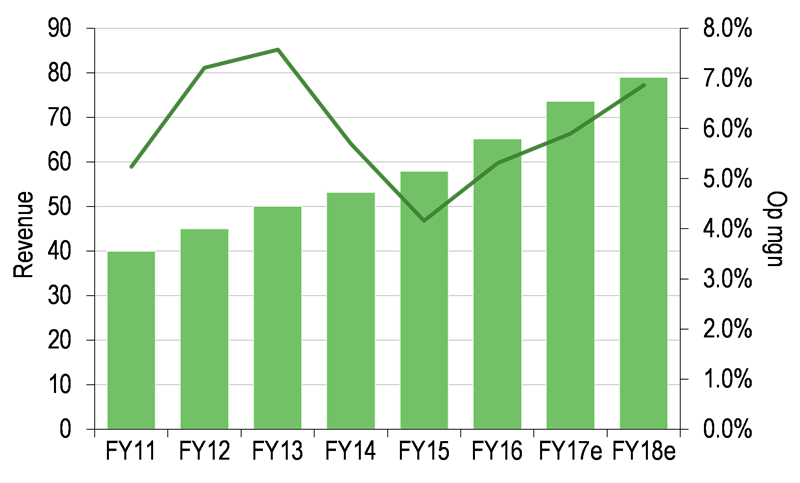
Exhibit 9: US revenue and operating margin |
|
|
|
Source: Company accounts, Edison Investment Research |
|
Exhibit 10: Europe revenue and operating margin |
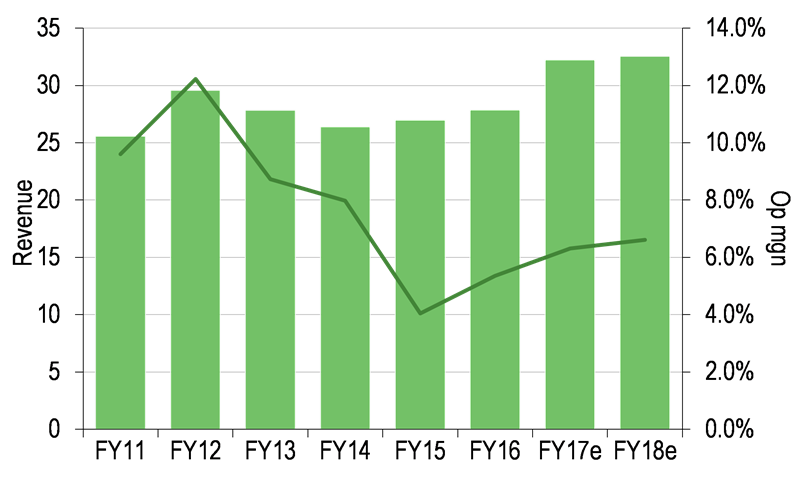
Exhibit 11: Australia revenue and operating margin |
|
|
|
Source: Company accounts, Edison Investment Research |
|
Exhibit 8: UK/Asia revenue and operating margin |
|
|
Source: Company accounts, Edison Investment Research |
|
Exhibit 10: Europe revenue and operating margin |
|
|
Source: Company accounts, Edison Investment Research |
|
Exhibit 9: US revenue and operating margin |
|
|
Source: Company accounts, Edison Investment Research |
|
Exhibit 11: Australia revenue and operating margin |
|
|
Source: Company accounts, Edison Investment Research |
The benefits of the UK investment programme on margin are clear (Exhibit 8), with top-line growth set to continue over the forecast period as the group adds product areas such as retail collateral and increases both in manufacturing output and outsourced gifting product from Asia. Our US projections (Exhibit 9) may well prove overly conservative as the group increases its penetration of wider retail channels and export markets. The group has invested already in its conversion capability in the US (see below), but could scale up its production capability as has been done in other regions. European revenues were ahead in FY16 in local currency, despite the difficult economic backdrop, as progress was made moving into Poland and Slovakia, with the benefits of scale and production efficiency showing through in margin. The Australian business has been reinvigorated with new operational initiatives and with further investment in marketing planned.
Conservative forecasts for ongoing debt reduction
Our projections on cash flow are deliberately conservative, assuming that working capital is now absorbed as the business grows. Operational cash flow in FY16 benefited from a strong working capital performance, specifically in inventory reduction. The tax rate is also rising with the increased contribution of the US business raising the blended rate, although the cash tax rate remains below the ‘expected’ rate and tax losses are being utilised as profitability is restored. There were no exceptional charges, but year-end cash benefited from the disposal of the Aberbargoed site in Wales for £1.4m. Capital expenditure plans are now targeted at the US, although the detail and extent are still under evaluation and we have included a degree of excess over budget. A relatively modest project in US high-speed paper conversion was implemented in FY16, with payback of less than two years, with a larger-scale project in printing being formally evaluated. Our model anticipates capex of around £6.0m in FY17 and FY18.
The group moved from a year-end leverage target to an average one to take account of the peaks and troughs of the working capital cycle (March represents a low for the year, with the peak typically in October/November). The previous year-end target level of 2.0x EBITDA was achieved (ahead of schedule) in FY15, from 2.8x in FY12. On an average basis, the target was set at 2.5x, to be achieved by FY19, from 4.7x in FY12. For FY16, leverage hit 2.8x (FY15: 4.0x), tantalisingly close to the 2.5x target, which should now be reached comfortably ahead of schedule. Management’s view is that 2.5x is an appropriate ongoing level for the business, meaning that there is capacity for acquisitions/bolt-ons. The share price improvement over the last 18 months means that equity can now be more sensibly included as an element of a deal, if appropriate. There is also a clear understanding that now IGR has moved well beyond the ‘repair’ phase, rewarding shareholders through dividends should be higher on the agenda. Increases in payout levels are envisaged towards cover of 3.0x (FY16 cover was 5.4x) and this trajectory is built into our forecasts.
Balance sheet facilities renegotiated
The group has made huge strides over the last few years in repairing a balance sheet that had been overstretched by the historic acquisition programme, with year-end gearing falling from 168% in FY09 to the 25% just reported for FY16 – in absolute terms from £68.5m to £17.5m. This has been achieved despite continuing investment in capacity and manufacturing facilities of £21.9m, which is testament to the inherent cash generation of the business and the focus on tight working capital management.
Exhibit 12: Financing arrangements
Lender |
Due |
Facility (£m/$m) |
Margin |
Covenant |
HSBC |
||||
- RCF & O/D |
2019 |
18 |
0.95% |
Leverage |
- Working cap RCF |
Annual |
39 |
1.40% |
Stock and unfunded debtors |
- HP agreement |
2021 |
2 |
4.75% |
Fixed |
- Invoice financing UK/Europe |
2019 |
50 |
1.10% |
Receivables |
- Invoice financing US (US$) |
2019 |
50 |
1.10% |
Receivables |
- Invoice financing Asia (US$) |
2019 |
12 |
1.30% |
Receivables |
Westpac |
Annual |
$10m |
2.52% |
Source: Company accounts
In March 2016, the company announced that it had successfully renegotiated its financing arrangements, consolidating from a consortium of banks to one, HSBC, bar certain requirements in individual territories.
Exhibit 13: Financial summary
2014 |
2015 |
2016 |
2017e |
2018e |
|||
Year end 31 March |
IFRS |
IFRS |
IFRS |
IFRS |
IFRS |
||
PROFIT & LOSS |
|||||||
Revenue |
|
|
224,462 |
229,025 |
236,950 |
250,000 |
260,000 |
Cost of Sales |
(185,244) |
(189,048) |
(193,552) |
(204,250) |
(212,420) |
||
Gross Profit |
39,218 |
39,977 |
43,398 |
45,750 |
47,580 |
||
EBITDA |
|
|
16,352 |
16,850 |
16,505 |
18,500 |
20,500 |
Operating Profit (before amort and except) |
|
11,320 |
12,315 |
12,909 |
14,400 |
16,050 |
|
Intangible Amortisation |
(576) |
(428) |
(285) |
(305) |
(310) |
||
Exceptionals |
(2,298) |
(1,235) |
0 |
0 |
0 |
||
Share-based payments |
(82) |
(623) |
(908) |
(950) |
(950) |
||
Operating Profit |
8,364 |
10,029 |
11,716 |
13,145 |
14,790 |
||
Net Interest |
(3,177) |
(2,726) |
(2,763) |
(2,200) |
(2,000) |
||
Profit Before Tax (norm) |
|
|
8,143 |
9,589 |
10,146 |
12,200 |
14,050 |
Profit Before Tax (FRS 3) |
|
|
5,269 |
7,926 |
9,861 |
11,895 |
13,740 |
Tax |
(1,582) |
(1,346) |
(2,219) |
(3,218) |
(4,122) |
||
Profit After Tax (norm) |
6,561 |
8,243 |
8,835 |
9,932 |
10,877 |
||
Profit After Tax (FRS 3) |
3,687 |
6,580 |
7,642 |
8,677 |
9,617 |
||
Average Number of Shares Outstanding (m) |
57.5 |
58.1 |
58.8 |
59.3 |
60.5 |
||
EPS - normalised (p) |
|
|
9.4 |
12.1 |
14.0 |
14.9 |
15.9 |
EPS - normalised fully diluted (p) |
|
|
9.1 |
11.8 |
13.6 |
14.4 |
15.4 |
EPS - (IFRS) (p) |
|
|
5.2 |
10.7 |
12.3 |
13.6 |
14.7 |
Dividend per share (p) |
0.0 |
1.0 |
2.5 |
3.3 |
4.0 |
||
Gross Margin (%) |
17.5 |
17.5 |
18.3 |
18.3 |
18.3 |
||
EBITDA Margin (%) |
7.3 |
7.4 |
7.0 |
7.4 |
7.9 |
||
Operating Margin (before GW and except.) (%) |
5.0 |
5.4 |
5.4 |
5.8 |
6.2 |
||
BALANCE SHEET |
|||||||
Fixed Assets |
|
|
67,664 |
65,688 |
66,722 |
68,317 |
69,557 |
Intangible Assets |
31,950 |
31,692 |
32,236 |
31,931 |
31,621 |
||
Tangible Assets |
35,714 |
33,996 |
34,486 |
36,386 |
37,936 |
||
Investments |
0 |
0 |
0 |
0 |
0 |
||
Current Assets |
|
|
76,261 |
71,312 |
75,791 |
78,201 |
79,789 |
Stocks |
48,460 |
46,162 |
46,006 |
47,569 |
48,482 |
||
Debtors |
19,690 |
22,304 |
21,405 |
22,132 |
22,557 |
||
Cash |
8,111 |
2,846 |
8,380 |
8,500 |
8,750 |
||
Other |
0 |
0 |
0 |
0 |
0 |
||
Current Liabilities |
|
|
(51,965) |
(45,722) |
(48,331) |
(48,718) |
(47,817) |
Creditors |
(39,139) |
(39,982) |
(42,765) |
(44,218) |
(45,067) |
||
Short term borrowings |
(12,826) |
(5,740) |
(5,566) |
(4,500) |
(2,750) |
||
Long Term Liabilities |
|
|
(34,799) |
(28,694) |
(22,810) |
(23,356) |
(21,356) |
Long term borrowings |
(32,232) |
(26,479) |
(20,297) |
(19,000) |
(17,000) |
||
Other long term liabilities |
(2,567) |
(2,215) |
(2,513) |
(4,356) |
(4,356) |
||
Net Assets |
|
|
57,161 |
62,584 |
71,372 |
74,444 |
80,174 |
CASH FLOW |
|||||||
Operating Cash Flow |
|
|
13,724 |
17,851 |
20,744 |
17,350 |
19,800 |
Net Interest |
(3,221) |
(2,775) |
(1,961) |
(2,200) |
(2,000) |
||
Tax |
(60) |
(1,263) |
(1,797) |
(3,118) |
(3,870) |
||
Capex |
(5,291) |
(2,100) |
(3,191) |
(6,000) |
(6,000) |
||
Acquisitions/disposals |
140 |
(1,451) |
0 |
0 |
0 |
||
Financing/Other |
1,225 |
(1,347) |
74 |
0 |
0 |
||
Dividends |
(1,014) |
(829) |
(1,032) |
(2,580) |
(3,024) |
||
Net Cash Flow |
5,503 |
8,086 |
12,837 |
3,452 |
4,906 |
||
Opening net debt/(cash) |
|
|
42,138 |
36,947 |
29,373 |
17,483 |
15,000 |
HP finance leases initiated |
296 |
0 |
0 |
0 |
0 |
||
Other |
(608) |
(512) |
(947) |
(969) |
(906) |
||
Closing net debt/(cash) |
|
|
36,947 |
29,373 |
17,483 |
15,000 |
11,000 |
Source: Company accounts, Edison Investment Research
|
|||||||||||||||||||||||||||||||||||||||||||||||
|