Last close As at 05/08/2026
GBP1.04
▲ 6.95 (7.15%)
Market capitalisation
GBP2,539m
Research: Metals & Mining
Almost exactly half way through its financial year, Pan African has reiterated its production guidance for FY25 of 215,000oz – not least as a result of c 9,000oz gold produced at MTR in H125 following a seamless ramp-up process that has proceeded ahead of schedule since commissioning in early October. As a consequence, we have revised our production expectations for FY25 up by 3,130oz (1.5%), although we have revised our normalised headline EPS (HEPS) expectations down by a modest 4.2% to reflect lower margin initial start-up production supplanting established, steady-state production from Evander and Barberton and the recent 3.0% strengthening of the rand against the US dollar. Note that production in H225 is expected to be 44.6%, or 38,590oz, higher than in H125. Guidance for FY26 was exactly in line with our prior expectations.
Pan African Resources |
Honing FY25e forecasts |
Production update |
Metals and mining |
18 December 2024 |
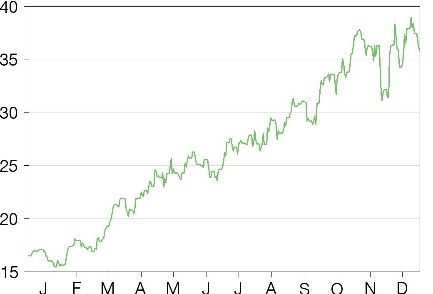
Share price performance
Business description
Next events
Analyst
Pan African Resources is a research client of Edison Investment Research Limited |
|||||||||||||||||||||||||||||||||||||||||||||||||||||||||
Almost exactly half way through its financial year, Pan African has reiterated its production guidance for FY25 of 215,000oz – not least as a result of c 9,000oz gold produced at MTR in H125 following a seamless ramp-up process that has proceeded ahead of schedule since commissioning in early October. As a consequence, we have revised our production expectations for FY25 up by 3,130oz (1.5%), although we have revised our normalised headline EPS (HEPS) expectations down by a modest 4.2% to reflect lower margin initial start-up production supplanting established, steady-state production from Evander and Barberton and the recent 3.0% strengthening of the rand against the US dollar. Note that production in H225 is expected to be 44.6%, or 38,590oz, higher than in H125. Guidance for FY26 was exactly in line with our prior expectations.
Year end |
Revenue (US$m) |
PBT* |
EPS* |
DPS |
P/E |
Yield |
06/23** |
321.6 |
92.9 |
3.54 |
0.95 |
13.5 |
2.0 |
06/24** |
373.8 |
119.8 |
4.68 |
1.24 |
10.2 |
2.6 |
06/25e |
485.4 |
187.5 |
6.79 |
1.47 |
7.0 |
3.1 |
06/26e |
596.3 |
198.5 |
7.26 |
5.61 |
6.6 |
11.8 |
Note: *PBT and EPS are normalised, excluding amortisation of acquired intangibles and exceptional items. **FY23 and FY24 ‘as reported’ and not restated or adjusted.
Mintails financing facility concluding in February
In addition, we have increased our forecast for the contract liability related to the fixed-price forward sales associated with Pan African’s ZAR400m Mintails financing facility in FY25. However, we note that this concludes in February, after which Pan African will be fully exposed to the spot price of gold.
Valuation: Dividend poised for sharp jump in FY26
Our core valuation of Pan African has declined by 3.7% since our last note, to 41.01c per share, based on its mines either in production or sanctioned, albeit this is conducted at a relatively conservative gold price (US$2,124/oz nominal on average for the period FY26–30) and reflects little more than the recent strengthening of the rand against the dollar. Our valuation rises by a further 22.56–27.58c (17.74–21.69p) to 62.05–67.07c (48.79–52.74p) if other assets, such as Egoli and the Soweto cluster are taken into account. It more than doubles, to 87.71c (68.97p), at the current price of gold of US$2,682/oz. Alternatively, if PAF’s historical average price to normalised HEPS ratio of 8.2x for the period FY10–24 is applied to our FY25 and FY26 forecasts, it implies a value of 43.60p in FY25, followed by one of 46.64p in FY26. Stated alternatively, PAF’s current share price of 37.45p could be interpreted as discounting normalised HEPS rising to only 5.83c per share in FY25 and/or FY26 (cf 5.27c ‘adjusted’ in FY24 and our forecasts of 6.79c and 7.26c in FY25 and FY26, respectively). In the meantime, PAF remains cheaper than its principal London- and South African-listed gold mining peers on at least 63% of commonly used valuation measures if Edison forecasts are used or 88% if consensus forecasts are used (note that, for these purposes, Edison forecasts are relatively conservative – see Exhibit 3). Performing a relative valuation analysis, its peers imply a comparable valuation for PAF of 50.32p based on our year one EPS estimate and 39.88p based on our year two EPS estimate. Finally, should our dividend forecast for FY26 be realised, it would make PAF the sixth highest yielding company in the sector globally.
Production update
Since our last note on the company, on 14 November, Pan African has advised the market of the completion of the Tennant Consolidated (TCGM) acquisition and provided a production update for its operations for H125 plus guidance for FY25 and FY26.
■
Gold production for H125 is expected to be in line with production in H224 (87,581oz). In detail:
•
Following successful plant commissioning and first gold pour in early October, production from the Mogale Tailings Retreatment (MTR) operation of c 9,000oz in H125 has offset a decline in production at Evander owing to a delay in commissioning the subvertical shaft (now resolved). Moreover, the plant’s upfront construction capital is now estimated at ZAR2.35–2.40bn (US$132–135m at prevailing forex rates) cf the ZAR2.50bn (US$141m) originally budgeted, a saving of c ZAR100–150m (US$6–8m). To date, production ramp-up is reported to be ahead of schedule with steady-state production anticipated this month. Production for FY25 is estimated by management to be 33,000oz at an all-in sustaining cost (AISC) of under US$1,000/oz. In the meantime, studies are underway to increase annual production from 50,000oz to 60,000oz pa via:
•
The installation of additional reactors to further improve recoveries.
•
The addition of two carbon-in-leach (CIL) tanks to increase throughput from 800ktpm to 1Mtpm, at a limited estimated capital cost of ZAR70m (US$3.9m).
•
The inclusion of a hard rock crushing circuit to enable the processing of nearby remnant hard rock sources (for which a pre-feasibility study is expected in the next three months).
•
Simultaneously, a feasibility study is to be completed on the Soweto Cluster by September 2025, focusing on the possibility of constructing a new processing facility in closer proximity to the Soweto Cluster tailings storage facilities (TSFs), which would be a stand-alone operation also producing c 50,000oz pa plus the option to include additional proximal TSF resources that will add to the project’s life.
•
Elikhulu is forecast to produce c 26,000oz in H125 and 52,000oz in FY25, after Phases 3 and 4 of the new tailings dam construction were completed ahead of schedule and under budget.
•
The Barberton Tailings Retreatment Plant (BTRP) is on track to produce 7,000–8,000oz in H125.
•
Evander Mines’ underground production ramp-up delays from 24 to 25 Level operations at 8 Shaft have been resolved after the commissioning of the sub-vertical hoisting shaft in December, enabling its full 700t/day hoisting capacity to be achieved. A production loss of 7,000oz for the year is now anticipated by management (cf 5,000oz previously), resulting in a production expectation of c 12,000oz in H125 and 38,000oz in FY25 after the establishment of the 24 Level B-Line raise in Q325, which will further improve face length and mining flexibility and contribute to an improvement in the average grade expected from 6.0g/t to 7.5g/t. Simultaneously, following the dewatering of Evander Mines’ 7 Shaft, long-inclined borehole, reserve delineation drilling at 19 Level at Egoli has commenced to further define the ore payshoot.
•
Multiple Eskom transformer failures at Barberton Mines’ (BGMO’s) Fairview and Sheba operations negatively affected production for 10 days in November (by approximately 2,250oz), with the Eskom power utility’s back-up units also failing as a result of ageing infrastructure. Further contingencies are being implemented to prevent the failures from recurring, with additional spare transformers to be kept on site in the future. As a result, production from BGMO is expected to be c 32,000oz in H125 (cf 34,690oz in H224). However, high-grade areas of the 262 Platform at Fairview Mine, indicated by drill intersections of up to 80g/t Au, are anticipated to be accessed by Q325 as development rates are accelerated, while underground sampling at Consort has confirmed high-grade mineral reserve areas below 41 Level in the Prince Consort (PC) shaft area. Rehabilitation work on the shaft has now been largely completed, allowing operations to recommence. FY25 production is therefore anticipated to be c 73,000oz (cf 71,470oz in FY24).
•
Construction work at TCMG’s Nobles project is proceeding on schedule.
■
FY26 production (excluding TCMG) is expected to increase significantly to c 235–250koz (note that this is exactly in line with our prior expectation, which remains unchanged).
As a result of Pan African’s updated guidance, Edison has revised its production forecasts for the group to those shown in Exhibit 1, below.
Exhibit 1: Pan African production, H121–FY26e (oz)
Operation |
H121 |
H221 |
H122 |
H222 |
H123 |
H223 |
H124 |
H224 |
H125e |
H225e |
FY25e (current) |
FY25e (prior) |
FY26e |
Barberton UG |
42,350 |
42,476 |
39,991 |
35,747 |
32,022 |
32,564 |
36,780 |
34,690 |
32,000 |
41,463 |
73,463 |
79,235 |
80,000 |
BTRP |
10,004 |
8,235 |
9,126 |
10,434 |
10,012 |
9,863 |
9,864 |
9,024 |
7.500 |
7,500 |
15,000 |
13,913 |
12,754 |
Barberton |
52,354 |
50,711 |
49,117 |
46,181 |
42,034 |
42,427 |
46,644 |
43,714 |
39,500 |
48,963 |
88,463 |
93,148 |
92,754 |
Evander UG |
12,607 |
23,409 |
27,312 |
21,538 |
19,173 |
10,359 |
21,307 |
16,978 |
12,000 |
26,000 |
38,000 |
42,042 |
51,921 |
Evander surface |
6,560 |
4,677 |
5,756 |
3,564 |
5,270 |
5,373 |
2,401 |
183 |
0 |
0 |
0 |
0 |
0 |
Evander |
19,169 |
28,086 |
33,068 |
25,102 |
24,443 |
15,732 |
23,708 |
17,161 |
12,000 |
26,000 |
38,000 |
42,042 |
51,921 |
Elikhulu |
26,863 |
24,596 |
25,900 |
26,320 |
25,830 |
24,743 |
28,106 |
26,706 |
26,000 |
26,000 |
52,000 |
49,143 |
46,857 |
MTR |
9,000 |
24,127 |
33,127 |
24,127 |
54,603 |
||||||||
Total (excl TCMG) |
98,386 |
103,391 |
108,085 |
97,603 |
92,307 |
82,902 |
98,458 |
87,581 |
86,500 |
125,090 |
211,590 |
208,460 |
246,135 |
Nobles |
62,200 |
||||||||||||
Total |
308,335 |
Source: Edison Investment Research, Pan African Resources. Note: Totals may not add up owing to rounding. UG, underground. BTRP, Barberton Tailings Retreatment Project.
Overall, therefore, Edison has increased its (albeit conservative) FY25 production forecast by 3,130oz (1.5%), with all of the increase effectively being accounted for by the seamless commissioning and ramp-up of the MTR project.
In addition to changes to our immediate output assumptions, we have revised our estimate of the gold price for the remainder of the financial year to June up to US$2,682/oz (ie that prevailing at the time of writing). At the same time, we have adjusted our foreign exchange rates to reflect the renewed strength of the rand against both the US dollar and sterling:
■
from ZAR23.1595/£ to ZAR22.5670/£ (-2.6%),
■
from ZAR18.2858/US$ to ZAR17.7435/US$ (-3.0%), and
■
from US$1.2669/£ to US$1.2718/£ (+0.4%).
All told, however, the net effect of these changes on our financial forecasts for FY25 and FY26 has been modest, as shown in Exhibit 2, below:
Exhibit 2: Pan African P&L statement by half year (H123–H224e)
US$000s* |
H123 |
H223 |
H124 |
H224 |
H125e |
FY25e (current) |
FY25e (prior) |
FY26e (current) |
FY26e (prior) |
Revenue |
156,489 |
165,117 |
193,947 |
179,849 |
206,450 |
485,428 |
459,333 |
596,265 |
597,749 |
Cost of production |
(99,282) |
(99,508) |
(110,292) |
(110,891) |
(111,679) |
(249,739) |
(216,483) |
(321,602) |
(316,974) |
Depreciation |
(11,122) |
(9,277) |
(10,768) |
(10,476) |
(11,539) |
(25,726) |
(38,058) |
(59,432) |
(58,348) |
Mining profit |
46,085 |
56,332 |
72,887 |
58,482 |
83,232 |
209,963 |
204,792 |
215,232 |
222,428 |
Other income/(expenses) |
(3,610) |
(3,737) |
(7,231) |
(3,144) |
(23,473) |
(32,053) |
(16,257) |
(1,592) |
(1,586) |
Loss in associate etc |
0 |
0 |
0 |
0 |
|||||
Loss on disposals |
0 |
0 |
0 |
0 |
|||||
Impairments |
0 |
0 |
0 |
0 |
|||||
Royalty costs |
(468) |
(495) |
(1,242) |
(445) |
(5,269) |
(4,834) |
(4,890) |
(3,941) |
(4,013) |
Net income before finance |
42,007 |
52,100 |
64,414 |
54,893 |
54,490 |
173,077 |
183,645 |
209,699 |
216,829 |
Finance income |
456 |
683 |
760 |
1,124 |
|||||
Finance costs |
(3,464) |
(6,228) |
(5,594) |
(6,190) |
|||||
Net finance income |
(3,008) |
(5,545) |
(4,834) |
(5,066) |
(8,131) |
(17,619) |
(9,396) |
(12,795) |
(11,319) |
Profit before taxation |
38,999 |
46,555 |
59,580 |
49,827 |
46,359 |
155,458 |
174,248 |
196,904 |
205,510 |
Taxation |
(10,063) |
(14,754) |
(17,223) |
(13,358) |
(13,224) |
(49,750) |
(45,769) |
(51,111) |
(53,706) |
Effective tax rate (%) |
25.8 |
31.7 |
28.9 |
26.8 |
28.5 |
32.0 |
26.3 |
26.0 |
26.1 |
PAT (continuing ops) |
28,936 |
31,801 |
42,357 |
36,469 |
33,135 |
105,707 |
128,479 |
145,793 |
151,804 |
Minority interest |
(136) |
(266) |
(224) |
(328) |
0 |
0 |
0 |
0 |
0 |
Ditto (%) |
(0.5) |
(0.8) |
(0.5) |
(0.9) |
0 |
0 |
0 |
0 |
0 |
Attributable profit |
29,072 |
32,067 |
42,581 |
36,797 |
33,135 |
105,707 |
128,479 |
145,793 |
151,804 |
Headline earnings |
29,072 |
31,392 |
42,581 |
36,903 |
33,135 |
105,707 |
128,479 |
145,793 |
151,804 |
Est normalised headline earnings |
32,682 |
35,129 |
49,812 |
40,047 |
56,608 |
137,760 |
144,736 |
147,385 |
153,390 |
EPS (c) |
1.52 |
1.67 |
2.22 |
1.92 |
1.63 |
5.21 |
6.29 |
7.18 |
7.43 |
HEPS** (c) |
1.52 |
1.63 |
2.22 |
1.93 |
1.63 |
5.21 |
6.29 |
7.18 |
7.43 |
Normalised HEPS (c) |
1.71 |
1.83 |
2.60 |
2.09 |
2.79 |
6.79 |
7.09 |
7.26 |
7.51 |
Source: Pan African Resources, Edison Investment Research. Note: As reported basis. *Unless otherwise indicated. **HEPS, headline earnings per share (South African company adjusted basis).
Our forecast for mining profit for FY25e has therefore actually risen relative to our prior estimate and the decline in our EPS and HEPS forecasts for FY25e may be largely attributed to the increase in our forecast for the contract liability related to the fixed-price forward sales associated with Pan African’s ZAR400m Mintails financing facility, which, readers will recall, Edison shows in the ‘Other income/(expenses)’ line of the profit & loss statement. Although this is not in accordance with accounting standards, it allows the underlying performance of the operating company to be distinguished from the volatility created by derivative-type profits and losses, which would otherwise be more strictly included in the revenue line. Otherwise, the 4.2% decline in our forecast for normalised EPS is broadly in line with the 3.0% decline in the dollar/rand forex rate since the time of our last note. Readers will also note that Edison’s forecasts for PAF’s royalty costs and its effective tax rate (which are driven by formulae) are high within the historical context and, with respect to these measures, they may therefore be considered conservative. This may be seen in a comparison between Edison and consensus forecasts for the periods in question:
Exhibit 3: Pan African H125, FY25 and FY26 consensus EPS forecasts cf Edison (US cents per share)
H125 |
FY25 |
FY26 |
|
Edison forecasts |
2.79 |
6.79 |
7.26 |
Mean consensus |
3.00 |
7.60 |
10.8 |
High consensus |
3.00 |
9.00 |
14.5 |
Low consensus |
3.00 |
6.00 |
6.00 |
Source: LSEG Data & Analytics, Edison Investment Research. Note: As at 12 December 2024.
Group production
In the light of these developments, we are continuing to forecast that group production from FY26 onwards will easily exceed 250koz per year with a material contribution from TCGM’s assets and may approach 400koz pa in FY29, when all of PAF’s mines are operating at close to capacity, pushing normalised headline EPS (HEPS) as high as 9c per share (see Exhibit 5).
|
Exhibit 4: Estimated Pan African group gold production profile, FY18–30e |
|
|
Source: Edison Investment Research, Pan African Resources |
Updated (absolute) valuation
Valuation
In the aftermath of these changes, our absolute valuation of PAF (based on its existing four producing assets plus the 25 and 26 Level project, Mogale and Nobles) has fallen by a modest 3.7% to 39.49c (cf 41.01c previously), which is based on the present value of the estimated potential dividend stream payable to shareholders over the life of its mining operations (applying a 10% discount rate to US dollar dividends). This is approximately the result that would be expected given a 3.0% appreciation in the rand/dollar forex rate.
|
Exhibit 5: PAF estimated life of operations diluted EPS and (maximum potential*) DPS |
|
|
Source: Pan African Resources, Edison Investment Research. Note: *From FY29. Excludes discretionary exploration investment. |
However, readers should note that this valuation is conducted at Edison’s relatively conservative gold price assumptions of US$2,124/oz (nominal) average for the period FY26–30. At the current gold price of US$2,682/oz, all other things being equal, our valuation more than doubles to 87.71c (68.97p).
Even so, including its other growth projects and assets, our updated total valuation of PAF as a whole rises to 62.05–67.07c (48.79–52.74p).
Exhibit 6: PAF group absolute valuation summary
Project |
Current valuation |
Previous valuation |
Existing producing assets* |
39.49 |
41.01 |
Cum-FY24 dividend |
N/A |
1.20 |
Royal Sheba** |
1.42 |
1.26 |
Other** |
2.32 |
2.04 |
Sub-total |
43.23 |
45.50 |
EGM underground resource |
0.22-5.24 |
0.22–5.24 |
Sub-total |
43.45-48.47 |
45.72–50.74 |
Egoli |
16.71 |
16.92 |
Soweto cluster |
1.89 |
1.99 |
Total |
62.05-67.07 |
64.63–69.65 |
Source: Edison Investment Research. Note: *Including 24 Level and 25 & 26 Level, Mogale and Nobles projects. **Resource based valuations. Numbers may not add up owing to rounding.
Note that, for the purposes of our forecasts and valuation, we have not yet included any additional hedging in our estimates. Pan African has stated that it has approved lines in place to hedge approximately 75% of TCMG production for the first two years of operation in order to secure the return on its initial investment. Indicative pricing at a spot gold price of A$3,947/oz (US$2,644/oz at US$0.67/A$) for a zero-cost collar structure is a floor price of A$3,600/oz (US$2,412/oz) and a cap price of A$4,800/oz (US$3,216/oz). However, we will only model these into PAF’s accounts once the contracts are actually in place.
Historical relative and current peer group valuation
Historical relative valuation
Exhibit 7 below depicts PAF’s average share price in each of the financial years from FY10 to FY24 and compares this with HEPS in the same year. For FY25 and FY26, the predicted share price is shown, given our forecast normalised HEPS for those years (see paragraph below Exhibit 7). As is apparent from the chart, PAF’s price to normalised HEPS ratios of 7.0x and 6.6x for FY25 and FY26, respectively, remain in the lower half of its recent historical range of 4.1–14.8x for the period FY10–24:
|
Exhibit 7: PAF historical price to normalised HEPS** ratio, FY10–26e |
|
|
Source: Edison Investment Research. Note: *Completed historical years calculated with respect to average share price within the year shown and normalised HEPS; zero normalisation assumed before 2016. **HEPS shown in pence prior to 2018 and US cents thereafter. |
If PAF’s average year one price to normalised EPS ratio of 8.2x for the period FY10–24 is applied to our updated normalised earnings forecasts, it implies a share price for PAF of 43.60p in FY25 followed by one of 46.64p in FY26 (as shown Exhibit 7). Stated alternatively, PAF’s current share price of 37.45p, at prevailing foreign exchange rates, appears to be discounting FY25 and/or FY26 normalised HEPS of 5.83c per share (cf our forecasts of 6.79c and 7.26c, respectively).
Relative peer group valuation
In the meantime, it may be seen that PAF remains cheap relative to its London- and South African-listed gold mining peers on 63% of comparable common valuation measures (23 out of 36 individual measures in the table below) if Edison forecasts are used or 88% of valuation measures (32 out of 36 individual measures) if consensus forecasts are used.
Exhibit 8: Comparative valuation of PAF with South African and London peers
Company |
EV/EBITDA (x) |
P/E (x) |
Yield (%) |
|||
Year 1 |
Year 2 |
Year 1 |
Year 2 |
Year 1 |
Year 2 |
|
AngloGold Ashanti |
5.0 |
3.6 |
10.1 |
7.7 |
2.0 |
1.6 |
Gold Fields |
5.4 |
3.8 |
11.8 |
7.2 |
3.1 |
4.8 |
Sibanye Stillwater |
4.9 |
3.5 |
6.4 |
4.5 |
0.6 |
4.5 |
Harmony |
4.0 |
3.6 |
6.9 |
7.0 |
2.2 |
2.9 |
Perseus Mining |
3.5 |
3.6 |
7.2 |
8.3 |
2.8 |
2.7 |
Endeavour Mining (consensus) |
4.5 |
3.1 |
14.1 |
7.3 |
4.4 |
4.8 |
Average (excluding PAF) |
4.5 |
3.5 |
9.4 |
7.0 |
2.5 |
3.6 |
PAF (Edison) |
4.8 |
4.1 |
7.0 |
6.6 |
3.1 |
11.8 |
PAF (consensus) |
4.4 |
3.4 |
6.3 |
4.4 |
4.1 |
7.3 |
Source: Edison Investment Research, LSEG Data & Analytics. Note: Consensus and peers priced at 13 December 2024.
Alternatively, applying PAF’s peers’ average year one P/E ratio of 9.4x to our normalised HEPS forecast of 6.79c per share for FY25 implies a share price for the company of 50.32p at prevailing foreign exchange rates. Applying its peers’ average year two P/E ratio of 7.0x to our normalised HEPS forecast of 7.26c per share for FY26 implies a share price of 39.88p.
Financials
Pan African reported net debt of US$104.4m on its balance sheet as at end-June 2024 (cf US$61.7m as at end-December 2023 and US$22.1m as at end-June 2023), which equated to a gearing ratio (net debt/equity) of 28.6% (cf 18.8% at end-December 2023 and 7.5% at end-June 2023) and a leverage ratio (net debt/[net debt+equity]) of just 22.2% (cf 15.8% at end-December 2023 and 7.0% at end-June 2023), after cash flow from operating activities of US$109.1m before dividends (cf US$45.5m in H124, US$88.5m in H223 and US$31.6m in H123). Capex guidance for FY25 is ZAR2.27bn (c US$124.1m at prevailing foreign exchange rates). Beyond that, we forecast that PAF will continue to generate cash from operations comfortably above the US$100m pa level (and potentially around the US$200m pa level) into the foreseeable future, such that net debt is eliminated late in FY26, by which time we assume that capex will once again have returned to near-sustaining levels.
|
Exhibit 9: Pan African estimated net debt profile forecast, FY17–26e (annually) |
|
|
Source: Edison Investment Research, Pan African Resources |
Even so, we calculate that Pan African’s maximum net debt requirement of US$142.2m at end-FY25 will equate to no more than 28.9% gearing (defined as net debt/equity) or 22.4% leverage (defined as net debt/[net debt+equity]). Owing to the passage of time and the building up of equity in the form of retained income, however, this is a much lower debt burden on the company than the equivalent time when net debt was similarly high, at US$128.4m in FY19, when gearing amounted to 70.0% and leverage amounted to 41.2%.
Exhibit 10: Financial summary
US$'000s |
2022 |
2023 |
2024 |
2025e |
2026e |
||
Year end 30 June |
IFRS |
IFRS |
IFRS |
IFRS |
IFRS |
||
PROFIT & LOSS |
|||||||
Revenue |
|
|
376,371 |
321,606 |
373,796 |
485,428 |
596,265 |
Cost of sales |
(226,445) |
(198,790) |
(221,183) |
(249,739) |
(321,602) |
||
Gross profit |
149,926 |
122,816 |
152,613 |
235,689 |
274,664 |
||
EBITDA |
|
|
147,830 |
121,853 |
150,926 |
230,855 |
270,723 |
Operating profit (before amort. and excepts.) |
|
|
121,402 |
101,454 |
129,682 |
205,130 |
211,291 |
Intangible amortisation |
0 |
0 |
0 |
0 |
0 |
||
Exceptionals |
(10,295) |
(7,347) |
(10,375) |
(32,053) |
(1,592) |
||
Other |
0 |
0 |
0 |
0 |
0 |
||
Operating profit |
111,107 |
94,107 |
119,307 |
173,077 |
209,699 |
||
Net interest |
(4,231) |
(8,553) |
(9,900) |
(17,619) |
(12,795) |
||
Profit Before Tax (norm) |
|
|
117,171 |
92,901 |
119,782 |
187,511 |
198,496 |
Profit before tax (FRS 3) |
|
|
106,876 |
85,554 |
109,407 |
155,458 |
196,904 |
Tax |
(31,924) |
(24,817) |
(30,581) |
(49,751) |
(51,111) |
||
Profit after tax (norm) |
85,247 |
68,084 |
89,201 |
137,760 |
147,385 |
||
Profit after tax (FRS 3) |
74,952 |
60,737 |
78,826 |
105,707 |
145,793 |
||
Average Number of Shares Outstanding (m) |
1,926.1 |
1,916.5 |
1,916.5 |
2,029.3 |
2,029.3 |
||
EPS - normalised (c) |
|
|
4.44 |
3.54 |
4.68 |
6.79 |
7.26 |
EPS - FRS 3 (c) |
|
|
3.90 |
3.19 |
4.14 |
5.21 |
7.18 |
Dividend per share (c) |
1.04 |
0.95 |
1.24 |
1.47 |
5.61 |
||
Gross margin (%) |
39.8 |
38.2 |
40.8 |
48.6 |
46.1 |
||
EBITDA margin (%) |
39.3 |
37.9 |
40.4 |
47.6 |
45.4 |
||
Operating margin (before GW and except.) (%) |
32.3 |
31.5 |
34.7 |
42.3 |
35.4 |
||
BALANCE SHEET |
|||||||
Fixed assets |
|
|
401,139 |
439,676 |
676,478 |
798,433 |
783,587 |
Intangible assets |
44,210 |
44,429 |
43,994 |
46,220 |
48,428 |
||
Tangible assets |
355,802 |
395,247 |
632,484 |
752,213 |
735,159 |
||
Investments |
1,127 |
0 |
0 |
0 |
0 |
||
Current assets |
|
|
55,953 |
61,263 |
57,938 |
51,020 |
62,381 |
Stocks |
9,977 |
9,567 |
16,431 |
16,264 |
19,886 |
||
Debtors |
17,546 |
15,182 |
15,175 |
34,756 |
42,495 |
||
Cash |
26,993 |
34,771 |
26,332 |
0 |
0 |
||
Current liabilities |
|
|
(58,989) |
(77,386) |
(84,864) |
(154,710) |
(245,286) |
Creditors |
(57,117) |
(65,884) |
(79,344) |
(105,784) |
(222,858) |
||
Short-term borrowings |
(1,872) |
(11,502) |
(5,520) |
(48,925) |
(22,428) |
||
Long-term liabilities |
|
|
(103,494) |
(128,957) |
(237,104) |
(206,324) |
(80,338) |
Long-term borrowings |
(37,088) |
(45,334) |
(125,214) |
(93,239) |
33,678 |
||
Other long-term liabilities |
(66,406) |
(83,623) |
(111,890) |
(113,085) |
(114,015) |
||
Net assets |
|
|
294,609 |
294,596 |
412,448 |
488,419 |
520,344 |
CASH FLOW |
|||||||
Operating Cash Flow |
|
|
142,879 |
132,941 |
134,310 |
168,951 |
272,340 |
Net Interest |
(2,794) |
(5,121) |
(9,731) |
(17,619) |
(12,795) |
||
Tax |
(8,520) |
(7,722) |
(15,476) |
(17,793) |
(31,808) |
||
Capex |
(81,951) |
(109,952) |
(169,521) |
(160,473) |
(44,586) |
||
Acquisitions/disposals |
563 |
(2,779) |
141 |
0 |
0 |
||
Financing |
(3,222) |
0 |
0 |
0 |
0 |
||
Dividends |
(21,559) |
(19,975) |
(18,302) |
(18,302) |
(29,736) |
||
Net cash flow |
25,396 |
(12,608) |
(78,579) |
(45,236) |
153,414 |
||
Opening net debt/(cash) |
|
|
23,553 |
11,967 |
22,065 |
104,402 |
142,165 |
Exchange rate movements |
(4,401) |
(4,481) |
1,160 |
0 |
0 |
||
Other |
(9,409) |
6,991 |
(4,918) |
7,474 |
0 |
||
Closing net debt/(cash) |
|
|
11,967 |
22,065 |
104,402 |
142,165 |
(11,250) |
Source: Company sources, Edison Investment Research. Note: FY24 balance sheet ‘pro forma’ and income statement and cash flow statement ‘as reported’. FY23 ‘as reported’ and not restated as per FY24 results (NB restatement deemed immaterial by Edison).
|
|
Research: Real Estate
Phoenix Spree Deutschland (PSD) has completed the strategic sale of a 16-building portfolio of rental properties. Under its amended financing terms, PSD can now significantly accelerate condominium (condo) sales, exploiting the wide sales premium over investment property valuations. This is central to an orderly realisation strategy aimed at maximising shareholder value, which we believe is materially ahead of that implied by the share price. Disposal proceeds will first be used to repay existing debt ahead of the 2026 maturity, although refinancing options to accelerate shareholder distributions are possible.