Last close As at 05/08/2026
—
— 0.00 (0.00%)
Market capitalisation
—
Research: Investment Companies
Seneca Global Income & Growth Trust (SIGT) has changed its benchmark to a more relevant CPI +6% rather than Libor +3%, aiming to achieve an average annual return of 6% above the rate of UK inflation over the course of a typical investment cycle. There has been no change to the investment process; SIGT seeks to generate long-term growth in capital and income, with low volatility of returns, from a portfolio of multiple asset classes. Anticipating a global economic downturn in 2020, SIGT is gradually reducing its equity exposure. At end-September 2017, its tactical asset allocation (TAA) was 59% to equities and 41% to other asset classes, including more than 25% to specialist assets, which generally yield 5-8%. SIGT aims to grow annual dividends at least in line with UK inflation (as achieved in each of the last four financial years). The trust has outperformed its blended benchmark and the FTSE All-Share index over one, three and five years and since its change of mandate in 2012.
Seneca Global Income & Growth Trust |
Higher, more realistic benchmark introduced |
Investment trusts |
25 October 2017 |
Share price/discount performance
Three-year performance
Gearing
Analysts
|
|||||||||||||||||||||||||||||||||||||||||||||||||||||||||||||||||||||||||||||||||||||
Seneca Global Income & Growth Trust (SIGT) has changed its benchmark to a more relevant CPI +6% rather than Libor +3%, aiming to achieve an average annual return of 6% above the rate of UK inflation over the course of a typical investment cycle. There has been no change to the investment process; SIGT seeks to generate long-term growth in capital and income, with low volatility of returns, from a portfolio of multiple asset classes. Anticipating a global economic downturn in 2020, SIGT is gradually reducing its equity exposure. At end-September 2017, its tactical asset allocation (TAA) was 59% to equities and 41% to other asset classes, including more than 25% to specialist assets, which generally yield 5-8%. SIGT aims to grow annual dividends at least in line with UK inflation (as achieved in each of the last four financial years). The trust has outperformed its blended benchmark and the FTSE All-Share index over one, three and five years and since its change of mandate in 2012.
12 months ending |
Total share price return (%) |
Total NAV return (%) |
Blended benchmark* (%) |
FTSE All-Share (%) |
FTSE All-World (%) |
30/09/13 |
26.7 |
20.1 |
3.5 |
18.9 |
18.2 |
30/09/14 |
12.5 |
3.9 |
3.5 |
6.1 |
11.8 |
30/09/15 |
5.0 |
3.8 |
3.6 |
(2.3) |
0.6 |
30/09/16 |
16.2 |
15.0 |
3.6 |
16.8 |
31.3 |
30/09/17 |
16.5 |
16.6 |
4.6 |
11.9 |
15.5 |
Source: Thomson Datastream. Note: 12-month discrete total returns. *Blended benchmark is three-month Libor +3% to 6 July 2017 and CPI +6% thereafter.
Investment strategy: Seeking value from multi-assets
SIGT’s manager, Seneca Investment Managers (SIML) constructs a value-based portfolio of assets across multiple classes: UK and overseas equities, fixed income and specialist assets. The approach is team based; all potential new positions are discussed before being included in the portfolio and SIML employs tactical (shorter-term) asset allocations, within a long-term strategic asset allocation (SAA) framework, aiming to enhance investment returns.
Market outlook: Above average earnings multiples
Equities have remained resilient despite macroeconomic uncertainties, which include escalating tensions with North Korea and question marks over the ability of US President Trump to pursue his higher-growth, lower-tax agenda. Following a re-rating over the last several months, developed markets in aggregate are trading on forward P/E multiples that are c 25% above their 10-year averages. In such an environment, investors may wish to consider a range of asset classes.
Valuation: Shares trading close to NAV
Since adopting a discount control mechanism (DCM) in August 2016, SIGT’s shares have traded close to NAV. The current 1.5% premium to cum-income NAV compares to the average 0.7% premium of the last 12 months (range of a 2.9% premium to a 2.1% discount). Over the last three, five and 10 years, SIGT has traded at average discounts of 1.2%, 3.9% and 6.4% respectively. SIGT has a progressive dividend policy, aiming to increase annual dividends above the rate of UK inflation; its prospective yield is 3.5%.
Exhibit 1: Trust at a glance
Investment objective and fund background |
Recent developments |
|||||||||||||||||||||||||||||||||||||||||||||||||||||||||
SIGT’s objective is to outperform CPI +6% after costs per annum over the course of a typical investment cycle, with low volatility. It aims to grow aggregate annual dividends at least in line with inflation, through investment in a multi-asset portfolio including UK and overseas equities, fixed-income securities and specialist assets (including property). |
■ 9 August 2017: First interim dividend of 1.58p announced, 3.9% higher year-on-year. ■ 6 July 2017: Proposed change to the benchmark from three-month Libor +3% to CPI +6% approved at AGM. |
|||||||||||||||||||||||||||||||||||||||||||||||||||||||||
Forthcoming |
Capital structure |
Fund details |
||||||||||||||||||||||||||||||||||||||||||||||||||||||||
AGM |
July 2018 |
Ongoing charges |
1.61% |
Group |
Seneca Investment Managers |
|||||||||||||||||||||||||||||||||||||||||||||||||||||
Interim results |
December 2017 |
Net gearing |
5.2% |
Managers |
Seneca team |
|||||||||||||||||||||||||||||||||||||||||||||||||||||
Year end |
30 April |
Annual mgmt fee |
0.90% of market cap up to £50m, 0.65% above £50m |
Address |
10th Floor Horton House, Exchange Flags, Liverpool L2 3YL |
|||||||||||||||||||||||||||||||||||||||||||||||||||||
Dividend paid |
Sep, Dec, Mar, Jun |
Performance fee |
None |
|||||||||||||||||||||||||||||||||||||||||||||||||||||||
Launch date |
August 2005 |
Trust life |
Indefinite (subject to vote) |
Phone |
+44 (0)151 906 2461/2475 |
|||||||||||||||||||||||||||||||||||||||||||||||||||||
Continuation vote |
Annual |
Loan facilities |
£11m two-year rolling (£7m drawn) |
Website |
||||||||||||||||||||||||||||||||||||||||||||||||||||||
Dividend policy and history (financial years) |
Share buyback policy and history (financial years) |
|||||||||||||||||||||||||||||||||||||||||||||||||||||||||
SIGT aims to grow annual dividends above the rate of UK inflation. |
Note: Discount control mechanism was introduced at July 2016 AGM. |
|||||||||||||||||||||||||||||||||||||||||||||||||||||||||
|
|
|||||||||||||||||||||||||||||||||||||||||||||||||||||||||
Shareholder base (at 30 September 2017) |
Portfolio distribution by capital and income generation (at 30 Sept 2017) |
|||||||||||||||||||||||||||||||||||||||||||||||||||||||||
|
|
|||||||||||||||||||||||||||||||||||||||||||||||||||||||||
Top five holdings by asset category (at 30 September 2017) |
||||||||||||||||||||||||||||||||||||||||||||||||||||||||||
|
||||||||||||||||||||||||||||||||||||||||||||||||||||||||||
Source for charts and tables above: SIGT, Edison Investment Research, Morningstar
Market outlook: Equity valuations above average
Since our last SIGT report was published in late June, global equity markets have continued to appreciate. Developed markets have been led by the US, where the major indices have hit a series of new highs; while emerging markets have also fared well, arguably helped by a weaker US dollar. Macro uncertainties persist, including increased tension between the US and North Korea, as the country moves forward with its nuclear missile programme alongside the seeming inability of US President Trump to move forward with his pre-election promises.
Against this backdrop, equity valuations remain somewhat stretched. As shown in Exhibit 2 (right-hand side) on a forward P/E basis, developed market equities are trading at a c 25% premium to their 10-year averages, led by the US, Europe and the UK, with the US trading at the high end of its 10-year range. Investors may be attracted to an actively managed fund with a value approach, which has a diverse income stream from a range of asset classes.
|
Exhibit 2: Equity performance and valuations |
|||||||||||||||||||||||||||||||||||||||||||
Performance of UK and global equities in £ terms (last 10 years) |
Datastream indices forward P/E valuations (x) |
||||||||||||||||||||||||||||||||||||||||||
|
|
||||||||||||||||||||||||||||||||||||||||||
|
Source: Thomson Datastream, Edison Investment Research. Note: Data as at 24 October 2017. |
|||||||||||||||||||||||||||||||||||||||||||
Fund profile: ‘Multi-Asset Value Investing’
Founded as the Taverners Trust and managed by Aberdeen Asset Management, the trust became the Midas Income & Growth Trust in August 2005. In March 2014, the trust’s investment manager was purchased by Seneca Asset Managers Limited with the fund management business being renamed Seneca Investment Managers Limited (SIML); the trust itself was renamed Seneca Global Income & Growth Trust, highlighting its diverse mandate. SIML is a multi-asset specialist, with a focus on value. The investment process is transparent and team based and the portfolio investments are straightforward.
SIGT aims to generate income and capital growth, with low volatility, by investing in a multi-asset portfolio of equities, fixed income and specialist assets. Its mandate was changed in 2012, aiming to improve the trust’s total returns. An annual continuation vote was introduced, the fee structure was simplified and the dividend was rebased to what was considered to be a sustainable level. The strategic asset allocation to fixed income was reduced by 10pp to 15% and increased to overseas equities by 10pp to 25%. The benchmark was changed from a nominal return of 8% per year to three-month Libor +3%.
Following shareholder approval at the July 2017 AGM, SIGT’s performance benchmark was increased to CPI +6%; the board considered the former benchmark too low a hurdle. SIML believes that a combination of strategic asset allocation, active management and a contribution from gearing, minus costs, can generate average annual returns of CPI +6% over the course of a typical business cycle. The managers expect that there may be investment cycles when returns from equities and bonds will be quite low, which will make it difficult to exceed benchmark returns. However, they believe that over the course of a typical business cycle (one in which total real returns from equities and bonds over the entire cycle are in line with or above long-term averages), the new benchmark is more appropriate and reflects what the team is trying to achieve. Investors should note that there has been no change to SIGT’s investment process following the change in benchmark.
Portfolio turnover has been declining in recent quarters, following a period when the manager was consolidating the number of holdings. It is currently running at an annualised rate of c 40%, which takes into account activity both within individual asset classes and as a result of tactical asset allocation shifts.
SIGT has investment limits in place; at the time of investment, up to 5% of the portfolio may be in a single security, up to 10% in any one company and up to 7.5% in unquoted securities (currently c 3%). Up to 25% may be held in cash (currently c 4%) and gearing of up to 25% of net assets is permitted; at end-September gross gearing was 9.4%. SIML adopts a team-based approach with all of the investment professionals contributing to the management of SIGT’s portfolio. Each team member has specific research responsibilities: Peter Elston – asset allocation (strategic and tactical); Alan Borrows – fixed income fund selection; Mark Wright – direct investment in UK equities; Tom Delic – overseas equities fund selection; and Richard Parfect – specialist assets. Given SIML’s team-based investment approach, an oversight role for the SIGT portfolio is carried out by Elston and Borrows but they have only limited discretion to move away from the target portfolio agreed by the team. Alan Borrows intends to retire at the end of 2017; SIML will supplement the team in due course.
The fund managers: Seneca team
The managers’ view: Continuing to reduce equity exposure
The asset allocation specialist bases his views on tactical asset allocation with reference to the business cycle. He notes four phases in a cycle: expansion, peak, recession and recovery. Studies show that different asset classes perform better at each of these different phases, with equities performing better during the recession phase and relatively poorly at the peak phase. He believes that the European and Japanese economies are in a recovery phase and the US is in an expansion phase – similar to the UK, but further advanced. In anticipation of a global economic downturn in 2020, with an equity bear market discounting this event in 2019, SIGT has gradually been reducing its equity exposure. So far in 2017, its equity weighting has been reduced by 2.5pp to 59%, which is now underweight versus the strategic asset allocation of 60%. The managers have sold all of SIGT’s North American exposure as they expect the US stock market to be a weaker performer versus other global equity markets. Proceeds from the reduction in equity exposure have been reinvested in specialist assets and higher-yielding fixed income vehicles such as Royal London Short Duration Global High Yield Bond Fund.
Looking at the US, the asset allocation specialist notes that interest rates have been moving higher, albeit slowly, for nearly two years and he believes that recent lower levels of inflation are temporary. In his view, there is more slack in the labour force than the headline data suggest and employment continuing to rise will eventually lead to wage pressure, leading to higher inflation and therefore higher interest rates, which will have an impact on economic growth. In the UK, the asset allocation specialist notes that low productivity growth has kept a lid on inflation, but over time he expects wage pressures to build. He suggests that the cap on public sector pay has also restricted pay rises in the private sector; now that the cap has been lifted, there could also be upward pressure on private sector wages.
Asset allocation
Investment process: Diverse income stream
SIML’s investment style is ‘Multi-Asset Value Investing’; it focuses on quality assets, which are trading at a discount to their perceived intrinsic value. SIGT has a diversified portfolio comprising UK and overseas equities, fixed income and specialist assets (including property). The managers employ a strategic (long-term) asset allocation (SAA) based on the expected long-term returns from individual asset classes. SIML seeks to add value by using a tactical asset allocation (TAA), aiming to take advantage of shorter-term relative valuations of different asset classes, as well as from stock selection. SIML has a team-based approach; potential new holdings are proposed by the relevant specialist and discussed by the team, and changes to the portfolio have to be agreed by a majority, which acts as a risk control. Actual portfolio weights can vary modestly from the target, as successful positions are allowed to run or when the managers wait for income to be captured; however, any variances are limited and closely monitored.
Exhibit 3: Asset allocation ranges, long-term core and tactical asset allocations (TAA)
% |
Asset allocation range |
Core asset allocation (SAA) |
TAA end-September 2017 |
UK equities |
15-60 |
35 |
33.0 |
Overseas equities |
10-40 |
25 |
26.0 |
Total equities |
25-85 |
60 |
59.0 |
Fixed income |
0-40 |
15 |
8.7 |
Specialist |
0-50 |
25 |
28.6 |
Cash |
0-10 |
0 |
3.7 |
100 |
100 |
100.0 |
Source: Seneca Global Income & Growth Trust
Current portfolio positioning
Exhibit 3 shows SIGT’s current TAA versus SAA by asset class. In recent months, equity exposure has been reduced by 2pp, meaning that the equity TAA is now underweight the SAA by 1pp (59% versus 60%). UK exposure remains 2pp underweight, while the overseas exposure has been reduced from a 3pp overweight to a 1pp overweight. SIGT has sold all of its prior 1.5pp North American exposure and 0.5pp of its Japanese exposure.
The trust’s overseas equities positioning is now overweight Asia Pacific ex-Japan, global funds, Europe ex-UK and Japan, while underweight North America and emerging markets. It continues to have an underweight fixed income exposure, remaining zero weighted in developed markets government debt, which the managers consider to be unattractively valued. SIGT remains underweight property and overweight other specialist assets. Exhibit 4 shows SIGT’s portfolio broken down by equity (59%) and non-equity exposure (41%).
|
Exhibit 4: Distribution of equity and non-equity investments at 30 September 2017 |
|
Geographic distribution of equity investments (59% of portfolio) |
Analysis of non-equity investments (41% of portfolio) |
|
|
|
Source: Seneca Global Income & Growth Trust, Edison Investment Research. Note: Numbers subject to rounding. |
|
At end-September 2017, SIGT held 61 positions, split as follows: 24 UK equities, 11 overseas equity funds, four fixed income investments, and 22 specialist/property investments. Within the UK, the focus is on mid-cap companies, which are often less well researched and may offer better valuation opportunities. Data from SIML show that mid-caps tend to outperform large-cap companies; since 1998, the FTSE 250 index has beaten the FTSE 100 index by c 5pp per annum. The manager seeks UK companies that are generating strong cash flows, which can support the payment of growing dividends.
For overseas equity exposure, the manager seeks funds that have a value bias and are differentiated from their underlying benchmarks, and thus offer the potential for outperformance. Fixed income funds are selected on the basis of a strong credit analysis framework being in place. Specialist assets provide a diversified income stream away from equities and bonds across a range of asset classes (specialist financial 10.3%, property 7.1%, infrastructure 5.9% and private equity 5.2%). The manager states that an ideal specialist investment will lower volatility as well as enhance returns within the portfolio.
One of the new UK equity positions initiated this year is Conviviality, which was first listed on the London Stock Exchange in July 2013. It is a wholesaler and distributor of alcohol and other impulse products such as tobacco and confectionary, serving c 25,000 hospitality outlets and c 700 franchised retail stores, and is a supplier to the supermarket chains and over 400 independent specialists. Conviviality is growing strongly; in FY17 ending 30 April, its revenues almost doubled as a result of acquisitions and c 6% organic sales growth. Its shares reacted favourably to the results and the company has made a meaningful contribution to SIGT’s investment performance since purchase.
Performance: Continued multi-year outperformance
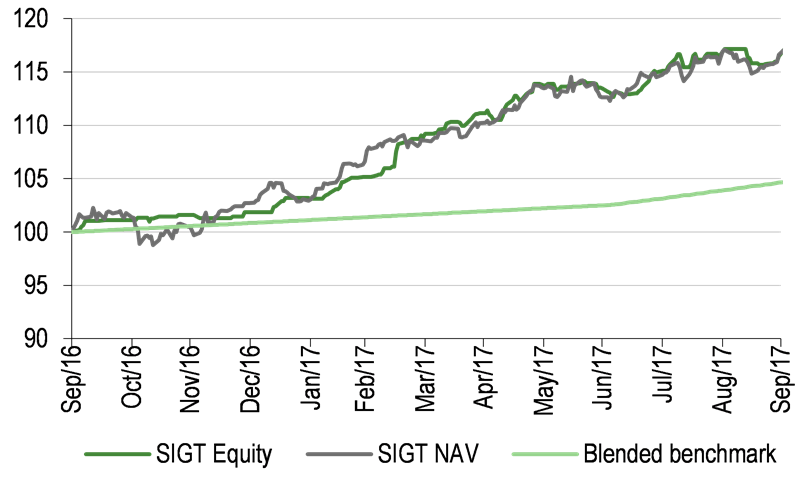
SIGT’s absolute returns are shown in Exhibit 5. Over the last 12 months, its NAV and share price total returns of 16.6% and 16.5% respectively are significantly ahead of the blended benchmark total return of 4.6%.
|
Exhibit 5: Investment trust performance to end-September 2017 |
|
Price, NAV and benchmark total return performance, one-year rebased |
Price, NAV and benchmark total return performance (%) |
|
|
|
Source: Thomson Datastream, Edison Investment Research. Note: Since change of mandate (SC) is from 18 January 2012. Benchmark is an absolute return of 8% per year until 18 January 2012, three-month Libor +3% to 6 July 2017 and CPI +6% thereafter. Performance figures for periods of more than one year are annualised. |
|
Exhibit 6 shows SIGT’s relative returns; its NAV and share price total returns are meaningfully ahead of the blended benchmark over one, three and five years and since the change in mandate in 2012. Of interest to UK investors, SIGT has also outperformed the FTSE All-Share index over these periods.
|
Exhibit 6: Share price and NAV total return relative performance |
||||||
|
Three months |
Six months |
One year |
Three years |
Five years |
Since change of mandate |
Price relative to benchmark |
0.5 |
3.6 |
11.3 |
26.5 |
68.2 |
75.7 |
NAV relative to benchmark |
1.5 |
4.4 |
11.5 |
24.0 |
44.3 |
50.9 |
Price relative to FTSE All-Share |
0.5 |
3.0 |
4.0 |
11.2 |
25.5 |
28.1 |
NAV relative to FTSE All-Share |
1.4 |
3.7 |
4.2 |
9.0 |
7.7 |
10.0 |
Price relative to FTSE All-World |
0.7 |
4.2 |
0.8 |
(6.9) |
0.4 |
3.4 |
NAV relative to FTSE All-World |
1.6 |
4.9 |
1.0 |
(8.8) |
(13.9) |
(11.2) |
|
Source: Thomson Datastream, Edison Investment Research. Note: Data to end-September 2017. Geometric calculation. Since change of mandate is from 18 January 2012. Benchmark is an absolute return of 8% per year until 18 January 2012, three-month Libor +3% to 6 July 2017 and CPI +6% thereafter. |
||||||
SIGT aims to outperform its benchmark with low volatility of returns. Data from SIML indicate that the trust’s annualised NAV volatility since the mandate change in January 2012 to end-September 2017 is significantly lower than the FTSE All-Share index (8.2% versus 13.1%) and lower than the average annualised volatility of its peers in the AIC Flexible Investment sector (8.9%).
|
Exhibit 7: SIGT NAV total return vs benchmark and FTSE All-Share total return since change of mandate, rebased |
|
|
Source: Thomson Datastream, Edison Investment Research |
Capital structure and fees
SIGT is a conventional investment trust with one class of share. There are currently 43.5m ordinary shares outstanding and no shares held in treasury. In July 2016, SIGT increased its debt facility with Royal Bank of Scotland from £7m to £11m (the facility matures in October 2017 and has an interest rate of Libor +0.7%, it is currently being renegotiated), to support the introduction of the DCM. However, to date the increased facility has not been utilised as the manager believes that asset markets do not offer sufficient value to warrant a higher level of gearing. Gross gearing at end-September was 9.4%.
Following the change in investment mandate in January 2012, SIGT’s annual management fee was reduced from 1.0% to 0.9% per year and the performance fee was removed. SIML has subsequently further reduced fees and is now paid 0.90% of SIGT’s market cap per year up to £50m and 0.65% per year above £50m. The management fee is allocated 50:50 to capital and income. In FY17, ongoing charges were 1.61%, broadly in line with 1.60% in the prior financial year.
Dividend policy and record
The board aims to grow aggregate annual dividends at least in line with UK inflation. It pays quarterly interim dividends in September, December, March and June. Since the dividend was rebased in January 2012, the interim dividend has been the same for the first three quarters of the financial year, with an increase in the fourth interim dividend serving as an indicator of the quarterly dividends to be paid in the following year.
In FY17, the annual dividend was 6.14p, which was a 3.5% increase versus the prior financial year. This was the fourth year where the uplift was higher than the UK inflation rate; over this period the dividend has compounded at an annual rate of 4.0%. The FY17 annual dividend was c 1.1x covered by revenue. Based on the recently declared first interim dividend of 1.58p, barring unforeseen circumstances, the FY18 annual dividend should be at least 6.32p. This represents a prospective dividend yield of 3.5%.
Peer group comparison
SIGT was a member of the AIC Global Equity Income sector until 1 January 2017, but is now classified in the AIC Flexible Investment sector to better reflect its focus on both income and capital growth rather than just income.
Exhibit 9: AIC Flexible Income sector at 24 October 2017*
% unless stated |
Market cap £m |
NAV TR |
NAV TR |
NAV TR |
Discount (ex-par) |
Ongoing charge |
Net gearing |
Dividend yield (%) |
Seneca Global Inc & Growth Trust |
77.9 |
15.4 |
42.8 |
73.7 |
2.1 |
1.6 |
105 |
3.5 |
Aberdeen Diversified Inc & Growth |
390.8 |
8.1 |
8.7 |
27.2 |
(9.3) |
0.6 |
110 |
4.4 |
Capital Gearing |
203.1 |
5.4 |
25.5 |
34.4 |
2.4 |
0.9 |
100 |
0.5 |
Establishment Investment Trust |
44.2 |
8.7 |
35.8 |
39.9 |
(17.3) |
1.2 |
100 |
2.6 |
Henderson Alternative Strategies |
112.7 |
11.1 |
26.6 |
28.9 |
(15.2) |
1.0 |
100 |
1.6 |
Invesco Perp Select Balanced |
9.3 |
5.2 |
18.0 |
28.2 |
(3.3) |
1.2 |
100 |
0.0 |
Miton Global Opportunities |
71.1 |
21.1 |
62.6 |
89.4 |
1.3 |
1.3 |
106 |
0.0 |
New Star Investment Trust |
74.6 |
8.3 |
45.8 |
50.9 |
(31.2) |
0.9 |
100 |
0.8 |
Personal Assets |
862.7 |
3.8 |
24.6 |
25.7 |
1.1 |
1.0 |
100 |
1.4 |
RIT Capital Partners |
3,034.4 |
6.8 |
39.4 |
69.7 |
6.9 |
1.1 |
105 |
0.0 |
Ruffer Investment Company |
395.3 |
2.0 |
18.3 |
28.5 |
1.6 |
1.2 |
100 |
0.8 |
Syncona |
1,235.4 |
22.9 |
50.9 |
|
18.3 |
1.5 |
100 |
1.2 |
Tetragon Financial |
946.9 |
(4.0) |
60.0 |
101.1 |
(35.3) |
1.8 |
100 |
5.3 |
Average |
573.7 |
8.8 |
35.3 |
49.8 |
(6.0) |
1.2 |
102 |
1.7 |
SIGT rank in sector (13 funds) |
9 |
3 |
5 |
3 |
4 |
2 |
3 |
3 |
Source: Morningstar, Edison Investment Research. Note: *Performance at 23 October 2017. TR=total return. Net gearing is total assets less cash and equivalents as a percentage of net assets.
While it is interesting to compare SIGT with its peers, it should be noted that the trusts in the sector have different investment mandates. SIGT’s NAV total returns are ahead of the peer group averages over all periods shown, ranking third and fifth out of 13 funds over one and three years respectively and third out of 12 funds over five years (23.9pp higher than average). SIML also highlights that SIGT’s returns have been achieved with lower annualised volatility than the peer group average. It is one of seven trusts trading at a premium, in a sector where there is a wide range of discounts. SIGT has the second highest ongoing charge, the third highest level of gearing, and among the highest dividend yield, which is 1.8pp above the peer group average.
The board
SIGT has three directors on its board; all are non-executive and independent of the investment manager. Richard Ramsay was appointed in April 2013 and assumed the role of chairman in September 2013; he has a background in investment banking. Ian Davis has been chairman of the audit committee since December 2004, having been appointed as a director the previous month; he has a background in corporate finance. James McCulloch was appointed in January 2015; he has a background in private client investment and portfolio management.
Glossary
CPI
The Consumer Price Index, which is a measure of UK inflation.
Discount control mechanism
A discount control mechanism (DCM) will usually involve a trust buying back its own shares in the market and either cancelling them or holding them in treasury to be reissued when demand is stronger.
Gearing
Investment companies frequently employ a moderate level of borrowing to buy additional investments to increase returns when they appreciate. The risk is that gearing magnifies losses if the investments fall in value.
Libor
The London Interbank Offered Rate is a reference interest rate widely used in financial markets as a basis for lending rates or an indication of the return available on cash.
Multi-asset fund
Multi-asset funds have a mandate to invest across different asset classes such as equities, fixed income, property and other specialist areas. The fund manager will vary exposures according to market conditions, seeking to optimise the balance of risk and reward.
OECD
The Organisation for Economic Co-operation and Development. It is a group of 35 member countries that discuss and develop economic and social policy.
Ongoing charge
This is a measure of the regular, recurring costs of running an investment company expressed as a percentage of the NAV.
P/E ratio
A price-to-earnings ratio, which is a valuation measure of a company’s share price relative to its annual net income per share.
Premium/discount to net asset value (NAV)
The net asset value of a company, including an investment company, is the value of its assets less liabilities. Depending on a range of factors, including the market’s assessment of the prospects for a company or appetite for yield, its shares may trade at a price above the NAV, at a premium, or at a discount.
Strategic asset allocation
Strategic asset allocation can be thought of as the broad allocation to each asset class that would be expected to achieve the investment performance objective over time. For example, a simple multi-asset fund might have a strategic asset allocation of 60% global equities and 40% global bonds. Given an understanding of how global equities and global bonds would be expected to behave over the longer term, one would have an understanding of how the fund should behave over the longer term as a result of exposure to bonds and equities in the proportions mentioned.
Tactical asset allocation
Tactical asset allocation is generally used in conjunction with strategic asset allocation. Tactical asset allocation refers to decisions to deviate from time to time from strategic asset allocation. Using the example cited, this might mean a decision to have only 50% in equities rather than the strategic allocation of 60% because one might have a slightly negative view on the outlook for equities.
Typical investment cycle
A typical investment cycle is defined as one in which various asset classes produce total real returns over the entire cycle that are broadly in line with their historic long-term average real returns.
Volatility
This is a term used to describe the frequency and severity with which the price of an investment goes up and down.
Yield (income)
The amount of income you receive in monetary terms will be equivalent to the dividend per share multiplied by the number of shares you own. This is usually expressed annually as a percentage based on the investment’s market value.
|
|
Investment Companies
Research: Industrials
Solid State’s H118 pre-close trading statement notes an estimated 12% increase in group revenues to £22.5m during the period, demonstrating that management is driving organic growth to complement its successful acquisition programme. Consensus sales estimates have been raised but as some of the high margin antenna programmes have taken longer to secure than management expected, profit estimates have been reduced.