Last close As at 05/08/2026
—
— 0.00 (0.00%)
Market capitalisation
—
Research: Industrials
China Water Affairs (CWA) delivered a CAGR of 24.7% in top-line growth and a CAGR of 23.4% in EBITDA in FY12-17. We expect its growth story to continue with volume/price increases in the Chinese market and the opportunity to acquire underperforming assets from local governments. We forecast revenue to increase 25% in FY18 and 20% in FY19 (vs consensus of 19% and 14%, respectively), on the back of a 50% increase in capex in FY17 under service concession contracts. Its net debt of HK$6.2bn and net debt to equity ratio of 70% are at a historical high. The management of capex spending and the pace of acquisitions will be a delicate balancing act against the level of leverage. We reduce our fair value by 6% from HK$7.12/share to HK$6.71/share based on sum-of-parts EV/EBITDA valuation as we lower our revenue forecasts for FY18 and FY19 by 6% and 7%, respectively (given CWA’s reported FY17 sales were 9% below our previous estimates).
Written by
China Water Affairs Group |
Growth story continues |
Outlook for FY18e |
Utilities |
13 September 2017 |
Share price performance
Business description
Next events
Analysts
China Water Affairs Group is a research client of Edison Investment Research Limited |
|||||||||||||||||||||||||||||||||||||||||||||||
China Water Affairs (CWA) delivered a CAGR of 24.7% in top-line growth and a CAGR of 23.4% in EBITDA in FY12-17. We expect its growth story to continue with volume/price increases in the Chinese market and the opportunity to acquire underperforming assets from local governments. We forecast revenue to increase 25% in FY18 and 20% in FY19 (vs consensus of 19% and 14%, respectively), on the back of a 50% increase in capex in FY17 under service concession contracts. Its net debt of HK$6.2bn and net debt to equity ratio of 70% are at a historical high. The management of capex spending and the pace of acquisitions will be a delicate balancing act against the level of leverage. We reduce our fair value by 6% from HK$7.12/share to HK$6.71/share based on sum-of-parts EV/EBITDA valuation as we lower our revenue forecasts for FY18 and FY19 by 6% and 7%, respectively (given CWA’s reported FY17 sales were 9% below our previous estimates).
Year end |
Revenue (HK$m) |
PBT* |
EPS* |
DPS |
P/E |
Yield |
03/16** |
4,740 |
1,505 |
40 |
8.0 |
11.9 |
1.7 |
03/17 |
5,708 |
1,963 |
55 |
20.0 |
8.7 |
4.2 |
03/18e |
7,103 |
2,159 |
60 |
12.5 |
8.0 |
2.6 |
03/19e |
8,526 |
2,536 |
70 |
15.0 |
6.8 |
3.1 |
Note: *PBT and EPS are normalised, excluding amortisation of acquired intangibles, exceptional items and share-based payments. **FY16 financials have been restated.
FY17: Growth and profitability on track
CWA posted 20% growth in revenue and 34% growth in EBITDA in FY17. Operating cash flows increased by 25% y-o-y to HK$1,454m. Meanwhile, capex increased 50% to HK$1,910m, mainly on water supply capacity expansion under service concession agreements as the sole water supplier in different regions. Net debt increased by 48% to HK$6.2bn, bringing CWA’s net debt to equity ratio from 50% in FY16 to 70% in FY17, a level comparable to HK-listed peers.
Acquisitions: Acceleration on the cards
CWA took a breather from asset purchases, with cash outflows for acquisitions down from HK$972m in FY16 to HK$286m in FY17. As the central government is pushing local governments to improve the efficiency of existing infrastructure, CWA intends to speed up acquisitions in central, eastern and southern China.
Valuation: Growth not priced in
We derive our fair value with a sum-of-parts EV/EBITDA valuation and lower our fair value by 6% from HK$7.12/share to HK$6.71/share (primarily as a result of our 6% and 7% downward revision of FY18e and FY19e revenue forecasts, respectively). Our net debt calculations are based on management’s guidance regarding the likely recovery of HK$860m loan to China City Infrastructure Group in FY18e and combined capex and acquisitions at c HK$2bn over the next three years.
Investment summary
Company description: Pioneer in water asset privatisation
CWA, a mid-sized private water company, is a pioneer in the privatisation of water supply assets in China (the so-called TOO model: transfer, own and operate). Currently, the company has extensive and exclusive water supply coverage in over 50 cities (mostly Tier 3/4) in 13 provinces, connecting to 2.9 million users. CWA is a constituent of the FTSE Environmental Opportunities Asia Pacific Index and is included in Shenzhen-Hong Kong Stock Connect.
Financials: Increased capex for future growth
CWA posted 20% top-line growth in FY17 (vs restated revenue for FY16), driven by a 24% increase in its water supply segment (85% of the total revenue) and 67% growth in its sewage treatment segment (contributing 9% of the total revenue).
With acquisitions slowing down from HK$972m in FY16 to HK$286m in FY17, the company upped its capex by 50% to HK$1,910m to maintain its growth engine. Net debt increased by 48% to HK$6.2bn, bringing its net debt to equity ratio from 50% in FY16 to 70% in FY17.
The financial restatement regarding the reclassification of property, plant and equipment to intangible assets in FY17 aims to bring the reporting of concession rights in line with Hong Kong-listed peers to facilitate like-for-like comparisons. Previously, the assets operating under the TOO model were recognised as property, plant and equipment. Under the new accounting policy, these assets are recognised as intangible assets (concession rights).
Exhibit 1: Change in estimates
Year end 31 March |
Revenue (HK$m) |
PBT (HK$m) |
EBITDA (HK$m) |
||||||
Old |
New |
% chg. |
Old |
New |
% chg. |
Old |
New |
% chg. |
|
FY18e |
7,535 |
7,103 |
(5.7%) |
2,168 |
2,159 |
(0.0%) |
2,796 |
2,831 |
(1.3%) |
FY19e |
9,114 |
8,526 |
(6.5%) |
2,700 |
2,536 |
(6.1%) |
3,425 |
3,283 |
(4.1%) |
FY20e |
10,542 |
9,976 |
(5.4%) |
3,128 |
2,935 |
(5.1%) |
3,973 |
3,767 |
(5.2%) |
Source: Edison Investment Research
Valuation: EV/EBITDA multiples
We lower our fair value by 6% from HK$7.12/share to HK$6.71/share based on a sum-of-parts EV/EBITDA multiple. We think the sum-of-parts EV/EBITDA multiple can best reflect the immediate impact of our reduced revenue and hence EBITDA forecast and incorporate management’s guidance on capex/acquisitions and likely net debt positions. We lower our revenue forecasts for FY18 and FY19 by 6% and 7%, respectively, as CWA’s reported FY17 sales were 9% below our prior estimates. CWA exited FY17 with net debt of HK$6.2bn, almost 30% higher than our prior forecast, as a result of 50% higher capex and an HK$860m loan to China City Infrastructure Group (currently 7.3% owned by CWA). We derive the fair value of HK$6.71/share based on 7.0x EV/EBITDA multiples for its water business, at a discount of approximately 50% to HK-listed peers, plus 1.3x FY17 book value of its property development and other segments. We assume minorities increase 12.7% from HK$3.35bn to HK$3.77bn as CWA continues to make acquisitions. We model its net debt to decrease by 5% from HK$6.23bn to HK$5.90bn from FY17 to FY18e based on management’s guidance of approximately HK$2bn capex and acquisitions (vs HK$2.2bn in FY17) and likely recovery of the HK$860m loan to China City Infrastructure Group.
Sensitivities: Policy and competition
Investors in CWA should take heed of the following risk factors.
■
Political issues: While it is the Chinese central government’s intention to deleverage local governments with public-private partnerships, the effectiveness of this policy remains to be seen. This may affect the size of the addressable market for CWA.
■
Competitive issues: CWA’s cash outflows for acquisitions in FY17 declined from FY16 by 70% due to increased competition in the secondary market for water infrastructure.
■
Leverage issues: CWA may continue to take advantage of its competitive funding costs and increase its net debt in absolute terms.
Company description: In pursuit of organic and inorganic growth
CWA is a listed company in Hong Kong offering pure equity exposure to tap water supply in China (with 87% of FY17 revenue from city water supply operation and construction). The company is a pioneer in the privatisation of water supply assets in China.
Opportunity: Under penetration of tap water outside cities
According to the National Statistics Bureau of the PRC, 98% of the city population was covered by the tap water supply network by the end of 2015. However, only 451 million people had access to tap water in 2015, slightly over 30% of the country’s entire population. In summary, tap water is under-penetrated especially in Tier 3/4 cities. CWA believes that these cities offer an attractive combination of growth potential and a lighter regulatory burden.
Business model: Asset privatisation as value driver
Management estimates that private enterprises account for only 20% of the water supply industry, and believes that the opportunity for privatisation remains significant. CWA prefers to have total control of its water networks, tariff negotiations and capital budgeting (the TOO model: transfer, own and operate). CWA seeks to acquire water networks at book value from often loss-making local governments, and create value with operational improvements and tariff negotiations. The basis for tariff determination is an ROE range of 8-12%, according to CWA. As a general rule, management hopes to make acquired assets accretive to earnings within two to three years.
Management: Experience and connections
Before founding Silver Dragon Group, the predecessor of CWA, in the 1990s, Chairman Duan Chuan Liang worked for the Ministry of Water Resources of the PRC for more than 10 years. The combination of his political connections and entrepreneurial approach was critical to the growth of the company, especially in the early days.
Shareholder returns: Low funding cost plus capital discipline
CWA indicates that its funding cost is approximately 2-3% offshore and 5-10% below benchmark borrowing rates onshore. Management seeks to create value for shareholders with a combination of competitive borrowing costs and, hopefully, a disciplined approach to capital deployment. For instance, CWA prioritises the project opportunities where it has existing customer service networks, to mitigate counterparty risks as a result of heavy leverage of local governments.
Business segment and operations
The majority of CWA’s water supply capacity is located in Tier 3/4 cities, under 30- to 50-year exclusive and renewable concession rights. It currently has daily capacity of 6.7m m3 for tap water. On top of its vertically integrated capabilities from raw water processing, tap water supply and sewage treatments, CWA is seeking to enter industrial wastewater treatment by targeting enterprise customers with specific technological requirements (evidenced by its long-term contract with China National Offshore Oil Corporation).
|
Exhibit 2: CWA’s geographic footprint |
|
|
Source: China Water Affairs Group data |
Water supply: Volume and pricing growth
City water supply business is bread and butter for CWA, accounting for approximately 85% of the firm’s revenue.
|
Exhibit 3: Revenue by segment in percentage terms |
Exhibit 4: Revenue by segment in absolute terms |
|
|
|
Source: China Water Affairs Group data |
|
Exhibit 3: Revenue by segment in percentage terms |
|
|
Source: China Water Affairs Group data |
|
Exhibit 4: Revenue by segment in absolute terms |
|
|
Source: China Water Affairs Group data |
The volume of city water supply in China grew from 60bn tonnes in 2010 to 66.8bn tonnes in 2015, at a CAGR of 2.2% according to the data from the Ministry of Housing and Urban-Rural Development. Frost & Sullivan forecasts a CAGR of 2.2% for 2016-20e for the market to increase to 74.4bn tonnes by 2020.
|
Exhibit 5: City water supply in China |
Exhibit 6: Retail/industrial water prices in China |
|
|
|
Source: Ministry of Housing and Urban-Rural Development |
|
Exhibit 5: City water supply in China |
|
|
Source: Ministry of Housing and Urban-Rural Development |
|
Exhibit 6: Retail/industrial water prices in China |
|
|
Source: Ministry of Housing and Urban-Rural Development |
Sewage treatment: Expanding market size
CWA entered the sewage water treatment market in 2012. This segment reports a CAGR of 82% in FY13-17 in terms of top-line growth from a small base.
|
Exhibit 7: Water supply revenue and EBITDA margin date |
Exhibit 8: Sewage treatment revenue and EBIDTA margin |
|
|
|
Source: China Water Affairs Group data |
|
Exhibit 7: Water supply revenue and EBITDA margin date |
|
|
Source: China Water Affairs Group data |
|
Exhibit 8: Sewage treatment revenue and EBIDTA margin |
|
|
Source: China Water Affairs Group data |
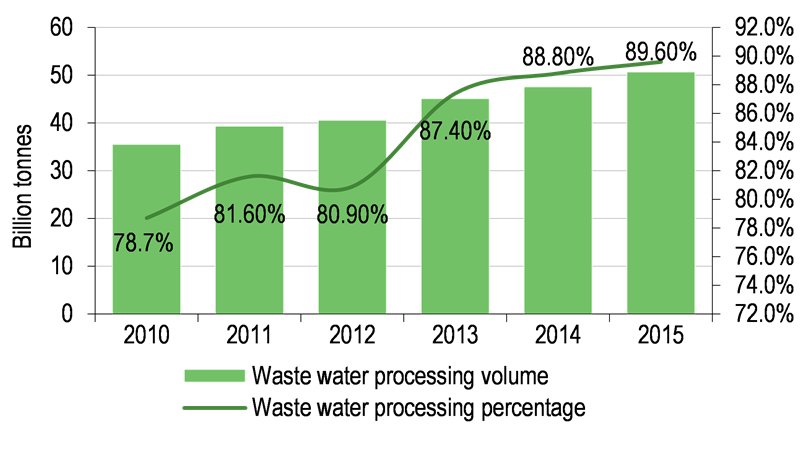
The city sewage treatment market has been growing in size rapidly in China since the 1980s, with the city sewage treatment volume up from 35.5bn tonnes in 2010 to 50.7bn tonnes in 2015. The residential waste water processing fee went up from RMB0.76 per tonne in 2010 to RMB0.85 per tonne in 2015, and the industrial waste water processing fee increased from RMB1.08 per tonne to RMB1.16 per tonne during the same period.
|
Exhibit 9: Waste water treatment market in China |
Exhibit 10: Waste water processing fees in China |
|
|
|
Source: Ministry of Housing and Urban-Rural Development |
|
Exhibit 9: Waste water treatment market in China |
|
|
Source: Ministry of Housing and Urban-Rural Development |
|
Exhibit 10: Waste water processing fees in China |
|
|
Source: Ministry of Housing and Urban-Rural Development |
As CWA does not disclose outputs, utilisation or average selling prices, we forecast its revenue based on the Chinese water market growth (in terms of volume and price), CWA’s current capacity and plans to continue with a similar rate of capex and acquisition. We forecast CWA’s water supply segment to grow 30% in FY18e and 22% in FY19e (vs the CAGR of 30% in FY13-17). We assume only 5% growth for the sewage business as the TOO model (ie asset acquisition) is generally not applicable. We also factor in potential valuation gains and profit realisation of CWA’s property development business, reported in ‘other’ segments. We are conservative about the profitability of the water supply segment in the mid-term as we think the competition in the secondary market may eventually increase acquisition costs for CWA (vs the acquisitions at book value in the past).
Exhibit 11: Segment revenue and EBITDA
HK$m |
2013 |
2014 |
2015 |
2016 |
2017 |
2018e |
2019e |
2020e |
CAGR |
Revenue |
|||||||||
Water supply |
1,734 |
1,875 |
2,244 |
4,003 |
4,874 |
6,347 |
7,733 |
9,143 |
27% |
Sewage treatment |
51 |
82 |
170 |
339 |
531 |
581 |
610 |
640 |
44% |
Others |
466 |
789 |
444 |
397 |
303 |
175 |
184 |
193 |
-12% |
Total |
2,251 |
2,747 |
2,859 |
4,740 |
5,708 |
7,103 |
8,526 |
9,976 |
24% |
EBITDA |
|
|
|
|
|
|
|
|
|
Water supply |
615 |
731 |
941 |
1,468 |
1,847 |
2,106 |
2,494 |
2,909 |
25% |
Sewage treatment |
21 |
31 |
56 |
184 |
208 |
215 |
226 |
237 |
41% |
Others |
212 |
125 |
153 |
105 |
289 |
227 |
235 |
245 |
2% |
Total |
848 |
887 |
1,150 |
1,757 |
2,343 |
2,548 |
2,955 |
3,391 |
22% |
EBITDA margin |
|
|
|
|
|
|
|
|
|
Water supply |
35% |
39% |
42% |
37% |
37% |
33% |
32% |
32% |
|
Sewage treatment |
42% |
38% |
33% |
54% |
38% |
37% |
37% |
37% |
|
Others |
45% |
16% |
34% |
26% |
173% |
130% |
128% |
127% |
|
Total |
38% |
32% |
40% |
37% |
41% |
36% |
35% |
34% |
|
Source: China Water Affairs Group data; Edison Investment Research. Note: segment-aggregated EBITDA is lower than firm-level EBITDA.
Growth, capex and acquisitions: A balancing act
We model CWA’s revenue to grow 25% in FY18 and 20% in FY19 (vs consensus of 19% and 14%, respectively) and operating margins to be 34% in FY18 and 33% in FY19 (vs 40% in FY17), after stripping out the HK$185m non-cash valuation gain in H117 and factoring in an increase in amortisation of concession rights due to higher capex in FY17. Management guides its FY18e revenue should increase by 20-30% year-on-year. In the absence of CWA’s disclosure on outputs and average selling prices, our assumptions for its revenue growth are based on the following:
■
a 2.2% CAGR in the volume of city water supply and a CAGR 2-3% in the price of residential and industrial water tariffs in 2011-2015 in China;
■
a 7.5% increase in end-of-year nameplate capacity of water supply from 6.23m cubic metres in FY16 to 6.7m cubic metres in FY17; and
■
a 50% increase in capex in FY17 under service concession contracts.
|
Exhibit 12: Revenue and EBITDA growth |
Exhibit 13: Capex and acquisitions |
|
|
|
Source: China Water Affairs Group data; Edison Investment Research |
|
Exhibit 12: Revenue and EBITDA growth |
|
|
Source: China Water Affairs Group data; Edison Investment Research |
|
Exhibit 13: Capex and acquisitions |
|
|
Source: China Water Affairs Group data; Edison Investment Research |
We view CWA’s acquisitions and capital expenditures as an integrated vehicle for growth. In FY14 and FY15, the company’s capex was close to HK$800m pa and acquisition cash outflows totalled HK$165m and HK$95m, respectively. The combined cash outflows for capex and acquisitions more than doubled in FY16/17 from the FY14/15 level. Understandably, the net debt to equity ratio also went up, from 57% in FY14 to 78% in FY17. CWA’s effective interest rate for borrowing also increased from 3.5% to 4.8% during this period, although its funding cost remains competitive in the industry.
Management
Executive Chairman Mr Duan Chuan Liang: After working for the Ministry of Water Resources of the PRC for more than 10 years, Mr Duan founded Silver Dragon Group in the 1990s, the predecessor of China Water Affairs. He is also the chairman and non-executive director of China City Infrastructure Group (2349.HK). He has a bachelor’s degree in water conservation and hydro power from the North China College.
Executive Director Ms Ding Bin: Ms Ding Bin has over 10 years of experience in financial management and tax planning. She graduated from Zhengzhou University of Technology in finance and computer management and is a certified public accountant in the PRC.
Executive Director Ms Liu Yu Jie: Ms Liu Yu Jie started her career in investment banking and progressed to corporate management roles. Prior to CWA, she was an executive director of Shanghai Industrial Investment (Holdings) Co and sat on the board of several environmental and resource management companies. She graduated from the University of International Business and Economics with a master’s degree in business administration.
Executive Director Mr Li Zhong: Mr Li Zhong is a member of the Standing Committee of the Shenzhen Municipal Committee of the Chinese People’s Political Consultative Conference. For more than 20 years, he has served in large state-owned enterprises and US-based corporations. He graduated from Saint Mary’s University of Canada with a master’s degree in business administration.
Sensitivities
Investors in CWA should be mindful of the following risk factors:
■
Political issues: While it is the Chinese central government’s intention to deleverage local governments with the PPP (public-private partnership) scheme, the effectiveness of this policy remains to be seen. This may affect the size of the addressable market for CWA’s acquisitions, but it is difficult to gauge the net effects of various moving parts in the policy landscape.
For instance, local governments are required to steer away from hiding debts via guaranteed purchases, because PPP projects are capped at 10% of the annual budgets for local governments and project development process is long and tedious. This could open up more opportunities for CWA, if more local governments are forced to divest loss-making assets in order to free up their balance sheets.
■
Competitive issues: CWA’s cash outflows for acquisitions in FY17 declined from FY16 by 70% due to increased competition in the secondary market for water infrastructure.
■
Technical issues: There are currently outstanding options for 10-20m shares according to management in September 2017, after most of the 110.7m options issued on 3 October 2014 (when the share price was HK$3.4) and 8m issued on 9 September 2015 (when the share price was around HK$3.4) have been exercised from April 2017.
Exhibit 14: Outstanding options granted to directors and employees up to end March 2017
Option holder |
No. of options |
Data of grant |
Exercise price |
Expiration |
Chairman Mr Duan Chuan Liang |
68,000,000 |
3 October 2014 |
HK$3.6 |
3 October 2017 |
Ms Ding Bin |
5,000,000 |
3 October 2014 |
HK$3.5 |
3 October 2017 |
Ms Liu Yu Jie |
3,000,000 |
3 October 2014 |
HK$3.5 |
3 October 2017 |
Mr Li Zhong |
8,000,000 |
9 September 2015 |
HK$3.5 |
9 September 2018 |
Mr Zhao Hai Hu |
2,500,000 |
3 October 2014 |
HK$3.5 |
3 October 2017 |
Ms Wang Xiaoqin |
2,000,000 |
3 October 2014 |
HK$3.5 |
3 October 2017 |
Mr Zhou Wen Zhi |
1,000,000 |
3 October 2014 |
HK$3.5 |
3 October 2017 |
Employees in aggregate |
29,200,000 |
3 October 2014 |
HK$3.5 |
3 October 2017 |
TOTAL |
118,700,000 |
Source: China Water Affairs Group data
■
Balance sheet issues: CWA may lever up its balance sheet to take advantage of its competitive funding costs. While high leverage is not uncommon in this sector, borrowing costs may eventually go up.
Valuation
We lower our fair value by 6% from HK$7.12/share to HK$6.71/share based on a sum-of-the-parts EV/EBITDA multiple, as we think this method can reflect the immediate impact of our reduced revenue forecast and the likely net debt positions based on guidance. We lower our revenue forecasts for FY18 and FY19 by 6% and 7%, respectively, as CWA’s reported FY17 sales were 9% below our prior estimates. CWA exited FY17 with net debt of HK$6.2bn, almost 30% higher than our prior forecast, as a result of 50% higher capex and an HK$860m loan to China City Infrastructure Group (currently 7.3% owned by CWA). We derive the fair value of HK$6.71/share based on 7.0x EV/EBITDA multiples for its water business, at a discount of approximately 50% to HK-listed peers, plus 1.3x FY17 book value of its property development and other segments. We assume minorities increase 12.7% from HK$3.35bn to HK$3.77bn as CWA continues to make acquisitions and the original shareholders of the acquired assets typically retain 30-40% of the stakes. We model its net debt to decrease by 5% from HK$6.23bn to HK$5.90bn from FY17 to FY18e based on management’s guidance of approximately HK$2bn capex and acquisitions (vs HK$2.2bn in FY17e) and likely recovery of the HK$860m loan to China City Infrastructure Group.
Exhibit 15: EV/EBITDA and book value SOTP valuation
Sum of the parts |
||||||||
Current price (HK$) |
4.77 |
|
|
|
|
|||
Fair value per share (HK$) |
6.71 |
|
||||||
Upside/(downside) to FV |
40.6% |
|
||||||
Dividend yield (FY18e) |
2.6% |
|
||||||
Total return |
43.2% |
|
||||||
Current number of shares (m) |
1,609 |
|
||||||
Segment |
Valuation method |
HK$m |
Multiple |
Implied value, HK$m |
HK$/share |
|||
City water supply operation and construction |
FY18e EBITDA multiple |
2,106 |
7.0 |
14,744 |
9.16 |
|||
Sewage treatment operation and construction |
FY18e EBITDA multiple |
215 |
7.0 |
1,504 |
0.93 |
|||
Property development and other segments |
FY17 BV multiple |
3,244 |
1.3 |
4,217 |
2.62 |
|||
GROUP ENTERPRISE VALUE |
|
|
20,465 |
12.72 |
||||
Less: FY18e net debt |
|
|
5,901 |
3.67 |
||||
Less: FY18e minorities |
|
|
3,773 |
2.35 |
||||
SOTP VALUATION for Equity |
|
|
|
10,550 |
6.71 |
|||
Source: China Water Affairs Group data; Edison Investment Research
Exhibit 16: Peer comparison
Company |
Ticker |
Market cap (local) |
Dividend yield FY1 (%) |
P/E FY1 |
P/E FY2 |
P/E FY3 |
EV/EBITDA FY1 (x) |
EV/EBITDA FY2 (x) |
EV/EBITDA FY3 (x) |
|
China Water Affairs |
855:HK |
7.7bn |
2.6 |
8.0 |
6.8 |
5.9 |
4.9 |
4.2 |
3.7 |
|
Guangdong Investment |
270:HK |
73.0bn |
4.3 |
14.6 |
14.8 |
14.1 |
9.3 |
9.2 |
8.7 |
|
Beijing Enterprises Water |
371:HK |
55.5bn |
2.4 |
13.6 |
10.9 |
9.2 |
14.2 |
11.9 |
10.2 |
|
Tianjin Capital |
1065:HK |
24.7bn |
1.6 |
12.4 |
11.7 |
18.0 |
17.0 |
|||
Average HK-listed |
|
2.8 |
13.5 |
12.5 |
11.7 |
13.8 |
12.7 |
9.5 |
||
Beijing Capital |
600008 CH |
33.3bn |
1.4 |
45.8 |
40.2 |
34.2 |
21.9 |
19.9 |
19.2 |
|
Beijing Originwater Tech |
300070 CH |
58.9n |
0.5 |
22.9 |
17.7 |
13.9 |
18.8 |
14.0 |
10.8 |
|
Chongqing Water Group |
601158 CH |
33.6bn |
4.4 |
20.1 |
20.6 |
20.0 |
14.8 |
14.3 |
||
Average mainland China |
|
2.1 |
29.6 |
26.0 |
22.7 |
18.5 |
16.1 |
15.0 |
||
Veolia Environment |
VIE FP |
11.3bn |
4.1 |
19.5 |
16.6 |
15.1 |
6.4 |
6.1 |
5.8 |
|
Suez Environment |
SEV FP |
10.4bn |
4.0 |
23.4 |
17.6 |
15.9 |
6.8 |
6.2 |
5.9 |
|
United Utilities |
UU/ LN |
6.1bn |
4.3 |
19.6 |
17.3 |
16.1 |
13.0 |
12.3 |
11.9 |
|
Average Europe |
|
4.1 |
20.8 |
17.2 |
15.7 |
8.7 |
8.2 |
7.9 |
||
Source: Bloomberg; Edison Investment Research. Note: prices at 12 September 2017. CWA forecasts based on Edison Investment Research estimates, and EV/EBITDA based on net debt exiting FY17, to be consistent with Bloomberg’s calculation.
Shareholder value: Low funding cost plus capital discipline
Management seeks to create value for shareholders with a combination of competitive borrowing costs and a disciplined approach to capital deployment.
Low borrowing cost
CWA indicates that its funding cost is approximately 2-3% offshore (outside China) and 5-10% below benchmark rates onshore (in China). In January 2017, the company issued a US$300m five-year senior note at face value and a coupon rate of 5.25% due in 2022.
Compared to Beijing Enterprises Water Group (371.HK), a Beijing government-owned water utility focusing on sewage water treatment, and Luzhou Xinglu Water (2281.HK), a Sichuan-based regional water company with a business model similar to CWA, CWA’s effective interest rates for bank loans look competitive. Among the three companies, Luzhou Xinglu Water is the least levered, but its borrowing cost is the highest, possibly due to a smaller scale. Luzhou Xinglu Water also prefers to have ownership of water supply assets. It is currently serving 0.26 million users vs 2.9 million users covered by CWA’s networks.
|
Exhibit 17: Effective borrowing cost |
Exhibit 18: Net debt to equity ratios |
|
|
|
Source: China Water Affairs Group data; Edison Investment Research. Note: CWA FY17 (ending in March) compared to Beijing Enterprise Water Group’s and Luzhou Xinglu’s FY16 (ending in December 2016). |
|
Exhibit 17: Effective borrowing cost |
|
|
Source: China Water Affairs Group data; Edison Investment Research. Note: CWA FY17 (ending in March) compared to Beijing Enterprise Water Group’s and Luzhou Xinglu’s FY16 (ending in December 2016). |
|
Exhibit 18: Net debt to equity ratios |
|
|
Source: China Water Affairs Group data; Edison Investment Research. Note: CWA FY17 (ending in March) compared to Beijing Enterprise Water Group’s and Luzhou Xinglu’s FY16 (ending in December 2016). |
Capital discipline
It is worth noting that CWA holds the view that the quality of the currently available PPP projects in China is not consistent. While it is the intention of the central government to encourage local municipals to use JV/hybrid ownership structures in order to deleverage their own balance sheets and improve the operating efficiency of existing assets, the majority of PPP projects in water and sewage on the market are for new infrastructure, and the repayments primarily come from local governments. CWA indicates that it prioritises on the opportunities where it has existing customer care networks, to mitigate counterparty risks.
Shareholder value
Economic value added (EVA) spread, the delta between WACC (weighted cost of capital) and ROIC (return on invested capital) is a good metric for shareholder value. We think CWA’s competitive borrowing cost is a key contributor to its low WACC. Even compared to state-owned enterprises such as Beijing Enterprises Water Group (43.6% owned by Beijing Enterprises, essentially the Beijing city government), CWA’s borrowing cost looks competitive. We believe this is the result of CWA’s quality assets and stable cash flows. On the other hand, CWA’s cost discipline seems to pay off, reflected in a higher ROIC compared to Beijing Enterprises Water Group.
Exhibit 19: WACC, ROIC and EVA spread
Company |
Ticker |
WACC |
ROIC |
EVA spread |
Comment |
China Water Affairs |
855.HK |
5.08% |
7.87% |
2.79% |
85% revenue from water supply, with ownership of operating assets |
Beijing Enterprises Water Group |
371.HK |
6.61% |
6.71% |
0.10% |
Focusing on sewage treatment; significant exposure to Beijing and Guangdong |
Guangdong Investment |
270.HK |
7.52% |
9.10% |
1.58% |
Conglomerate with water and other infrastructure assets in Guangdong |
Tianjin Capital |
1065.HK |
9.31% |
6.43% |
(2.89%) |
50% owned by Tianjin City Government; focusing on waste water treatment |
China Water Industry |
1129.HK |
7.23% |
2.30% |
(4.93%) |
20% revenue in water supply; 8% in sewage treatment; 50% in construction service; 22% in biogas power generation |
Source: Bloomberg; Edison Investment Research
Financials: Earnings quality intact, but risk increases with higher gearing
We lower our revenue forecasts for FY18 and FY19 by 6% and 7%, respectively, as CWA’s reported FY17 sales were 9% below our prior estimates. We also revise EBITDA downward for FY18 and FY19 by 1% and 4%, respectively. We assume a certain degree of operating leverage.
Exhibit 20: Edison earnings versus consensus
HK$m |
2018e |
2019e |
2020e |
Edison revenues |
7,103 |
8,256 |
9,976 |
Bloomberg revenues |
6,796 |
7,781 |
9,058 |
± Edison vs consensus |
4.6% |
6.1% |
10.1% |
Edison EBITDA |
2,831 |
3,283 |
3,767 |
Bloomberg EBITDA |
2,539 |
2,980 |
3,335 |
± Edison vs consensus |
11.5% |
10.2% |
13.0% |
Edison EBIT |
2,418 |
2,828 |
3,267 |
Bloomberg EBIT |
2,292 |
2,732 |
3,121 |
± Edison vs consensus |
4.1% |
3.5% |
4.7% |
Edison net debt |
5,901 |
6,052 |
5,976 |
Bloomberg net debt |
6,148 |
6,022 |
6,163 |
± Edison vs consensus |
(4.0%) |
0.0% |
(3.0%) |
Source: Edison Investment Research, Bloomberg data (7 September 2017).
The quality of its earnings in FY17 is comparable to FY16, both with net operating cash flows as approximately 25% of revenues (vs 9% in FY15). CWA generated net operating cash flows of HK$1.45bn, 25% up year-over-year.
However, CWA’s net debt and leverage are at a historical high, with a net debt up 48% to HK$6.23bn in FY17 as a result of a 50% increase in capex to HK$1,910m and the HK$860m loan to China City Infrastructure Group (currently 7.3% owned by CWA). So far, the short-term debts remain at 30% or lower of the total interest-bearing debts.
|
Exhibit 21: Net debt and net debt to equity ratio |
Exhibit 22: Short-term and long-term debt breakdown |
|
|
|
Source: China Water Affairs Group data |
|
Exhibit 21: Net debt and net debt to equity ratio |
|
|
Source: China Water Affairs Group data |
|
Exhibit 22: Short-term and long-term debt breakdown |
|
|
Source: China Water Affairs Group data |
A major change in CWA’s financial reporting in FY17 is the reclassification of the water supply infrastructure under the TOO model from property, plant and equipment to other intangible assets. Management indicates that this restatement is to bring its reporting in line with peers in Hong Kong, as recommended by its new auditor PwC, to facilitate like-for-like comparisons. This restatement has no retroactive impact on operating expenses or operating cash flows.
Revenue: Non-cash HK$700m increase in restated FY16 top line
In FY17, CWA restated its financials for FY15 and FY16 to bring its accounting policy in line with peers regarding the revenue and asset recognition of concession agreements. This restatement has no retroactive impact on operating expenses or operating cash flows.
On the income statement, a major change is a non-cash HK$700m increase in FY16 revenue, as a result of estimates on a cost-plus basis for construction services (vs percentage of costs incurred to date and a gross margin assumption). CWA believes that the gross margin assumption used for its estimates at 10.7% is lower than the 20% typically seen among its peers. Management also thinks that the non-cash HK$700m increase in FY16 revenue is evidence of its prior conservative revenue recognition policy.
Exhibit 23: Segment reporting FY16 before and after restatement
HK$m |
Previous |
Restated |
Water supply connection income |
1,179 |
797 |
Water supply construction services (intangible assets) |
589 |
1,496 |
Water supply operation services |
1,447 |
1,447 |
Sewage treatment and drainage operation services |
279 |
279 |
Sewage treatment construction services (financial + intangible assets) |
39 |
39 |
Sales of goods |
354 |
354 |
Others |
146 |
145 |
Total revenue |
4,033 |
4,740 |
Source: China Water Affairs Group accounts; Edison Investment Research
Balance sheet: PPE reclassified into intangible assets
The water supply infrastructure previously classified as property, plant and equipment is now reclassified to intangible assets, as the amount to be received from end-users is uncertain. These intangible assets are amortised on a straight-line basis over the terms of remaining service concession periods.
Management indicates that its previous accounting policy should in theory result in a lower EBIT number (all else being equal) because depreciation of fixed assets is typically over 10-15 years (vs amortisation of intangible assets under concession contracts typically over 25-30 years of the contract period).
Exhibit 24: Key change in cash flows and balance sheet due to restatement
HK$m |
Before restatement |
After restatement |
||
Year end 31 March |
2015 |
2016 |
2015 |
2016 |
Property, plant & equipment |
5,995 |
6,716 |
618 |
590 |
Other intangibles |
176 |
764 |
6,526 |
8,041 |
Receivables from concession agreements |
N/A |
N/A |
349 |
541 |
Depreciation of fixed assets |
282 |
324 |
N/A |
45 |
Amortisation of intangible assets |
9 |
9 |
N/A |
227 |
Cash flows from investing activities |
||||
Purchase of property, plant & equipment |
(781) |
(670) |
N/A |
(67) |
Increase in concession rights for water supply and sewage processing |
(6) |
(601) |
N/A |
(1,206) |
Source: China Water Affairs Group accounts; Edison Investment Research
Exhibit 25: Financial summary
HKDm |
2016 |
2017 |
2018e |
2019e |
2020e |
||
31-March |
HKFRS |
HKFRS |
HKFRS |
HKFRS |
HKFRS |
||
PROFIT & LOSS |
|||||||
Water supply revenue |
3,922 |
4,874 |
6,347 |
7,733 |
9,143 |
||
Sewage treatment |
318 |
531 |
581 |
610 |
640 |
||
Other segments |
500 |
303 |
175 |
184 |
193 |
||
Revenue TOTAL |
|
|
4,740 |
5,708 |
7,103 |
8,526 |
9,976 |
EBITDA |
|
|
1,951 |
2,647 |
2,831 |
3,283 |
3,767 |
Operating Profit |
|
|
1,647 |
2,271 |
2,418 |
2,828 |
3,267 |
Amortization |
241 |
316 |
348 |
382 |
421 |
||
Depreciation |
63 |
60 |
66 |
73 |
80 |
||
Net Interest expense |
(171) |
(251) |
(289) |
(332) |
(382) |
||
Profit Before Tax |
|
|
1,505 |
1,963 |
2,159 |
2,536 |
2,935 |
Tax |
(305) |
(583) |
(604) |
(710) |
(822) |
||
Profit After Tax |
1,200 |
1,379 |
1,554 |
1,826 |
2,113 |
||
Net profits contributable to shareholders |
749 |
854 |
964 |
1,132 |
1,310 |
||
Average Number of Shares Outstanding (m) |
1,508.5 |
1,541.2 |
1,609.0 |
1,609.0 |
1,609.0 |
||
EPS - normalised and fully diluted (c) |
|
40.1 |
55.4 |
59.9 |
70.4 |
81.4 |
|
Dividend per share (c) |
8.0 |
20.0 |
12.5 |
15.0 |
17.5 |
||
Water supply revenue growth (%) |
78.4 |
23.9 |
27.9 |
21.8 |
18.2 |
||
Sewage treatment revenue growth (%) |
99.5 |
63.1 |
5.0 |
5.0 |
5.0 |
||
EBITDA Margin (%) |
41.2 |
46.4 |
39.9 |
38.5 |
37.8 |
||
Operating Margin (%) |
34.7 |
39.8 |
34.0 |
33.2 |
32.7 |
||
BALANCE SHEET |
|||||||
Fixed Assets |
|
|
13,005 |
15,689 |
16,735 |
17,838 |
19,042 |
Intangible Assets |
8,041 |
9,630 |
10,682 |
11,742 |
12,807 |
||
Plant, property and equipment |
590 |
1,127 |
1,171 |
1,231 |
1,310 |
||
Investment properties |
908 |
1,173 |
1,056 |
845 |
676 |
||
Investment in associates |
1,334 |
635 |
826 |
991 |
1,189 |
||
Other |
2,132 |
3,124 |
3,000 |
3,030 |
3,060 |
||
Current Assets |
|
|
6,966 |
9,942 |
9,949 |
10,060 |
10,408 |
Properties Under Development |
|
|
524 |
690 |
621 |
559 |
503 |
Properties Held for Sale |
|
|
273 |
289 |
290 |
290 |
290 |
Inventory |
|
|
289 |
285 |
299 |
314 |
330 |
Trade and Bills Receivables |
|
|
1,084 |
872 |
1,046 |
1,151 |
1,266 |
Due from Non-controlling Equity Holders of Subsidiaries |
308 |
251 |
264 |
269 |
274 |
||
Due from Associates |
|
|
403 |
409 |
400 |
400 |
400 |
Prepayments, Deposits and Other Receivables |
970 |
1,743 |
1,300 |
1,500 |
1,700 |
||
Pledged Deposits |
|
|
467 |
783 |
783 |
783 |
783 |
Deposits and cash |
2,552 |
4,314 |
4,645 |
4,494 |
4,562 |
||
Other |
98 |
306 |
300 |
300 |
300 |
||
Current Liabilities |
|
|
5,557 |
7,393 |
7,017 |
6,884 |
6,772 |
Trade and Bills Payables |
|
|
855 |
1,097 |
1,119 |
1,175 |
1,234 |
Accrued Liabilities, Deposits and Other Payables |
1,782 |
2,102 |
1,892 |
1,703 |
1,532 |
||
Short-term Borrowings |
2,156 |
3,206 |
3,206 |
3,206 |
3,206 |
||
Other |
764 |
988 |
800 |
800 |
800 |
||
Long Term Liabilities |
|
|
5,967 |
9,275 |
9,962 |
10,286 |
10,790 |
Long-term Borrowings |
5,076 |
8,123 |
8,123 |
8,123 |
8,123 |
||
Other long term liabilities |
891 |
1,152 |
1,839 |
2,163 |
2,667 |
||
Shareholders' Equity |
|
|
8,446 |
8,963 |
9,705 |
10,729 |
11,888 |
1 |
- |
- |
- |
- |
|||
CASH FLOW |
|||||||
Net Cash Flows from Operating Activities |
1,163 |
1,454 |
1,776 |
2,132 |
2,494 |
||
Purchase of property, plant and equipment |
(67) |
(92) |
(110) |
(132) |
(159) |
||
Increase in concession rights for water supply and sewage processing |
(1,206) |
(1,818) |
(1,400) |
(1,442) |
(1,485) |
||
Acquisitions/disposals |
(972) |
(286) |
(572) |
(601) |
(631) |
||
Increase in prepayements and other receivables |
0 |
(1,226) |
0 |
0 |
0 |
||
Repayment of HK$860m loan from China City Infrastructure Group |
860 |
0 |
0 |
||||
Others |
578 |
(120) |
0 |
0 |
0 |
||
Net Cash Flows from Investing Activities |
(1,667) |
(3,542) |
(1,222) |
(2,175) |
(2,275) |
||
Net Cash Flows before Financing Activities |
(504) |
(2,088) |
553 |
(43) |
219 |
||
Dividends |
(106) |
(136) |
(302) |
(193) |
(241) |
||
Shares issue and/or options exercised |
149 |
84 |
80 |
85 |
90 |
||
Net Cash Flow |
(673) |
(2,019) |
331 |
(151) |
68 |
||
Opening net debt (CWA definition) |
|
3,541 |
4,213 |
6,232 |
5,901 |
6,052 |
|
Closing net debt/(cash) |
|
|
4,213 |
6,232 |
5,901 |
6,052 |
5,984 |
Net debt to equity ratio (CWA definition) |
|
50% |
70% |
61% |
56% |
50% |
|
Source: China Water Affairs Group data; Edison Investment Research.
|
|||||||||||||||||||||||||||||||||||||||||||||||||
|
|
Critical to the development of any opaquely traded commodity project is establishing an end-customer network. To this end, Triton Minerals (TON) has forged a number of pre-commercial agreements covering up to 80% of the output from its future Ancuabe graphite mine in Mozambique. This note highlights these memorandums of understanding (MoUs), as well as some background to the companies with which the MoUs were signed. We also consider the effect of mining higher grades for longer from the company’s T16 deposit – a key future catalyst to our valuation.