The group has started 2017 well with two significant contracts – a highly prospective one for driver behaviour in NY for ride firms such as Uber and Lyft, followed by a pilot programme for driver safety and distribution costs savings with FEMSA (Coca-Cola’s largest public bottler). A strong performance in these contracts bodes well for future earnings. Pointer has also announced better than expected 2016 operating results, helped by margin-boosting operational leverage, and acquisition of Cielo Telecom in Q4. Management has also issued guidance for over 10% revenue and 20% EBITDA growth this year, which accords with our increased earnings expectations. Helped by this, we have revised our share valuation, which is based on peer multiples, from $8.85 (NIS 33.9) to $10.8 (NIS39.6). This is supported by our DCF valuation of $14.9 (NIS 54.7) per share.
Written by
Pointer Telocation |
Good figures and yet another impressive deal |
Full year 2016 results |
Tech hardware & equipment |
16 March 2017 |
Share price performance
Business description
Next events
Analysts
|
||||||||||||||||||||||||||||||||||||||||||||||||||||
The group has started 2017 well with two significant contracts – a highly prospective one for driver behaviour in NY for ride firms such as Uber and Lyft, followed by a pilot programme for driver safety and distribution costs savings with FEMSA (Coca-Cola’s largest public bottler). A strong performance in these contracts bodes well for future earnings. Pointer has also announced better than expected 2016 operating results, helped by margin-boosting operational leverage, and acquisition of Cielo Telecom in Q4. Management has also issued guidance for over 10% revenue and 20% EBITDA growth this year, which accords with our increased earnings expectations. Helped by this, we have revised our share valuation, which is based on peer multiples, from $8.85 (NIS 33.9) to $10.8 (NIS39.6). This is supported by our DCF valuation of $14.9 (NIS 54.7) per share.
Year |
Revenue ($m) |
PBT* |
EPS* |
DPS |
EV/EBITDA |
P/E |
Yield |
12/15 |
60.6 |
6.3 |
62.3 |
0.0 |
10.0 |
15.3 |
N/A |
12/16 |
64.4 |
6.6 |
62.4 |
0.0 |
8.6 |
15.3 |
N/A |
12/17e |
71.9 |
8.4 |
78.4 |
0.0 |
7.1 |
12.2 |
N/A |
12/18e |
78.1 |
10.6 |
97.6 |
0.0 |
5.8 |
9.8 |
N/A |
Note: *PBT and EPS are normalised, excluding amortisation of acquired intangibles, exceptional items and share-based payments.
Management bullish on EBITDA growth
Following a better than expected performance in 2016 subscriber numbers, ARPU and gross margin, boosted by PNTR’s much vaunted strong operating gearing, we have revised our 2017 and 2018 earnings forecasts increasing MRM subscriber growth forecasts by c 300bp to 13% and 14% this year and adding c100bp to our gross margins expectations . This revision has brought our 2017 revenue growth to 12% and EBITDA gains to 22%, in line with management guidance for 10% top line growth and c 20% EBITDA growth.
Coca-Cola FEMSA pilot another prestigious win
Pointer’s recent contract wins in the passenger driver market in the US (see our note Taking a ride with Uber, 29 January 2017) and the more recently announced pilot contract from Coca-Cola’s largest bottler show the extent to which Pointer’s technical abilities are now competitive against other global players.
Valuation
Pointer shares have rallied strongly over the last three months gaining 27%, helped by the announcement of the Coca-Cola FEMSA deal and now strong Q4 results. Despite this, the shares remain at a 28% forward discount to peers in the telematics sector. With a positive growth outlook for the next 12-24 months we see the potential for re-rating and target a 10-20% discount to the sector, giving rise to our target valuation range of $10.8 (NIS39.6), up from a previous $8.85 (NIS33.9). We note that a key valuation sensitivity is the potential for further dollar strength against the currencies of Pointer’s key markets, particularly if the Fed increases rates. Such strength would have a negative impact on Pointer’s dollar-denominated earnings.
Coca-Cola FEMSA pilot
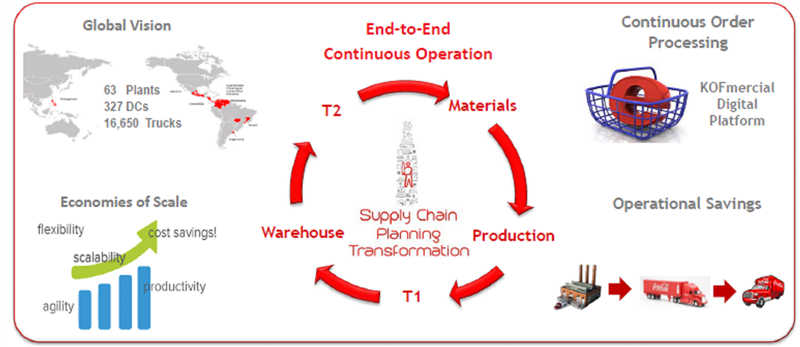
Pointer’s Mexican subsidiary has been selected to provide fleet management services to the world’s largest franchise bottler, Coca-Cola FEMSA. Coca-Cola FEMSA operates in four territories of Latin America, containing countries including Mexico, Brazil, Costa Rica, Columbia and Argentina, and the Philippines. It had as of November 2016 a combined fleet of 16,650 trucks, serving 63 plants and 327 distribution centres. Pointer has revealed that its Mexican operation has already worked with the group’s centre of excellence in Mexico to develop telematics tools, which were instrumental in the awarding of the pilot. Developments included:
■
Driver safety tools, for use in vehicle fleet management – with the aim of reducing the frequency of collisions while reducing fuel and maintenance costs, and
■
Improvements in the distribution process, with a focus on creating a smoother delivery process and boosting customer satisfaction, and allowing customers to track orders.
The pilot contract will see Pointer’s install its telematics tools in selected vehicles in Mexico. Pointer has not been allowed to reveal how many vehicles will be included in the pilot, but if successful we believe that it is reasonable to expect that it will be rolled out across the whole group. We also understand that the combination of services provided means that Pointer expects the contract to have above-average average revenue per user (ARPU). In a geographical context, it is also worth noting that Pointer’s operations in Mexico, Brazil and Argentina also place it in a good position to understand the requirements of Coca-Cola FEMSA in its key markets, as well as to provide it with a good level of local support.
|
Exhibit 1: Coca-Cola FEMSA supply chain transformation plan |
|
|
Source: Coca-Cola FEMSA Excellence in Innovation presentation, November 2016 |
We see the potential for Pointer’s pilot programme to add c $0.3m to 2017 revenues. The Mexican operation of Coca-Cola FEMSA was responsible in its own right for 55.5% of group beverage shipments by volume in 2016. We would expect it to operate with above-average truck sizes but think it reasonable that its fleet could number at least 7,500 vehicles (45% of the total). If the pilot is run over 20% of the fleet, this would represent 1,500 MRM subscriptions. Helped by the advanced nature of the telematics services, Pointer management expects the contract to generate above-average ARPU, so we see the potential for the pilot to boost 2017 revenues by $330k or 0.5%. This is based on average monthly revenues per subscription of $18.5 (a 5% premium to the 2016 level). It is worth noting on this ARPU basis, inclusion of the full fleet of 16,650 trucks would add $3.7m, or 7.5% of the 2016 total, to Pointer’s revenues.
2016 results update
Boosted by the Cielo acquisition, Pointer’s Q4 service grew 22% y-o-y (4% more than we expected) to $11.6m, reflecting both a strong performance in local currencies (+27%) and reduced currency weakness of c 4% during the quarter compared with an average of 11% for each of the previous three quarters. The key underlying growth driver was a 24k increase in MRM subscribers to 222k, which comprised 16k additions arising from the acquisition of the Brazilian truck telematics specialist Cielo Telecom and 8k organic additions. The latter was 33% more than the 6k we had forecast and that the group achieved on average over the previous four quarters. Average revenue per MRM user (ARPU) fell from $18.0 in Q3 to $17.5 in Q4 (Q415: $17.8), but was in line with our forecast for the quarter, reflecting ongoing currency weakness and dilution from new subscribers.
Product revenues grew by only 3.4% y-o-y under the ongoing pressure of cheap imports, but the group increased its margins on products by 250 basis points helped by its focus on higher-quality products.
Helped by stronger growth and the group’s strong operating leverage, the gross margin rose 170bp over Q3 to 50.9%. This again was substantially higher than the 48.8% that we had estimated, reflecting our concerns that potentially low margins in Cielo’s business (lacking any clear guidance on this issue) could have a negative impact on the group total. As such, the result was a positive indicator for future earnings and margin prospects as the group starts to consolidate Cielo Telecom’s earnings for the whole of 2017 after just one quarter in 2016.
Helped by lower selling costs, the EBITDA margin hit 15.6% after an average of 14.2% across the first three quarters.
Putting these results into context for FY16, the 15% increase in weighted average MRM subscribers during the year generated a 13% increase in local currency service revenues after taking a 2% decline in local currency ARPUs into account. With currency weakness in Pointer’s markets easing significantly as the year progressed, the group was able to generate an 8.5% increase in dollar-based service revenues.
The action of operating leverage on revenue growth helped the group to achieve a gross margin increase of 190 basis points during 2016 to 49.4%. This resulted in a 9% increase in gross profit to $31.8m, versus our expectation of $31.1m. This fed down into a 120 basis points increase in EBITDA margin to 14.6%, reflecting the share of revenues taken with sales and R&D rising 90 basis points and 20 basis points to 18.2% and 5.8%, respectively, while the share taken up by G&A fell 130 basis points to 14.0%, showing the benefit of the expanded use of the group’s SaaS platform.
Operating profit rose 35% to $6.25m, but was affected by $ 0.4m in charges relating to acquisitions, which being double our expectation led to the group slightly undershooting our operating profit target of $6.33m.
Tax expenses continued to be boosted in the fourth quarter by high ongoing non-cash taxes from the start of 2016, reflecting principally the write-down in the value of prior year tax losses caused by a reduction in the corporate tax rate in Israel. We have adjusted the normalised earnings based on a marginal 25% tax rate, which gives rise to a Q4 normalised net profit of $1.41m after $1.07m in Q316. For the full year the normalised net profit of $4.93m was below the 2015 level of $5.02m, but this resulted principally from a low effective tax rate of 21% in 2015.
Exhibit 2: Pointer Telocation 2016 earnings summary
$m |
2015 |
2016e |
2016 |
Q415 |
Q116 |
Q216 |
Q316 |
Q416 |
Products |
22.27 |
22.76 |
22.78 |
5.64 |
5.51 |
6.05 |
5.39 |
5.84 |
Change (%) |
(19.9) |
2.2 |
2.3 |
0.0 |
(4.8) |
5.1 |
6.0 |
3.4 |
Services |
38.30 |
40.98 |
41.57 |
9.46 |
9.32 |
10.17 |
10.52 |
11.56 |
Change (%) |
(0.4) |
7.0 |
8.5 |
N/A |
(3.2) |
4.4 |
11.1 |
22.2 |
Service revenues, change local currency (%) |
0.0 |
17.6 |
13.0 |
N/A |
7.0 |
20.0 |
18.0 |
27.0 |
Revenue |
60.57 |
63.74 |
64.35 |
15.10 |
14.83 |
16.21 |
15.92 |
17.40 |
Change (%) |
(8.6) |
5.2 |
6.3 |
N/A |
(3.8) |
4.7 |
9.3 |
15.2 |
Change, local currency (%) |
N/A |
15.0 |
15.4 |
N/A |
14.0 |
15.0 |
14.0 |
18.0 |
Cost of Products |
(13.44) |
(14.14) |
(13.90) |
(3.35) |
(3.40) |
(3.78) |
(3.30) |
(3.43) |
Gross profit Products |
8.8 |
8.6 |
8.9 |
2.3 |
2.1 |
2.3 |
2.1 |
2.4 |
Gross margin products (%) |
39.7 |
37.9 |
39.0 |
40.6 |
38.3 |
37.5 |
38.8 |
41.3 |
Cost of Services |
(17.88) |
(18.50) |
(18.67) |
(4.26) |
(4.07) |
(4.70) |
(4.79) |
(5.11) |
Gross profit Services |
20.4 |
22.5 |
22.9 |
5.2 |
5.2 |
5.5 |
5.7 |
6.5 |
Gross margin services (%) |
53.3 |
54.9 |
55.1 |
54.9 |
56.3 |
53.7 |
54.5 |
55.8 |
Cost of Sales |
(31.31) |
(32.64) |
(32.58) |
(7.62) |
(7.47) |
(8.48) |
(8.09) |
(8.53) |
Gross profit |
29.25 |
31.10 |
31.78 |
7.49 |
7.36 |
7.73 |
7.83 |
8.86 |
Gross margin (%) |
48.3 |
48.8 |
49.4 |
49.6 |
49.6 |
47.7 |
49.2 |
50.9 |
Research and development |
(3.41) |
(3.63) |
(3.67) |
(0.88) |
(0.91) |
(0.92) |
(0.87) |
(0.98) |
% of sales |
5.6 |
5.8 |
5.8 |
5.8 |
6.1 |
5.7 |
5.5 |
5.6 |
Selling and marketing |
(10.47) |
(11.81) |
(11.77) |
(2.99) |
(2.65) |
(2.97) |
(3.10) |
(3.06) |
% of sales |
17.3 |
18.2 |
18.2 |
19.8 |
17.9 |
18.3 |
19.5 |
17.6 |
General and administrative |
(9.28) |
(8.53) |
(9.00) |
(2.69) |
(2.13) |
(2.09) |
(2.15) |
(2.63) |
% of sales |
15.3 |
13.4 |
14.0 |
17.8 |
14.4 |
12.9 |
13.5 |
15.1 |
EBITDA (continuing operations) |
8.10 |
9.26 |
9.38 |
2.04 |
2.16 |
2.27 |
2.23 |
2.72 |
EBITDA margin |
13.4% |
14.5% |
14.6% |
13.5% |
14.6% |
14.0% |
14.0% |
15.6% |
Operating profit normalised |
6.40 |
7.44 |
7.65 |
1.00 |
1.73 |
1.79 |
1.82 |
2.31 |
Operating margin normalised |
10.6% |
11.7% |
11.9% |
6.6% |
11.7% |
11.0% |
11.4% |
13.3% |
One-off items |
0.00 |
(0.40) |
(0.61) |
0.00 |
0.00 |
0.00 |
(0.20) |
(0.41) |
Operating profit |
4.64 |
6.33 |
6.25 |
0.05 |
1.58 |
1.65 |
1.40 |
1.62 |
Operating margin (%) |
7.67 |
9.93 |
9.71 |
0.31 |
10.67 |
10.15 |
8.80 |
9.32 |
Net finance costs |
(0.06) |
(1.03) |
(1.05) |
(0.13) |
0.08 |
(0.32) |
(0.38) |
(0.42) |
Other expenses |
(0.01) |
(0.01) |
(0.01) |
0.00 |
0.01 |
(0.00) |
(0.01) |
(0.01) |
PBT normalised |
6.32 |
6.40 |
6.59 |
0.87 |
1.82 |
1.46 |
1.43 |
1.88 |
PBT |
4.57 |
5.30 |
5.19 |
(0.08) |
1.67 |
1.32 |
1.01 |
1.19 |
Reported tax |
(1.31) |
(1.48) |
(1.85) |
(0.35) |
(0.58) |
(0.28) |
(0.30) |
(0.69) |
Profit after tax reported |
3.80 |
3.98 |
3.50 |
(0.06) |
1.41 |
0.88 |
0.71 |
0.50 |
Minority interests (continuing operations) |
0.00 |
(0.02) |
(0.02) |
0.00 |
(0.00) |
(0.01) |
(0.00) |
(0.00) |
Profit after tax normalised |
5.02 |
4.91* |
4.93 |
0.52 |
1.36 |
1.09 |
1.07 |
1.41 |
EPS - basic ($) |
0.50 |
0.50 |
0.44 |
(0.01) |
0.18 |
0.11 |
0.09 |
0.06 |
EPS - diluted ($) |
0.49 |
0.49 |
0.43 |
(0.01) |
0.17 |
0.11 |
0.09 |
0.06 |
EPS - basic normalised ($) |
0.64 |
0.63 |
0.63 |
0.07 |
0.18 |
0.14 |
0.14 |
0.18 |
EPS - diluted normalised ($) |
0.62 |
0.62 |
0.62 |
0.07 |
0.17 |
0.14 |
0.13 |
0.18 |
Ratios |
||||||||
MRM subscribers |
180,000 |
220,000 |
222,000 |
180,000 |
185,000 |
192,000 |
198,000 |
222,000 |
Avg. service rev. per MRM subscriber ($/mth) |
18.6 |
17.4 |
17.6 |
17.8 |
17.0 |
18.0 |
18.0 |
17.5 |
Operating cash flows |
8.80 |
8.93 |
10.21 |
N/A |
1.52 |
3.44 |
1.43 |
2.55 |
Cash conversion (operating CF to op.profit, %) |
1.63 |
1.41 |
1.63 |
N/A |
0.96 |
2.09 |
1.02 |
1.57 |
Cash flows from investment |
(2.35) |
(11.95) |
(12.80) |
N/A |
(1.10) |
(1.28) |
(0.69) |
(8.88) |
Purchases of property, plant and equipment |
(3.62) |
(4.15) |
(4.08) |
N/A |
(1.58) |
(1.28) |
(0.72) |
(0.57) |
Cash & cash equivalents |
7.25 |
3.80 |
6.07 |
N/A |
N/A |
7.75 |
14.07 |
6.07 |
Net debt ($m) |
5.95 |
10.94 |
8.95 |
N/A |
N/A |
3.17 |
2.23 |
8.95 |
Net debt (cash)/Equity (%) |
10.82 |
25.12 |
20.97 |
N/A |
N/A |
7.64 |
5.17 |
20.97 |
Current ratio |
1.14 |
1.28 |
1.37 |
N/A |
N/A |
1.51 |
1.90 |
1.37 |
Quick ratio |
0.98 |
1.02 |
1.07 |
N/A |
N/A |
1.25 |
1.62 |
1.07 |
Source: Pointer Telocation accounts, Edison Investment Research. Note: *Would be $5.35m applying the 25% tax normalisation method applied in this note to the 2016 results.
Forecast review
Exhibit 3: Pointer Telocation forecast revisions
$m |
2015 |
2016e |
2016 |
% chg. |
2017e (old) |
2017e (new) |
% chg |
2018e (old) |
2018e (new) |
% chg |
MRM subscribers ('000) |
180.0 |
220 |
222 |
0.9 |
244 |
251 |
2.7 |
271 |
286 |
5.4 |
MRM ARPU ($/month) |
18.6 |
17.4 |
17.6 |
0.9 |
16.8 |
16.9 |
0.4 |
16.6 |
16.7 |
0.4 |
Revenue |
60.6 |
63.7 |
64.4 |
1.0 |
70.8 |
71.9 |
1.6 |
75.7 |
78.1 |
3.1 |
Revenue growth (%) |
(8.6) |
5.2 |
6.3 |
N/A |
11.1 |
11.7 |
N/A |
6.9 |
8.5 |
N/A |
Gross profit |
29.3 |
31.1 |
31.8 |
2.2 |
34.7 |
35.9 |
3.4 |
37.5 |
39.5 |
5.4 |
Gross margin (%) |
48.3 |
48.8 |
49.4 |
N/A |
49.0 |
49.9 |
N/A |
49.5 |
50.6 |
N/A |
Research and development |
(3.4) |
(3.6) |
(3.7) |
1.0 |
(3.8) |
(4.1) |
8.1 |
(3.8) |
(4.2) |
8.1 |
Selling and marketing |
(10.5) |
(11.8) |
(11.8) |
(0.3) |
(12.9) |
(12.8) |
(0.4) |
(13.7) |
(13.9) |
1.1 |
General and administrative |
(9.3) |
(8.5) |
(9.0) |
5.6 |
(9.7) |
(10.1) |
3.8 |
(10.2) |
(10.6) |
3.8 |
Non-cash adjustments/other |
2.0 |
2.1 |
2.1 |
(3.8) |
2.4 |
2.6 |
9.1 |
2.9 |
3.1 |
6.5 |
EBITDA |
8.1 |
9.3 |
9.4 |
1.4 |
10.7 |
11.5 |
7.1 |
12.6 |
14.0 |
10.9 |
EBITDA growth (%) |
(3.1) |
14.3 |
15.9 |
N/A |
16.0 |
22.5 |
N/A |
17.6 |
21.7 |
N/A |
EBITDA margin (%) |
13.4 |
14.5 |
14.6 |
N/A |
15.2 |
16.0 |
N/A |
16.7 |
17.9 |
N/A |
Operating profit normalised |
6.4 |
7.4 |
7.6 |
2.7 |
8.7 |
9.2 |
6.3 |
10.0 |
11.2 |
11.8 |
Operating profit reported |
4.6 |
6.3 |
6.2 |
(1.3) |
8.0 |
8.7 |
8.5 |
9.4 |
10.7 |
13.9 |
Op. margin normalised (%) |
10.6 |
11.7 |
11.9 |
N/A |
12.3 |
12.8 |
N/A |
13.2 |
14.4 |
N/A |
Finance costs |
(0.1) |
(1.0) |
(1.0) |
1.6 |
(0.8) |
(0.8) |
(0.0) |
(0.6) |
(0.6) |
(0.3) |
Profit before tax normalised |
6.3 |
6.4 |
6.6 |
2.9 |
7.9 |
8.4 |
6.9 |
9.4 |
10.6 |
12.6 |
Profit before tax reported |
4.6 |
5.3 |
5.2 |
(2.0) |
7.2 |
7.9 |
9.5 |
8.8 |
10.1 |
14.9 |
EPS - diluted normalised ($) |
0.62 |
0.62 |
0.62 |
0.77 |
0.74 |
0.78 |
6.1 |
0.87 |
0.98 |
11.8 |
EPS - basic reported ($) |
0.49 |
0.51 |
0.45 |
(12.0) |
0.68 |
0.74 |
9.4 |
0.82 |
0.94 |
14.8 |
Source: Pointer Telocation accounts, Edison Investment Research
We have increased our 2017 and 2018 EBITDA forecasts by 7% and 11%, respectively, to reflect:
■
An increase in our forecast of net MRM subscriber additions from 22k to 29k in 2017 and from 27k to 35k in 2018. Incorporating the 2k higher than expected subscriber base at the end of Q416 has led to 2.7% and 5.4% increases in our YE17 and YE18 forecast subscriber bases, respectively. The 2017 forecast is boosted by the assumed addition of 1,500 subscriptions for the Coca-Cola FEMSA (CCF) pilot, representing 20% of our estimate of the CCF fleet in Mexico (see discussion of pilot project above). In 2018 we have assumed an additional 6,000 subscribers in Mexico from the roll-out to the full estimated Mexican fleet. This leaves further upside assuming that the system is rolled out across the entire CCF fleet of more than 16k.
■
A 0.4% increase in ARPUs for 2017 and 2018 to $16.9 and $16.7 per month, respectively, reflecting the expected positive impact of inclusion of Coca-Cola FEMSA.
■
A 90bp widening in the gross margin in 2017 to 49.9%, following the better than expected gross margin performance in Q4 in the face of uncertainty about the impact of the Cielo Telecom acquisition.
■
An 8% increase in our R&D cost forecast for 2017 based on the expectation that the Coca-Cola FEMSA pilot will give rise to increased R&D outlays (but not capex). We understand that this R&D will mainly be targeted at IoT solutions and web services.
These revisions bring the forecasts broadly into line with management’s 2017 guidance of double-digit top line growth and an approximate 20% increase in EBITDA.
Valuation
We have increased our multiple-based valuation from $8.85 (NIS33.9) to $10.8 (NIS39.6) per share, reflecting the increases to our EBITDA and EPS forecasts, as well as increases in sector multiples since our last update. We continue to target a 10-20% discount to the sector based on the average of the sector P/E ratio and EV/EBITDA multiples for the current and next forecast years.
Our DCF share value has increased from $11.3 (NIS43.7) to $14.9 (NIS54.7) per share, reflecting our increased earnings expectations (see Exhibit 5). We have left our WACC and terminal value assumptions unchanged.
Exhibit 4: Pointer Telocation peer valuation table
$m |
Main focus |
Share price (lc) |
Market cap ($m) |
Current sales (e) |
EBITDA margin this yr (e) |
Current EV/S (e) |
Next EV/S |
Current EV/ EBITDA (x) |
Next EV/ EBITDA (x) |
Current P/E (x) |
Next P/E (x) |
Last div yield |
Net debt (cash)/ equity |
Pointer Telocation |
Isr, Latam, SA |
$9.55 |
74 |
72 |
16.0% |
1.1 |
1.0 |
7.1 |
5.8 |
12.2 |
9.8 |
0.0% |
21.0% |
CalAmp Corp |
NAM |
16.5 |
585 |
351 |
14.0% |
1.4 |
1.4 |
10.1 |
8.8 |
15.7 |
13.6 |
0.0% |
-15.1% |
ID Systems Inc |
NAM |
6.1 |
83 |
42 |
1.3% |
1.9 |
1.4 |
142.1 |
15.7 |
69.8 |
12.3 |
0.0% |
-5.7% |
Ituran Location and Control Ltd |
Isr, Brzl, Arg |
28.6 |
670 |
216 |
N/A |
3.0 |
2.8 |
N/A |
N/A |
16.4 |
14.5 |
0.0% |
-4.3% |
MiX Telematics Ltd |
SA |
6.7 |
161 |
115 |
18.8% |
0.8 |
0.8 |
4.4 |
3.9 |
13.7 |
11.7 |
1.1% |
-41.0% |
Numerex Corp |
NAM |
5.1 |
99 |
71 |
5.3% |
1.4 |
1.3 |
27.0 |
10.0 |
neg. |
45.9 |
0.0% |
3.1% |
ORBCOMM Inc |
US/Europe |
8.8 |
631 |
214 |
25.9% |
3.5 |
3.3 |
13.6 |
11.9 |
neg. |
420.5 |
0.0% |
19.7% |
Sierra Wireless Inc |
NAM |
28.6 |
910 |
661 |
7.5% |
1.3 |
1.2 |
17.3 |
14.7 |
34.4 |
27.8 |
0.0% |
-5.5% |
Trakm8 Holdings PLC |
UK |
75.0 |
30 |
33 |
9.1% |
0.9 |
0.8 |
10.4 |
5.4 |
26.8 |
10.1 |
2.7% |
4.5% |
QUALCOMM Inc |
NAM |
56.5 |
83,379 |
23,927 |
38.3% |
2.6 |
2.5 |
6.8 |
6.5 |
12.1 |
11.7 |
3.7% |
-24.7% |
Quartix Holdings PLC |
UK |
400.0 |
232 |
28 |
29.6% |
8.1 |
7.6 |
27.4 |
23.9 |
34.2 |
30.1 |
1.3% |
-1.6% |
Median |
232 |
115 |
15.0% |
1.4 |
1.4 |
12.0 |
9.4 |
16.4 |
13.6 |
0.0% |
-4.3% |
||
Median - MCAP<$300m |
113 |
88 |
12.5% |
1.3 |
1.2 |
18.7 |
7.9 |
26.8 |
12.0 |
0.5% |
0.8% |
||
Median Ituran/MiX Telematics |
416 |
166 |
N/A |
1.9 |
1.8 |
N/A |
N/A |
15.1 |
13.1 |
0.5% |
-22.7% |
||
Source: Edison Investment Research, Bloomberg. Note: Prices as at 7 March 2017.
Exhibit 5: DCF valuation
$m |
2016 |
2017e |
2018e |
2019e |
2020e |
2021e |
2022e |
2023e |
2024e |
2025e |
2026e norm. |
|||||||||
Revenue |
64.4 |
71.9 |
78.1 |
82.9 |
85.9 |
88.6 |
91.6 |
94.4 |
97.2 |
100.2 |
102.7 |
|||||||||
change y-o-y (%) |
6.3 |
11.7 |
8.5 |
6.2 |
3.6 |
3.2 |
3.3 |
3.0 |
3.0 |
3.1 |
2.5 |
|||||||||
EBITDA |
9.4 |
11.5 |
14.0 |
15.8 |
16.8 |
17.9 |
18.9 |
19.6 |
20.2 |
20.8 |
21.3 |
|||||||||
EBITDA margin (%) |
14.6 |
16.0 |
17.9 |
19.1 |
19.6 |
20.2 |
20.6 |
20.7 |
20.7 |
20.7 |
20.7 |
|||||||||
change y-o-y (%) |
15.9 |
22.5 |
21.7 |
13.0 |
6.3 |
6.3 |
5.6 |
3.5 |
3.2 |
2.9 |
2.5 |
|||||||||
Change in working capital |
0.7 |
(0.3) |
(0.3) |
(0.2) |
(0.1) |
(0.1) |
(0.1) |
(0.1) |
(0.1) |
(0.1) |
(0.1) |
|||||||||
Working capital/sales (%) |
1.1 |
(0.5) |
(0.4) |
(0.3) |
(0.2) |
(0.1) |
(0.1) |
(0.1) |
(0.1) |
(0.1) |
(0.1) |
|||||||||
Capex, net of PPE sales |
(3.0) |
(4.0) |
(4.4) |
(4.8) |
(5.0) |
(5.2) |
(5.4) |
(5.6) |
(5.8) |
(6.0) |
(6.2) |
|||||||||
Capex/sales (%) |
(4.6) |
(5.5) |
(5.6) |
(5.7) |
(5.8) |
(5.8) |
(5.9) |
(5.9) |
(5.9) |
(6.0) |
(6.0) |
|||||||||
Tax |
(0.1) |
(1.2) |
(1.3) |
(2.9) |
(3.1) |
(3.3) |
(3.5) |
(3.6) |
(3.6) |
(3.7) |
(3.8) |
|||||||||
Acquisitions |
(9.8) |
0.0 |
0.0 |
0.0 |
0.0 |
0.0 |
0.0 |
0.0 |
0.0 |
0.0 |
0.0 |
|||||||||
Free cash flow |
(2.8) |
6.0 |
8.0 |
7.9 |
8.6 |
9.3 |
9.9 |
10.3 |
10.7 |
11.0 |
11.2 |
|||||||||
Terminal value |
|
|
|
|
|
|
|
|
|
|
151.1 |
|||||||||
Total cash flow |
(2.8) |
6.0 |
8.0 |
7.9 |
8.6 |
9.3 |
9.9 |
10.3 |
10.7 |
11.0 |
162.3 |
|||||||||
Discounted cash flows |
0.0 |
6.0 |
7.3 |
6.5 |
6.5 |
6.3 |
6.1 |
5.8 |
5.4 |
5.1 |
68.2 |
|||||||||
Sum of discounted CFs |
123.2 |
|
RFR |
|
|
6.6% |
|
|
|
|
|
|||||||||
Net debt/(cash) |
6.0 |
|
WACC |
|
|
10.1% |
|
|
|
|
|
|||||||||
Equity valuation |
117.2 |
|
Terminal growth rate |
2.5% |
|
|
|
|
|
|||||||||||
Number of shares, diluted (m) |
7.9 |
|
Terminal value/EV |
52% |
|
|
|
|
|
|||||||||||
Value per share (NIS) |
54.7 |
|
Value per share ($) |
14.9 |
|
|
|
|
|
|||||||||||
Source: Edison Investment Research
Exhibit 6: Financial summary
$m |
2015 |
2016 |
2017e |
2018e |
2019e |
||
Year end 31 December |
US GAAP |
US GAAP |
US GAAP |
US GAAP |
US GAAP |
||
INCOME STATEMENT |
|||||||
Revenue |
|
|
60.57 |
64.35 |
71.91 |
78.06 |
82.89 |
Cost of Sales |
(31.31) |
(32.58) |
(36.04) |
(38.54) |
(40.44) |
||
Gross Profit |
29.25 |
31.78 |
35.88 |
39.53 |
42.46 |
||
EBITDA |
|
|
8.10 |
9.38 |
11.50 |
14.00 |
15.83 |
Normalised operating profit |
|
|
6.40 |
7.64 |
9.22 |
11.21 |
12.56 |
Amortisation of acquired intangibles |
(0.54) |
(0.47) |
(0.18) |
(0.16) |
(0.14) |
||
Exceptionals |
(0.91) |
(0.60) |
0.00 |
0.00 |
0.00 |
||
Share-based payments (incl. in COGS) |
(0.31) |
(0.32) |
(0.32) |
(0.33) |
(0.33) |
||
Reported operating profit |
4.64 |
6.25 |
8.72 |
10.72 |
12.08 |
||
Net Interest |
(0.06) |
(1.05) |
(0.83) |
(0.58) |
(0.37) |
||
Joint ventures & associates (post tax)/other |
(0.01) |
(0.01) |
0.00 |
0.00 |
0.00 |
||
Exceptionals |
0.00 |
0.00 |
0.00 |
0.00 |
0.00 |
||
Profit before tax (norm) |
|
|
6.32 |
6.58 |
8.39 |
10.63 |
12.19 |
Profit before tax (reported) |
|
|
4.57 |
5.19 |
7.89 |
10.14 |
11.71 |
Reported tax |
(1.31) |
(1.85) |
(1.97) |
(2.53) |
(2.93) |
||
Profit after tax (norm) |
5.02 |
4.93 |
6.42 |
8.09 |
9.26 |
||
Profit after tax (reported) |
3.26 |
3.35 |
5.92 |
7.60 |
8.78 |
||
Minority interests |
0.00 |
(0.02) |
(0.03) |
(0.04) |
(0.04) |
||
Discontinued operations |
0.54 |
0.15 |
0.00 |
0.00 |
0.00 |
||
Net income (normalised) |
4.95 |
4.95 |
6.39 |
8.05 |
9.22 |
||
Net income (reported) |
3.80 |
3.49 |
5.89 |
7.57 |
8.74 |
||
Basic average number of shares outstanding (m) |
7.73 |
7.82 |
7.92 |
8.02 |
8.12 |
||
EPS – basic normalised ($) |
|
|
0.64 |
0.63 |
0.81 |
1.00 |
1.13 |
EPS – diluted normalised ($) |
|
|
0.62 |
0.62 |
0.78 |
0.98 |
1.10 |
EPS – basic reported ($) |
|
|
0.49 |
0.45 |
0.74 |
0.94 |
1.08 |
Dividend ($) |
0.00 |
0.00 |
0.00 |
0.00 |
0.00 |
||
Revenue growth (%) |
N/A |
6.25 |
11.75 |
8.55 |
6.19 |
||
Gross margin (%) |
48.30 |
49.38 |
49.89 |
50.63 |
51.22 |
||
EBITDA margin (%) |
13.37 |
14.58 |
15.99 |
17.93 |
19.09 |
||
Normalised operating margin (%) |
10.56 |
11.87 |
12.82 |
14.36 |
15.15 |
||
BALANCE SHEET |
|||||||
Fixed assets |
|
|
68.78 |
51.14 |
54.66 |
56.11 |
57.46 |
Intangible assets |
31.83 |
40.16 |
41.98 |
41.82 |
41.67 |
||
Tangible assets |
3.28 |
5.27 |
6.97 |
8.59 |
10.08 |
||
Investments & other |
33.67 |
5.71 |
5.71 |
5.71 |
5.71 |
||
Current assets |
|
|
34.66 |
25.62 |
24.52 |
29.90 |
38.69 |
Stocks |
4.70 |
5.58 |
6.17 |
6.60 |
6.93 |
||
Debtors |
11.09 |
11.46 |
12.81 |
13.91 |
14.77 |
||
Cash & cash equivalents |
7.25 |
6.07 |
2.95 |
6.73 |
14.26 |
||
Other |
11.62 |
2.50 |
2.58 |
2.66 |
2.74 |
||
Current liabilities |
|
|
(30.45) |
(18.70) |
(19.63) |
(20.31) |
(21.34) |
Creditors |
(9.82) |
(13.96) |
(15.51) |
(16.68) |
(17.63) |
||
Tax and social security |
0.00 |
0.00 |
0.00 |
0.00 |
0.00 |
||
Short-term borrowings |
(4.82) |
(3.71) |
(2.97) |
(2.38) |
(2.38) |
||
Other |
(15.81) |
(1.04) |
(1.16) |
(1.26) |
(1.34) |
||
Long-term liabilities |
|
|
(17.95) |
(15.36) |
(9.09) |
(5.80) |
(5.54) |
Long-term borrowings |
(8.39) |
(11.31) |
(5.36) |
(2.36) |
(2.36) |
||
Other long-term liabilities |
(9.57) |
(4.05) |
(3.73) |
(3.44) |
(3.18) |
||
Net assets |
|
|
55.04 |
42.69 |
50.45 |
59.90 |
69.28 |
Minority interests |
(1.07) |
0.16 |
0.12 |
0.08 |
0.08 |
||
Shareholders' equity |
|
|
53.97 |
42.85 |
50.58 |
59.98 |
69.35 |
CASH FLOW |
|||||||
Operating cash flow before WC and tax |
8.10 |
9.38 |
11.50 |
14.00 |
15.83 |
||
Working capital |
(0.31) |
0.74 |
(0.34) |
(0.33) |
(0.24) |
||
Exceptional & other |
2.20 |
0.22 |
0.00 |
0.00 |
0.00 |
||
Tax |
(0.23) |
(0.12) |
(1.18) |
(1.27) |
(2.93) |
||
Net operating cash flow |
|
|
9.76 |
10.22 |
9.97 |
12.40 |
12.66 |
Capex |
(3.62) |
(4.08) |
(4.32) |
(4.79) |
(5.17) |
||
Acquisitions/disposals |
0.00 |
(9.81) |
0.00 |
0.00 |
0.00 |
||
Net interest |
(0.89) |
(1.05) |
(0.83) |
(0.58) |
(0.37) |
||
Equity financing |
0.02 |
0.00 |
0.00 |
0.00 |
0.00 |
||
Dividends |
0.00 |
0.00 |
0.00 |
0.00 |
0.00 |
||
Other, incl.PPE sales |
1.26 |
0.45 |
0.31 |
0.34 |
0.41 |
||
Net cash flow |
6.53 |
(4.27) |
5.13 |
7.37 |
7.53 |
||
Opening net debt/(cash) |
|
|
9.22 |
5.95 |
10.50 |
5.37 |
(2.00) |
FX |
(0.19) |
(0.28) |
0.00 |
0.00 |
0.00 |
||
Other non-cash movements |
(3.07) |
0.00 |
0.00 |
0.00 |
0.00 |
||
Closing net debt/(cash) |
|
|
5.95 |
10.50 |
5.37 |
(2.00) |
(9.53) |
Source: Pointer Telocation accounts, Edison Investment Research
|
|
Paysafe reported FY16 results in line with expectations, after upgrading its outlook in January. The company saw strong organic growth in all divisions and continues to consider acquisitions that meet its preference for relevant, niche-orientated payments solutions. The stock continues to trade at a material discount to peers – a gradual reduction in the relative contribution of the company’s largest merchant should help reduce this.