Last close As at 05/08/2026
GBP2.91
▲ 1.00 (0.34%)
Market capitalisation
GBP504m
Research: Investment Companies
Utilico Emerging Markets (UEM) aims to generate long-term total returns from a portfolio invested primarily in operational and cash generative companies in emerging markets infrastructure and utility sectors. UEM typically holds about 60 to 90 high-conviction positions and is broadly diversified by both sector and geography; the manager has a long-term investment approach and aims to generate a 15% pa total return from each holding. More than 95% of the portfolio is invested in well-established businesses with 75% comprising companies paying a dividend. UEM has increased or maintained its dividend every year since launch in 2005.
Utilico Emerging Markets |
Focused investment in emerging markets |
Investment trusts |
16 March 2017 |
Share price/discount performance
Three-year performance vs index
Gearing
Analysts
|
|||||||||||||||||||||||||||||||||||||||||||||||||||||||||||||||||||||||||||||||||
Utilico Emerging Markets (UEM) aims to generate long-term total returns from a portfolio invested primarily in operational and cash generative companies in emerging markets infrastructure and utility sectors. UEM typically holds about 60 to 90 high-conviction positions and is broadly diversified by both sector and geography; the manager has a long-term investment approach and aims to generate a 15% pa total return from each holding. More than 95% of the portfolio is invested in well-established businesses with 75% comprising companies paying a dividend. UEM has increased or maintained its dividend every year since launch in 2005.
12 months ending |
Share price |
NAV |
MSCI Emerging Markets (%) |
MSCI EM Infrastructure Capped (%) |
Performance fee benchmark (%) |
28/02/13 |
20.7 |
16.7 |
5.9 |
10.3 |
6.2 |
28/02/14 |
(2.6) |
(0.9) |
(14.6) |
(13.3) |
6.5 |
28/02/15 |
8.5 |
10.2 |
14.3 |
17.4 |
7.8 |
29/02/16 |
(3.3) |
(3.7) |
(14.8) |
(12.8) |
8.0 |
28/02/17 |
22.7 |
25.5 |
45.5 |
31.6 |
8.0 |
Source: Thomson Datastream. Note: All % on a total return basis in pounds sterling. Performance fee benchmark subject to an 8% minimum from April 2014.
Investment strategy: Focus on infrastructure/utilities
Charles Jillings has managed UEM since the fund was launched in July 2005; he adopts a long-term, bottom-up investment approach, avoiding short-term ‘noise’ in the stock markets. Companies considered for investment have attractive fundamentals, such as strong cash flows supporting dividend yields, and trade at a discount to their estimated intrinsic value. Meeting with company managements and site visits are key elements of the investment process. UEM’s gearing has increased as the manager has taken advantage of attractive company valuations to add exposure outside of UEM’s largest positions. At end-February 2017, net gearing was 3.6%.
Market outlook: Attractive valuation and growth
Emerging market equities, including infrastructure companies, have relatively attractive valuations compared to world equities, across a variety of measures. International Monetary Fund GDP growth estimates also favour emerging and developing economies over developed economies. For investors seeking exposure to emerging markets, a fund invested in relatively stable, cash-generative businesses such as infrastructure and utilities with structural growth prospects may hold some appeal.
Valuation: Discount wider than historical averages
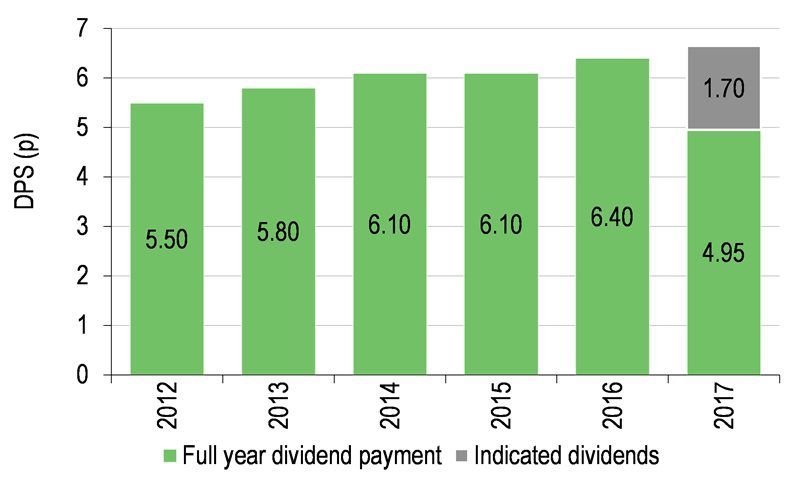
UEM’s current 10.6% share price discount to cum-income NAV is broadly in line with the one-year average and wider than the averages of the last three, five and 10 years (range of 8.1% to 9.1%). There is a control mechanism in place aiming to limit the discount to 10% and UEM has been actively repurchasing shares during FY17. While primarily focused on total return, the board aims to pay a stable to rising annual dividend and has proposed a 3.9% increase in the dividend to 6.65p, giving UEM a yield of 3.1%, significantly higher than emerging market peers.
Exhibit 1: Trust at a glance
Investment objective and fund background |
Recent developments |
||||||||||||||||||||||||||||||||||||||||||||||||||||||||||||||||||||||
Utilico Emerging Markets’ investment objective is to provide long-term total return by investing predominantly in infrastructure, utility and related sectors mainly in emerging markets. |
■ 2 February 2017: Announcement of third quarterly interim dividend of 1.70p per share. ■ 16 November 2016: Six-month report to 30 September 2016. NAV TR of +13.3 versus MSCI EM index TR of +19.8%. Proposed FY17 dividend of 6.65p per share. ■ 7 November 2016: Announcement of second quarterly interim dividend of 1.625p per share. |
||||||||||||||||||||||||||||||||||||||||||||||||||||||||||||||||||||||
Forthcoming |
Capital structure |
Fund details |
|||||||||||||||||||||||||||||||||||||||||||||||||||||||||||||||||||||
AGM |
September 2017 |
Ongoing charges |
1.0% |
Group |
ICM |
||||||||||||||||||||||||||||||||||||||||||||||||||||||||||||||||||
Final results |
June 2017 |
Net gearing |
3.6% |
Manager |
Charles Jillings |
||||||||||||||||||||||||||||||||||||||||||||||||||||||||||||||||||
Year end |
31 March |
Annual mgmt fee |
0.65% |
Address |
UK office: PO Box 208, |
||||||||||||||||||||||||||||||||||||||||||||||||||||||||||||||||||
Dividend paid |
Sep, Dec, Mar, Jun |
Performance fee |
15% of outperformance (cap: 1.85% of average net assets) |
||||||||||||||||||||||||||||||||||||||||||||||||||||||||||||||||||||
Launch date |
20 July 2005 |
Trust life |
Indefinite (continuation vote) |
Phone |
+44 (0)1372 271486 |
||||||||||||||||||||||||||||||||||||||||||||||||||||||||||||||||||
Continuation vote |
Five yearly, next 2021 AGM |
Loan facilities |
£50m facility |
Website |
|||||||||||||||||||||||||||||||||||||||||||||||||||||||||||||||||||
Dividend policy and history (financial years) |
Share buyback policy and history (financial years) |
||||||||||||||||||||||||||||||||||||||||||||||||||||||||||||||||||||||
The fund is managed for total return, but the board broadly seeks flat or rising dividends. |
Subject to annual renewal, UEM has authority to repurchase up to 14.99% and allot shares up to 10% of the issued share capital. |
||||||||||||||||||||||||||||||||||||||||||||||||||||||||||||||||||||||
|
|
||||||||||||||||||||||||||||||||||||||||||||||||||||||||||||||||||||||
Shareholder base (as at 16 March 2017) |
Portfolio exposure by sector (look-through as at 28 February 2017) |
||||||||||||||||||||||||||||||||||||||||||||||||||||||||||||||||||||||
|
|
||||||||||||||||||||||||||||||||||||||||||||||||||||||||||||||||||||||
Top 10 holdings (as at 28 February 2017) |
|||||||||||||||||||||||||||||||||||||||||||||||||||||||||||||||||||||||
|
|||||||||||||||||||||||||||||||||||||||||||||||||||||||||||||||||||||||
Source: Utilico Emerging Markets, Edison Investment Research, Bloomberg, Morningstar. Note: *N/A where not in February 2016 top 10.
Market outlook: Favourable valuation/higher growth
Exhibit 2 (left-hand side) shows the performance of emerging market indices versus the FTSE All-Share Index over the last 10 years. Both the MSCI Emerging Markets and MSCI Emerging Markets Infrastructure indices have outperformed the FTSE All-Share by a considerable margin, albeit with greater volatility due to changing growth expectations, volatile commodity prices and currency moves. Emerging market equities retain their relatively attractive valuations versus world equities on all measures shown in Exhibit 2 (right-hand side), and in its October 2016 World Economic Outlook, the International Monetary Fund maintained a significantly higher growth outlook for emerging markets and developing economies versus advanced economies (4.6% versus 1.8% in 2018, respectively). Factors contributing to this growth differential include the rising middle class in emerging markets and higher infrastructure spending. For investors wanting exposure to emerging market equities, a fund with an attractive yield, investing in relatively stable, cash-generative businesses, such as infrastructure and utilities with structural growth opportunities, may appeal.
|
Exhibit 2: Market performance and valuation |
|
Indices’ total return performance (£ adjusted, last 10 years) |
Indices’ valuation metrics as at 28 February 2017 |
|
|
|
Source: Thomson Datastream, Edison Investment Research, MSCI |
|
Fund profile: EM infrastructure and utility investment
Launched in July 2005, UEM is a Bermuda-registered investment company listed in London. It aims to generate long-term total returns from investment in infrastructure, utilities and related sectors, primarily in emerging markets. Since launch, UEM has been managed by Charles Jillings, who works for Bermuda-based ICM. He selects stocks on a bottom-up basis unconstrained by benchmark allocations, although the MSCI Emerging Markets Index is used as a reference. The benchmark for UEM’s performance fee is the UK Gilt five- to 10-year index post-tax yield, plus RPIX inflation, plus 2%, subject to an 8% minimum and capped at 1.85% of average NAV. Internal management guidelines limit top 10 holdings to 60%, single stock exposure to 10%, and individual country and sector exposure to 30% and 25% of gross assets, respectively (investments outside the core infrastructure and utility sectors are capped at 20%). Up to 5% may be held in unlisted securities (3% held at end-September 2016). Gearing of up to 25% of gross assets is permitted. From launch to end-February 2017, UEM’s NAV gross total returns have compounded at 11.9% pa.
The fund manager: Charles Jillings
The manager’s view: Positive outlook for growth in 2017
Manager Charles Jillings is positive on the outlook for economic growth in 2017. In the US, he believes that President Trump will push for policy changes that will lead to a strong domestic economy. In the UK, despite the Brexit overhang, a commitment to higher infrastructure spending and a stronger banking environment should also be positive for economic growth. The manager suggests that even in Europe, growth estimates could surprise to the upside, led by Spain, which is growing faster than the combined European Union. He remains positive on the outlook for economic growth in emerging markets, which he believes could also surprise to the upside, citing reforms in India under Prime Minister Modi, which could re-energise the economy, China’s GDP growth consistently above 6% pa and improving Latin American growth led by Brazil and Argentina.
Jillings’ concerns centre on the relationship between the US and China; if it deteriorates, he suggests that difficulties could arise for both trading partners. He also suggests that the rise in populism could increase political tensions in Europe, which could lead to further challenges for the euro. The manager sees a mixed outlook for Mexico, which has undertaken economic reforms and as a net exporter of oil, higher oil prices are a benefit. However, the US is Mexico’s largest trading partner, so President Trump’s stated agenda must be considered a risk to economic growth.
Asset allocation
Investment process: Bottom-up stock selection
The manager aims to generate long-term total return primarily from investment in emerging markets infrastructure and utility companies. He does not get distracted by near-term stock market ‘noise’, maintaining a focus on the long term. The nature of the investments selected ensures that portfolio performance is somewhat protected during periods of economic weakness or currency fluctuations. Jillings is able to draw on the deep experience of the team at ICM Investment Management in constructing a portfolio of c 60 to 90 high-conviction ideas from a potential investible universe of c 900 companies. Detailed models are constructed and valuation targets determined for potential investments; visiting with company managements and site visits are key elements of the process.
Stocks are selected for portfolio inclusion when they are trading at a discount to the perceived intrinsic value of the underlying business, which should have strong fundamentals, such as top line growth with strong EBITDA margins and cash flows supporting above-average dividend yields. In Romania, the manager has been able to invest in companies with low valuations, significant cash on the balance sheet and high dividend yields. Jillings aims to select stocks that he believes are able to generate 15% pa total returns. More than 95% of the portfolio is invested in established rather than greenfield businesses, with more than 75% invested in companies that pay a dividend. Investment risk is reduced given portfolio holdings are backed by real assets as well as UEM’s broad diversification by geography and sector. In H117, portfolio turnover was higher than average, primarily reflecting some significant realisations and reinvestment of proceeds; purchases totalled £70.1m (+31.4% year-on-year), while realisations totalled £67.4m (+3.0% year-on-year). UEM typically invests/divests c £100m per annum; in FY16, £96.1m was invested and £130.5m realised as the manager took profits in China H shares following a rally in April 2015.
Current portfolio positioning
At end-February 2017, UEM’s top 10 positions were 35.0% of the total portfolio, a significant decrease in concentration versus 45.5% at end- February 2016; seven companies were common to both periods. The manager explains that he has been using gearing (see page 7) to increase exposure due to attractive company valuations. There has been increased investment outside of the top 10 names, which explains the lower top 10 concentration versus 12 months ago.
Although UEM invests on a bottom-up basis, it is interesting to note the major changes in exposure over the last 12 months on both a geographic and sector look-through basis (Exhibit 3). In terms of geography, the largest increase in exposure is Brazil (+10.3pp), while the largest decreases are Malaysia (-7.5pp) and China/Hong Kong (-7.3pp). The manager notes that under the new government, the Brazilian economy and currency is improving and he expects further interest rate decreases to support economic growth. He has re-initiated a position in CCR, one of Latin America’s largest infrastructure concession groups, which has a more attractive pipeline of new projects in 2017 versus 2016 and declining interest rates should be another important driver for infrastructure investments. The lower exposure in Malaysia and China/Hong Kong is a result of strong performance, leading to holdings being sold as valuation targets were reached.
UEM has been a long-term investor in Romania, where economic growth has been robust due to lower inflation and monetary/fiscal easing, which is driving domestic consumption. The manager comments that of the c 10% current Romanian exposure in the portfolio, c 50% is a result of capital allocation with c 50% coming from share price appreciation. Recent positive news flow includes the prospect that Romanian state-owned companies may have to increase their dividend payments to 90% of prior-year net profits; the potential for higher distributions has led to significant share price revaluations of these particular companies.
Exhibit 3: Portfolio geographic and industrial look-through exposure (% unless stated)
Portfolio end-February 2017 |
Portfolio end- February 2016 |
Change (pp) |
Portfolio end- February 2017 |
Portfolio end- February 2016 |
Change (pp) |
|||
Brazil |
19.9 |
9.6 |
10.3 |
Electricity |
23.7 |
15.9 |
7.8 |
|
China incl. Hong Kong |
18.9 |
26.2 |
-7.3 |
Gas |
18.4 |
18.1 |
0.3 |
|
Romania |
9.8 |
8.6 |
1.2 |
Ports |
15.1 |
12.0 |
3.1 |
|
Middle East/Africa |
7.5 |
6.6 |
0.9 |
Airports |
9.0 |
11.4 |
-2.4 |
|
India |
6.7 |
4.8 |
1.9 |
Water and waste |
8.4 |
9.9 |
-1.5 |
|
Philippines |
6.4 |
6.2 |
0.2 |
Other |
6.9 |
7.6 |
-0.7 |
|
Malaysia |
6.0 |
13.5 |
-7.5 |
Toll roads |
5.9 |
3.9 |
2.0 |
|
Other Latin America |
5.8 |
3.8 |
2.0 |
Satellites |
5.8 |
10.0 |
-4.2 |
|
Thailand |
5.0 |
7.0 |
-2.0 |
Telecoms |
3.7 |
2.3 |
1.4 |
|
Other Europe |
4.0 |
3.2 |
0.8 |
Other infrastructure |
2.0 |
5.7 |
-3.7 |
|
Chile |
3.6 |
6.1 |
-2.5 |
Renewables |
0.7 |
0.2 |
0.5 |
|
Argentina |
3.2 |
0.0 |
3.2 |
Infrastructure inv. funds |
0.4 |
3.0 |
-2.6 |
|
Other Asia |
3.2 |
4.4 |
-1.2 |
|||||
100.0 |
100.0 |
|
100.0 |
100.0 |
Source: Utilico Emerging Markets, Edison Investment Research
In terms of sectors, the largest increases in exposure are electricity (+7.8pp) and ports (+3.1pp), while the largest decreases are satellites (-4.2pp) and other infrastructure (-3.7pp). UEM has modest exposure to the telecom sector despite numerous investment opportunities. The manager explains that five to 10 years ago, the industry was enjoying reasonable top-line growth. However, he believes that most telecom markets are now saturated, with more competition and exposure to disruptive technology, which is reducing returns; hence there are better investment opportunities for UEM elsewhere.
One of the recent additions to UEM’s portfolio is top 10 holding Rumo Logistica Operadora Multimodal, a Brazilian logistics operator; UEM participated in the April 2016 capital raising and has subsequently added to its position. Rumo owns the largest independent railroad operation in Brazil, covering the three main export corridors for agricultural commodities. Its share price has rallied more than 40% year-to-date; recent positive news includes progress on the renewal of the Malha Paulista concession, which is expected to be signed in mid-2017. The manager believes operational changes can be made at the company, which should lead to higher returns.
Performance: Above the performance fee benchmark
Exhibit 4 shows UEM’s performance in absolute terms versus the MSCI Emerging Markets Index, which is used as a reference. Over 10 years, UEM’s share price and NAV total returns have averaged 8.0% and 8.9% pa, respectively, versus 7.5% pa for the index. Over the last year, UEM’s share price and NAV total returns have been boosted by the weakness in sterling.
|
Exhibit 4: Investment trust performance to 28 February 2017 |
|
Price, NAV and index total return performance, one-year rebased |
Price, NAV and index total return performance (%) |
|
|
|
Source: Thomson Datastream, Edison Investment Research. Note: Three, five and 10-year performance figures annualised. |
|
As shown in Exhibit 5, UEM’s share price and NAV total returns have outperformed its performance fee benchmark* over one, three, five and 10 years. UEM has outperformed the MSCI Emerging Markets and MSCI Emerging Markets indices over five and 10 years, while trailing over one and three years. As a reference to UK shareholders we also include performance versus the FTSE All-Share Index; UEM’s NAV total return has outperformed over one, three and 10 years.
Exhibit 5: Share price and NAV total return performance, relative to indices (%)
|
One month |
Three months |
Six months |
One year |
Three years |
Five years |
10 years |
Price relative to MSCI Emerging Markets |
1.2 |
(3.6) |
(9.5) |
(15.7) |
(9.2) |
18.1 |
2.6 |
NAV relative to MSCI Emerging Markets |
(0.1) |
(0.5) |
(6.4) |
(13.7) |
(6.0) |
20.2 |
11.1 |
Price relative to MSCI EM Infrastructure |
2.2 |
(1.3) |
(3.0) |
(6.8) |
(4.3) |
17.6 |
4.9 |
NAV relative to MSCI EM Infrastructure |
1.0 |
1.8 |
0.3 |
(4.6) |
(1.0) |
19.7 |
13.7 |
Price relative to FTSE All-Share |
2.3 |
(2.2) |
(7.3) |
(0.1) |
7.2 |
(2.5) |
24.8 |
NAV relative to FTSE All-Share |
1.0 |
0.9 |
(4.1) |
2.2 |
10.9 |
(0.7) |
35.2 |
Price relative to performance fee benchmark |
4.8 |
3.6 |
(3.1) |
13.6 |
2.4 |
6.4 |
3.4 |
NAV relative to performance fee benchmark |
3.5 |
6.8 |
0.2 |
16.2 |
5.9 |
8.3 |
12.1 |
Source: Thomson Datastream, Edison Investment Research. Note: Data to end-February 2017. Geometric calculation. *Benchmark for performance fee is UK Gilt five- to 10-year post-tax yield, plus RPIX, plus 2%, subject to an 8% minimum from 1 April 2014.
|
Exhibit 6: NAV total return performance relative to MSCI EM Index over five years |
|
|
Source: Thomson Datastream, Edison Investment Research |
Discount: Remains wide versus historical averages
The board and the manager actively monitor the discount. There is an inclination, but not a commitment to repurchase shares when the discount exceeds 10%; each buyback is an investment decision made by the manager, taking into account other investment opportunities. So far in FY17, UEM has been actively repurchasing shares (see Exhibit 1). UEM’s current 10.6% share price discount to cum-income NAV is broadly in line with the average of the last 12 months but is wider than the averages of the last three, five and 10 years of 9.1%, 8.1% and 8.5%, respectively. The short-lived but sharp widening in the discount in August 2015 corresponded to the sell-off in the Chinese stock market and the brief spike down in June 2016 followed the result of the UK’s European referendum.
|
Exhibit 7: Share price discount to NAV (including income) over three years (%) |
|
|
Source: Thomson Datastream, Edison Investment Research |
Capital structure and fees
UEM has 211.4m ordinary shares in issue following the repurchase of 4.8m shares (2.3% of issued capital) so far in FY17. It has the authority, renewed annually, to repurchase 14.99% and allot up to 10% of its issued share capital. In September 2015, UEM announced a one-for-five bonus issue of subscription shares at a special general meeting. The remaining exercise dates are the last business day in August 2017 and February 2018 at an exercise price of 183.0p. On 1 March 2017, 1.3m subscription shares were exercised raising £2.4m. Exercise of all the remaining 37.8m subscription shares outstanding would result in c 3.5% dilution to the current NAV. At end-February 2017, bank debt was £46.9m (equating to 9.2% gross gearing), which is c 140% higher than the £19.7m at the end of H117. UEM has a £50m multi-currency revolving debt facility with Scotiabank Europe, which expires on 30 April 2018.
The annual management fee paid to ICM is 0.65% of net assets. Subject to an 8% minimum hurdle, a 15% performance fee is payable on returns in excess of the UK Gilt five- to 10-year index post-tax yield, plus RPIX inflation, plus 2% (the NAV must exceed the high watermark NAV when the performance fee was last paid). Performance fees are capped at 1.85% of average net assets in each financial year For H117, ongoing charges were 1.0%, (down from 1.1% in FY16); including the performance fee, ongoing charges in H117 were 2.2%. No performance fee was paid in FY16.
Dividend policy and record
Dividends are paid quarterly in September, December, March and June. While UEM is managed for total return, the board aims to maintain or increase the annual dividend and this has been achieved every year since fund launch. UEM is able to distribute dividends from both income and capital, which enables a smooth progression of annual dividends. In H117, dividends of 3.25p per share were 1.6x covered by earnings. The retained revenue reserve increased by c 40% to £14.6m, versus £10.5m at the end of FY16 (30 March); this is equivalent to 6.8p per share. Seasonally, in any one financial year, more income is received in H1 versus H2. The directors propose to increase both the Q317 and Q417 dividends from 1.625p to 1.70p, giving a 6.65p total dividend for FY17 representing a 3.9% increase versus FY16, and bringing the five-year compound annual growth rate in the dividend to 3.87%; the prospective dividend yield is 3.1%.
Peer group comparison
In Exhibit 8, we compare UEM with AIC Global Emerging Markets sector trusts that have market caps greater than £100m. While UEM’s specific focus on infrastructure and utilities means a direct comparison cannot be made, its relatively broad emerging market exposure provides some relevance. UEM’s NAV total return is ahead of the peer group weighted average over five and 10 years (ranking second out of eight and third out of five funds, respectively), while trailing over one and three years. UEM’s discount is broadly in line with the weighted average, while its ongoing fee is lower, although a performance fee is payable. Its gearing is higher than average and UEM ranks third in terms of yield among the six peers paying a dividend.
Exhibit 8: Selected peer group as at 13 March 2017
% unless stated |
Market cap £m |
NAV TR 1 Year |
NAV TR 3 Year |
NAV TR 5 Year |
NAV TR 10 Year |
Discount (ex-par) |
Ongoing charge |
Perf. fee |
Net gearing |
Dividend yield (%) |
Utilico Emerging Markets |
451.6 |
26.5 |
35.3 |
58.2 |
140.5 |
(10.3) |
1.0 |
Yes |
104 |
3.1 |
Aberdeen Emerging Markets |
279.8 |
37.6 |
43.6 |
23.5 |
68.4 |
(14.4) |
1.1 |
Yes |
100 |
0.0 |
Aberdeen Frontier Markets Inv. |
111.8 |
30.8 |
19.1 |
47.4 |
|
(9.1) |
1.7 |
Yes |
100 |
1.5 |
BlackRock Frontiers |
253.7 |
37.6 |
43.6 |
99.7 |
|
5.5 |
1.4 |
Yes |
116 |
3.4 |
Fundsmith Emerging Equities |
262.6 |
19.0 |
|
|
|
0.8 |
1.8 |
No |
100 |
0.0 |
Genesis Emerging Markets |
863.8 |
36.2 |
40.7 |
31.8 |
141.4 |
(13.6) |
1.4 |
No |
100 |
0.0 |
JPMorgan Emerging Markets |
942.1 |
39.4 |
55.3 |
43.4 |
133.4 |
(13.4) |
1.2 |
No |
100 |
1.2 |
JPMorgan Global Emerging Markets |
369.1 |
40.3 |
41.2 |
40.6 |
|
(3.2) |
1.4 |
No |
106 |
3.9 |
Templeton Emerging Markets |
1,867.5 |
54.5 |
43.8 |
22.7 |
152.9 |
(13.3) |
1.2 |
No |
100 |
1.3 |
Simple average |
35.8 |
40.3 |
45.9 |
127.3 |
(7.9) |
1.3 |
103 |
1.6 |
||
Weighted average |
41.8 |
43.9 |
36.8 |
139.8 |
(10.9) |
1.3 |
101 |
1.8 |
||
UEM rank in sector |
4 |
8 |
7 |
2 |
3 |
5 |
9 |
3 |
3 |
Source: Morningstar, Edison Investment Research. Note: TR=total return. Net gearing is total assets less cash and equivalents as a percentage of net assets.
The board
There are five non-executive directors on the board at UEM, of whom four are independent. Chairman John Rennocks was appointed in November 2015 and assumed his current role on 20 September 2016 following the retirement of Alexander Zagoreos. The other independent directors and their dates of appointment are: deputy chairman Garth Milne (November 2014); Garry Madeiros (June 2007); and Anthony Muh (October 2010). Susan Hansen (June 2007) is deemed non-independent as she is a director of RESIMAC, which has the same majority shareholder as the investment manager.
|
|
Investment Companies