Last close As at 07/08/2026
—
— 0.00 (0.00%)
Market capitalisation
—
Research: Energy & Resources
The equity market is implying very little value for Egdon’s UK shale positions, which span the Gainsborough Trough, Widmerpool and Humber Basins. We see near-term catalysts that could reduce risks and uncertainty relating to the valuation of UK shale assets with initial flow tests from Cuadrilla-operated Preston New Road expected in Q418. Our probabilistic valuation of UK shale assets describes uncertainty in relation to UK shale. We conclude a potential 67% chance of commercial success and net risked P50 valuation of $2,142/acre (we do not include political risk in this metric). Based on our analysis we believe Egdon’s current EV of $22m offers investors a low cost option on over 205,000 acres of UK shale if proven commercial. Our conventional valuation stands at 12.8p/share including risked exploration. The valuation of shale resource remains uncertain but in our view has the potential to be worth in excess of risked 100p/share based on current expectations of well cost, type curves, and forward gas prices.
Written by
Egdon Resources |
Focus on UK shale - a low-cost option |
Shale outlook |
Oil & gas |
30 April 2018 |
Share price performance
Business description
Next events
Analyst
Egdon Resources is a research client of Edison Investment Research Limited |
|||||||||||||||||||||||||||||||||||||||||||||||||
The equity market is implying very little value for Egdon’s UK shale positions, which span the Gainsborough Trough, Widmerpool and Humber Basins. We see near-term catalysts that could reduce risks and uncertainty relating to the valuation of UK shale assets with initial flow tests from Cuadrilla-operated Preston New Road expected in Q418. Our probabilistic valuation of UK shale assets describes uncertainty in relation to UK shale. We conclude a potential 67% chance of commercial success and net risked P50 valuation of $2,142/acre (we do not include political risk in this metric). Based on our analysis we believe Egdon’s current EV of $22m offers investors a low cost option on over 205,000 acres of UK shale if proven commercial. Our conventional valuation stands at 12.8p/share including risked exploration. The valuation of shale resource remains uncertain but in our view has the potential to be worth in excess of risked 100p/share based on current expectations of well cost, type curves, and forward gas prices.
Year end |
Revenue |
PBT* |
Net cash/ |
EBITDA |
Capex |
07/16 |
1.6 |
(2.7) |
2.7 |
(0.7) |
(2.4) |
07/17 |
1.0 |
(1.7) |
6.1 |
(1.2) |
(1.1) |
07/18e |
1.1 |
(2.0) |
2.2 |
(1.1) |
(2.2) |
07/19e |
2.1 |
(1.3) |
(0.6) |
(1.1) |
(2.8) |
Note: *PBT and EPS are normalised, excluding amortisation of acquired intangibles, exceptional items and share-based payments.
Market implying minimal value for shale acreage
We believe the market is implying minimal value for Egdon’s UK shale position, despite potential near-term catalysts that could significantly de-risk and provide greater certainty on UK shale economics. For more detail, please refer to our AJ Lucas initiation note published on 9 April 2018.
Conventional value affected by delays
In this note we revisit the valuation of Egdon’s conventional oil and gas business, removing assets such as Waddock Cross, Avington, Kirklington and Kirkleatham, which have been shut-in, but including higher production expectations for Ceres and Fiskerton. Delays also negatively affect our conventional valuation after Wressle planning appeals were dismissed in January 2018. We also incorporate a higher discount rate of 12.5% (from 10%) to remain consistent with our small-cap E&P coverage. This reduces our conventional valuation from 21.5p/share to 12.8p/share, the bulk of which remains in risked contingent/prospective resource.
Valuation: Shale dominates valuation
Our asset valuation is dominated by Egdon’s shale acreage position, followed by the appraisal of the BP Biscathorpe discovery and Total’s Resolution gas discovery. There is risk and uncertainty in the valuation of contingent or prospective resources; however, Egdon’s shares offer a low-cost option on what we estimate at over 100p/share of risked value.
Investment summary
Company description: Debt free, sizeable shale exposure
Egdon Resources is an independent E&P focused on oil and gas exploration and exploitation across proven basins in the UK, targeting a mix of conventional and unconventional resource. The company is debt free and benefits from carried interests across a number of its licence blocks. Egdon is looking to grow its unconventional resource exposure in Northern England, add reserves and resources through active drilling and maximise returns from its existing production portfolio through selective investment.
Valuation: Market implying minimal value for shale
Our Egdon valuation is constructed of a risked net asset value for the company’s conventional asset portfolio and an indicative valuation for the company’s unconventional acreage based on a dollar per acre multiple derived from our probabilistic UK shale valuation model. Our conventional asset core value stands at 2.3p/share (including cash and net of G&A) and we include 10.5p/share for risked exploration and appraisal. Our indicative shale valuation stands at 105p/share based on a P50 risked $2,142/acre (see Exhibit 1).
Financials: Debt free, limiting risk exposure through farm out
Egdon had £4.1m of cash and no debt as of 31 January 2018. Management continues to invest in the company’s unconventional asset base while keeping risk capital to a minimum through existing cost-carry arrangements and farm-outs. The company’s 14.5% interest in Springs Road-1 is cost-carried by INEOS and Egdon is looking to farm-down equity to part fund exploration at North Kelsey and appraisal of the Endeavour/Resolution gas discovery.
Sensitivities: Shale activity to provide greater valuation certainty
Numerous studies have been conducted to quantify UK shale gas resources; these form the basis of our probabilistic UK shale valuation. Historic core wells and a vertical exploratory well at Preese Hall provide supportive data to suggest potential for commercial well pad economics. The Bowland shale is thermally mature for gas and benefits from very thick shale sections. Total organic content ranges from 1-7% in cored intervals, and Cuadrilla has demonstrated gas flow to surface at Preese Hall. Significant uncertainty remains over the level of overpressure, the impact of structural complexity on gas recovery and well type curves. Upcoming activity is aimed at reducing this uncertainty through further exploration and appraisal. Cuadrilla is drilling an exploratory well at Preston New Road and initial results from a 90-day flow test are expected in Q418. This will be followed by an extended well test, which should provide valuable data on the type curve for a fracture-stimulated horizontal well – a key determinant of well economics and valuation. Assuming strong gas flows, Cuadrilla may decide to connect the wells and sell gas to the local grid. A key input to our valuation is the 2.5km horizontal well probabilistic-type curve produced by consultancy Anderson Thompson – if actual type curves vary significantly from those predicted, this would have a material impact on valuation. We expect greater valuation certainty after the flow test results from Preston New Road.
Company description
Egdon Resources is an AIM-listed independent E&P focused on conventional and unconventional oil and gas exploration, development and production in the UK. Egdon produces c 100bbld in the UK, with a focus on appraisal of existing discoveries and low-risk conventional exploration. Unconventional exposure is through over 205,000 net acres of prospective shale acreage in the East Midlands, Bowland Basin and Cleveland Basin. In this note we focus primarily on the potential value driver presented by Egdon’s shale assets. An overview of the UK shale industry is shown in Appendix 1 on page 10.
Group strategy
Egdon has three stated strategic objectives:
■
Grow the company’s exposure to unconventional resource and exploration opportunities in Northern England.
■
Add reserves/revenues through active drilling while managing the company’s financial exposure.
■
Continued focus on maximising profitable production through targeted investment.
UK shale dominates valuation
Our valuation is split between producing assets (including cash and net of G&A) at 2.3p/share and 10.5p/share for risked exploration and appraisal, which makes up our conventional RENAV of 12.8p/share. Below we show the valuation that would be ascribed to Egdon’s 205,000 net UK shale acres at multiples ranging from $500/acre (historic farm-outs including those of INEOS/Total in the Gainsborough Trough range from $614/acre to $2,200/acre). Our P50 probabilistic valuation stands at $2,142/acre.
|
Exhibit 1: Group valuation waterfall including indicated shale valuation (p/share) |
|
|
Source: Edison Investment Research |
Potential catalysts – upcoming UK shale newsflow
Key activity that could drive the market to re-evaluate Egdon’s UK shale assets includes Cuadrilla’s initial flow test at Preston New Road (Bowland Basin) in Q418, and drilling of the IGas-operated Springs Road-1 (Gainsborough Trough) vertical well in H218. Conventional activity relevant to Egdon includes drilling at Biscathrope (5mmbo net), Holmwood (1.1mmbo net) and North Kelsey (5.2mmbo net) (subject to further farm out). Farm out of the Resolution/Endeavour gas discoveries could also provide greater certainty of appraisal timing.
Shale valuation and sensitivities
We see Egdon’s most valuable asset as its exposure to the UK shale sector, despite current uncertainty around commerciality. Egdon’s shale position comprises of over 205,000 net acres across the East Midlands (including Gainsborough Trough), the Bowland Basin and Cleveland Basin. With an enterprise value of $15m, the market is clearly implying very little in terms of option value for Egdon’s shale acreage should shale be proven commercial in the UK. This is despite historical UK onshore transaction values ranging from $300-$3,000/acre and Edison’s P50 probabilistic shale valuation of $2,142/acre as extracted from our recent report on AJ Lucas and shown below.
|
Exhibit 2: UK shale implied $/acre values (commercial success case) |
|
|
■ The mean implied unrisked US$/acre value from our analysis is US$7,675/acre with P50 of US$6,418/acre. ■ This only assumes positive values for $/acre, ie a commercial success case. ■ Including a commercial success risking of 67%, this drops to P50 US$4,284/acre. Reducing again by 50% to reflect potential farm-out dilution, this falls to US$2,142/acre. ■ Edison’s calculated unit value range and P50 value is comparable to historical UK shale transaction values. |
|
Source: Edison Investment Research |
|
Why does the market choose not to value Egdon’s shale exposure?
One can attempt to rationalise why the market does not ascribe value to the company’s net shale position. However, it is also possible to see how this view could change dramatically and relatively quickly.
Common reasons or sensitivities cited for not ascribing value for shale include:
■
Political risks
■
Planning uncertainty
■
Timing uncertainty
■
Surface access restrictions and population density
■
Uncertainty with regard to key economic inputs including type curve, the euro and well costs.
■
Significant capital requirements to scale up UK shale operations.
What might change this view and drive a re-rating?
We believe the market is overestimating risk and should be ascribing some form of risked value to UK shale assets for the following reasons.
Political risks
We flag that our shale valuation at $2,142/acre does not take into consideration the political risks. Leading political parties maintain opposing views on the net benefits of UK shale extraction. The current incumbent believes shale will provide a significant benefit in terms of employment, security of energy supply and will support a renewable energy transition. However, the current leader of the Labour party has been vocal about banning the practice of fracking. Investors need to be aware of political risks and the importance of central government in the role of supporting the UK shale sector.
Planning uncertainty
We assume a two-year planning cycle for well pads, but we do not see extended planning processes as a major influence on value. We assume that companies have visibility on the duration of planning processes and submit applications according to this expected timeline. A more cohesive planning process is likely to be required to ensure timetables and processes are consistent across UK local councils and planning authorities.
Timing of cash flows
Timing is a key determinant of cash flow, especially when we discount shale gas assets using a relatively punitive 15% cost of capital. If we were to discount our $2,142/acre unit valuation by a further two years to reflect the fact that the company is only at an advanced stage of planning application and appraisal at IGas-operated Springs Road and Tinker Lane, we would arrive at a net valuation at c $1,500/acre, which would be significantly above that implied by the current share price (implied value is zero assuming Egdon conventional value is in line with Edison estimates).
Surface access limitations
Surface access will limit resource recovery; however, technological advances have enabled companies to maximise recovery from a relatively small surface footprint. It is widely expected that a well pad (around the size of two football pitches) will be sufficient for the drilling of 30 to 40 long lateral wells into different stratigraphic intervals (up to 2.5km with 100 frack stages) depending on localised shale thickness. We do not assume resource limitations due to land access restrictions in our analysis over and above those applied by British Geological Society (BGS) in the society’s calculation of gas initially in place (GIIP) in our shale gas valuation. More complex analysis would involve looking at licence-specific surface access limitations, planning complexities and shale thickness to take a view on accessible GIIP.
Whilst we assume shales and acreage valuations are consistent across the BGS study are, it is possible that differences in net shale thickness, surface access and structural complexity will lead to ‘sweet-spots’ that offer better returns than more peripheral acreage. The Gainsborough Trough, Egdon’s core area, located to the east of the Pennines, benefits from less structural complexity than the Bowland Basin to the west (albeit thinner shale sections).
|
Exhibit 3: Springs road-1 cross-section |
|
|
Source: Egdon |
Commerciality risks and uncertainty
We estimate a 67.2% chance of commercial success based on the modelled inputs in our shale model. A key determinant of value is our probabilistic type curve, which is based on comprehensive analysis carried out by the consultancy Anderson Thompson. Flow tests from Preston New Road in late 2018 will provide further certainty on achievable type curves and per-well economics.
Capital constraints
Egdon is fully carried for the appraisal phase of its share of operations at Springs Road by INEOS. Large-scale development of UK shale assets will require a material capital influx, we would expect a company the size of Egdon to either sell its acreage position to a larger, better capitalised entity or farm-down – we assume 50% value dilution in our base case to reflect a potential farm-down. However, we recognise that dilution will largely be driven by the success or otherwise of the current UK shale appraisal activity. We note that historic farm outs including INEOS/Total in the Gainsborough Trough range from $614/acre to $2,200/acre.
Group valuation
We include Egdon’s conventional asset base in our valuation but note that producing assets remain a relatively small part at 2.3p/share (including cash and net of G&A). This includes the Wressle development, which has incurred numerous delays due to rejected planning applications.
We see greater conventional value in the company’s exploration and appraisal portfolio, in particular its interest in the appraisal of the Endeavour/Resolution gas discovery and appraisal of the BP Biscathorpe oil discovery which make up the bulk of our RENAV. The focus of this note is on Egdon’s shale gas assets. However a full valuation breakdown is provided below including producing assets and risked E&A.
Exhibit 4: Egdon valuation summary
Assets |
Country/ |
WI |
CCoS |
Net |
NPV/boe |
NPV12.5 |
Risked |
$1.4/£, shares 259m |
licence |
% |
% |
mboe |
$/boe |
$m |
/share (p) |
Net (debt) cash Jan 18 |
5.7 |
1.58 |
|||||
G&A (3yrs) |
(4.1) |
(1.12) |
|||||
Production |
|||||||
Keddington |
UK |
45% |
100% |
0.09 |
2.6 |
0.2 |
0.1 |
Ceres |
UK |
10% |
100% |
0.38 |
7.5 |
2.8 |
0.8 |
Fiskerton |
UK |
80% |
100% |
0.10 |
9.3 |
0.9 |
0.3 |
Wressle (Ashover Grit) |
UK |
25% |
90% |
0.15 |
21.1 |
2.8 |
0.8 |
Core NAV |
8.4 |
2.3 |
|||||
Exploration/appraisal |
|||||||
North Kelsey |
UK |
80% |
12% |
5.17 |
11.8 |
7.3 |
2.0 |
Louth |
UK |
65% |
20% |
0.85 |
9.3 |
1.6 |
0.4 |
Wressle (upside) |
UK |
25% |
25% |
0.38 |
17.2 |
1.6 |
0.5 |
Broughton |
UK |
25% |
23% |
0.11 |
17.2 |
0.4 |
0.1 |
Biscathorpe |
UK |
40.8% |
20% |
5.60 |
11.9 |
13.3 |
3.7 |
Holmwood |
UK |
18% |
17% |
1.03 |
7.4 |
1.3 |
0.3 |
Resolution |
UK |
50%* |
18% |
12.65 |
5.3 |
12.7 |
3.5 |
Appraisal & Exploration NAV |
|
|
|
|
|
38.0 |
10.5 |
RENAV |
|
|
|
|
|
46.4 |
12.8 |
Indicative shale valuation P50 |
UK |
50% |
67% |
381.3 |
105.2 |
Source: Edison Investment Research. Note: *Assumed 50% post farm-down (Egdon holds 100% equity).
Key sensitivities for Egdon’s conventional asset portfolio include underlying commodity price, the timing of Wressle development, and E&A activity at Biscathrope and Resolution/Endeavour. Our unconventional valuation is driven by a probablistic model where key drivers include type curve (IP rate and EUR), well costs and underlying gas prices.
Exhibit 5: Egdon net acreage
Source |
Licence |
Location |
Region |
Gross licence area |
Interest |
Gross |
Net |
$/acre |
Value ($m) |
Value (p/share) |
Alkane |
PL161-2 |
Gainsborough Trough |
East Midlands |
18.0 |
100% |
4,448 |
4,448 |
2142 |
9.5 |
2.63 |
Alkane |
PEDL043 |
Gainsborough Trough |
East Midlands |
57.0 |
100% |
14,085 |
14,085 |
2142 |
30.2 |
8.33 |
Alkane |
PEDL169 |
Gainsborough Trough |
East Midlands |
62.0 |
20% |
15,321 |
3,064 |
2142 |
6.6 |
1.81 |
Alkane |
PEDL037 |
Gainsborough Trough |
East Midlands |
10.0 |
100% |
2,471 |
2,471 |
2142 |
5.3 |
1.46 |
Alkane |
PEDL011 |
Gainsborough Trough |
East Midlands |
6.0 |
100% |
1,483 |
1,483 |
2142 |
3.2 |
0.88 |
Alkane |
PEDL202 |
Edale Shelf |
East Midlands |
84.2 |
100% |
20,806 |
20,806 |
2142 |
44.6 |
12.30 |
Alkane |
PEDL001 |
Edale Shelf |
East Midlands |
11.0 |
100% |
2,718 |
2,718 |
2142 |
5.8 |
1.61 |
Alkane |
PEDL191 |
Croxteth |
Bowland Basin |
66.0 |
100% |
16,309 |
16,309 |
2142 |
34.9 |
9.64 |
Alkane |
PEDL039 |
Manchester |
Bowland Basin |
3.0 |
100% |
741 |
741 |
2142 |
1.6 |
0.44 |
Alkane |
EXL253 |
Manchester |
Bowland Basin |
3.0 |
100% |
741 |
741 |
2142 |
1.6 |
0.44 |
Legacy |
PEDL139/PEDL140 |
Gainsborough Trough |
East Midlands |
240.6 |
14.5% |
59,453 |
8,621 |
2142 |
18.5 |
5.10 |
Legacy |
PEDL209 |
Gainsborough Trough |
East Midlands |
64.0 |
36% |
15,815 |
5,693 |
2142 |
12.2 |
3.37 |
Legacy |
PEDL201 |
Widmerpool Gulf |
East Midlands |
80.0 |
32.5% |
19,768 |
6,425 |
2142 |
13.8 |
3.80 |
Legacy |
PEDL068 |
Cleveland Basin |
Cleveland Basin |
35.8 |
68% |
8,846 |
6,016 |
2142 |
12.9 |
3.56 |
Legacy |
PL161/162 Option |
Gainsborough Trough |
East Midlands |
122.3 |
50% |
30,221 |
15,110 |
2142 |
32.4 |
8.93 |
Legacy |
PEDL130 |
Edale Shelf |
East Midlands |
22.0 |
100% |
5,436 |
5,436 |
2142 |
11.6 |
3.21 |
Legacy |
PEDL181 |
Humber |
East Midlands |
160.0 |
25% |
39,537 |
9,884 |
400 |
4.0 |
1.09 |
R14 |
PEDL273 |
Gainsborough North West JV |
East Midlands |
196.0 |
15% |
48,433 |
7,265 |
2142 |
15.6 |
4.29 |
R14 |
PEDL305 |
Gainsborough South JV |
East Midlands |
143.0 |
15% |
35,336 |
5,300 |
2142 |
11.4 |
3.13 |
R14 |
PEDL316 |
Gainsborough East JV 1 |
East Midlands |
111.0 |
15% |
27,429 |
4,114 |
2142 |
8.8 |
2.43 |
R14 |
PEDL339 |
Widmerpool 1 |
East Midlands |
191.0 |
30% |
47,197 |
14,159 |
2142 |
30.3 |
8.37 |
R14 |
PEDL343 |
Cloughton Area |
Cleveland Basin |
110.0 |
17.5% |
27,182 |
4,757 |
2142 |
10.2 |
2.81 |
R14 |
PEDL259 |
Stainmore Trough |
Cleveland Basin |
139.0 |
49.99% |
34,348 |
17,170 |
2142 |
36.8 |
10.15 |
R14 |
PEDL334 |
Humber Basin 1 |
East Midlands |
164.0 |
60.00% |
40,525 |
24,315 |
400 |
9.7 |
2.68 |
R14 |
PEDl278 |
Kirk Smeaton |
East Midlands |
38.0 |
50.00% |
9,390 |
4,695 |
2142 |
10.1 |
2.78 |
Total |
2,098.9 |
|
528,039 |
205,828 |
381.3 |
105.2 |
Source: Egdon, Edison Investment Research
Management
Mark Abbott – managing director: Mark is an experienced geophysicist and founding director of Egdon Resources. He graduated Nottingham University of Nottingham in 1985 with a degree in exploration sciences (geology/ geophysics/mining engineering). He worked for the British Geological Survey from 1985 to 1992 in the UK and overseas. Between 1992 and 1996 he worked in the International Division of British Gas Exploration and Production and was employed by Anadarko Algeria Corporation from 1996 to 1997. He is a council member of UKOOG and a trustee of the UK Onshore Geophysical Library. He is also a director of MA Exploration Services and Bishopswood Pavilion.
Jerry Field – technical director: Jerry has over 30 years’ oil industry experience in small-to-medium sized E&P companies (including Weeks Petroleum, Triton, Ranger, Canadian Natural Resources, Toreador and Northern Petroleum). Jerry has a breadth of experience of exploration in Europe, Africa, the Middle East and the Indian subcontinent and has spent a much of his career working in Egdon’s core areas of the UK onshore and France.
James Elston – commercial and business development director: James has 25 years’ experience in industry, banking and consulting. As CEO of TSX-V listed Realm Energy International in 2009/10, he drove the company’s acquisition of a significant acreage position for shale gas and tight oil in Europe following in-depth basin-by-basin technical review and ranking. He spent an initial five years working onshore E&P as an engineer at NAM in the Netherlands.
Martin Durham – exploration director: Martin graduated from the University of Wales in 1978 with a BSc degree in geology and also holds a MSc degree in petroleum geology from Imperial College, London (1982). Martin has significant industry experience gained through companies including the Louisiana Land and Exploration Inc, LASMO, Eni and Northern Petroleum. During this time, he has held senior technical and management roles for exploration and field development projects. Martin was founding director of Union Jack Oil, a position he held until his appointment to Egdon in September 2014. Martin is a Fellow of the Geological Society and in 2012 he was awarded Honorary Life Membership of the Petroleum Exploration Society of Great Britain.
Martin Brooks – HSE and Production Manager: Martin worked in various industries in the implementation and management of specific production, health, safety and environmental mechanisms and ensuring compliance with ISO14001, prior to joining Egdon in 2007. He now has over seven years’ experience of managing onshore oil and gas production activities including commissioning the Kirkleatham gas field development. He oversees Egdon’s planning and environmental permitting for the company’s UK onshore drilling activities and is also responsible for developing and implementing the company’s HSE management systems at both corporate and site-specific levels.
Financials: Balance sheet has net cash
Egdon’s short-term financials are largely driven by the timing of conventional projects and output from key producing fields such as Ceres. Volatility in earnings can be expected as a result, especially as fields are shut-in permanently or temporarily. Production guidance for FY18 is set at 100bopd – 110bopd; we see production reaching 160bopd for FY19, including a stronger contribution from Ceres, and currently assume Wressle first oil in FY20 (late CY19). Production volumes remain small, and as discussed earlier in this note, we believe the key value proposition for shareholders lies in the company’s net UK shale exposure and conventional E&A. Appraisal activity at Springs Road, where Egdon has a 14.5% equity interest, is carried by INEOS. Meanwhile, management expects to farm down equity at key appraisal projects such as Endeavour/Resolution ahead of drilling in 2019.
At end January 2018 Egdon had cash of £4.1m, which we expect to cover anticipated costs (post farm-down) alongside cash flow from operations through to end 2019. Investors should be aware of potential for further dilution if Egdon chooses to raise equity capital to fund ongoing G&A costs beyond 2019. Alternative financing options may become available contingent on success of current UK shale exploration/appraisal activity and the appraisal of key assets such as Biscathorpe, North Kelsey and Resolution/Endeavour.
Our long-term oil price assumption stands at 70$/bbl Brent (CY22) and we use short-term EIA assumptions of 62$/bbl Brent in CY18 and CY19.
Exhibit 6: Financial summary
£000's |
2016 |
2017 |
2018e |
2019e |
||
July |
IFRS |
IFRS |
IFRS |
IFRS |
||
PROFIT & LOSS |
||||||
Revenue |
|
1,586 |
1,039 |
1,113 |
2,065 |
|
Cost of Sales |
(1,287) |
(1,112) |
(1,129) |
(877) |
||
Gross Profit |
299 |
(73) |
(16) |
1,188 |
||
EBITDA |
|
(733) |
(1,193) |
(1,109) |
(1,109) |
|
Operating Profit (before amort. and except.) |
|
(2,652) |
(1,657) |
(1,967) |
(1,317) |
|
Intangible Amortisation |
0 |
0 |
0 |
0 |
||
Exceptionals |
0 |
0 |
0 |
0 |
||
Other |
0 |
0 |
0 |
0 |
||
Operating Profit |
(2,652) |
(1,657) |
(1,967) |
(1,317) |
||
Net Interest |
(34) |
(42) |
(20) |
0 |
||
Profit Before Tax (norm) |
|
(2,686) |
(1,699) |
(1,987) |
(1,317) |
|
Profit Before Tax (FRS 3) |
|
(2,686) |
(1,699) |
(1,987) |
(1,317) |
|
Tax |
0 |
0 |
0 |
0 |
||
Profit After Tax (norm) |
(2,686) |
(1,699) |
(1,987) |
(1,317) |
||
Profit After Tax (FRS 3) |
(2,686) |
(1,699) |
(1,987) |
(1,317) |
||
Average Number of Shares Outstanding (m) |
221 |
249 |
259 |
259 |
||
EPS - normalised (p) |
|
(1.2) |
(0.7) |
(0.8) |
(0.5) |
|
EPS - normalised and fully diluted (p) |
|
(1.2) |
(0.7) |
(0.8) |
(0.5) |
|
EPS - (IFRS) (p) |
|
(1.2) |
(0.7) |
(0.8) |
(0.5) |
|
Dividend per share (p) |
0.0 |
0.0 |
0.0 |
0.0 |
||
Gross Margin (%) |
18.8 |
N/A |
N/A |
N/A |
||
EBITDA Margin (%) |
N/A |
N/A |
N/A |
N/A |
||
Operating Margin (before GW and except.) (%) |
N/A |
N/A |
N/A |
N/A |
||
BALANCE SHEET |
||||||
Fixed Assets |
|
27,053 |
28,495 |
29,720 |
31,195 |
|
Intangible Assets |
18,370 |
19,231 |
21,246 |
24,026 |
||
Tangible Assets |
8,683 |
9,264 |
8,474 |
7,169 |
||
Investments |
0 |
0 |
0 |
0 |
||
Current Assets |
|
5,270 |
7,613 |
4,077 |
1,285 |
|
Stocks |
0 |
0 |
0 |
0 |
||
Debtors |
2,541 |
1,507 |
1,808 |
1,808 |
||
Cash |
2,679 |
6,057 |
2,219 |
(573) |
||
Other |
50 |
50 |
50 |
50 |
||
Current Liabilities |
|
(1,085) |
(1,216) |
(878) |
(878) |
|
Creditors |
(1,085) |
(1,216) |
(878) |
(878) |
||
Short term borrowings |
0 |
0 |
0 |
0 |
||
Long Term Liabilities |
|
(1,803) |
(2,187) |
(2,201) |
(2,201) |
|
Long term borrowings |
0 |
0 |
0 |
0 |
||
Other long term liabilities |
(1,803) |
(2,187) |
(2,201) |
(2,201) |
||
Net Assets |
|
29,435 |
32,705 |
30,718 |
29,401 |
|
CASH FLOW |
||||||
Operating Cash Flow |
|
(159) |
(422) |
(1,809) |
(12) |
|
Net Interest |
0 |
0 |
0 |
0 |
||
Tax |
0 |
0 |
0 |
0 |
||
Capex |
(2,379) |
(1,054) |
(2,167) |
(2,780) |
||
Acquisitions/disposals |
0 |
0 |
137 |
0 |
||
Equity Financing |
0 |
4,865 |
0 |
0 |
||
Other cash flow |
8 |
5 |
4 |
0 |
||
Net Cash Flow |
(2,529) |
3,394 |
(3,835) |
(2,792) |
||
Opening net debt/(cash) |
|
(5,180) |
(2,679) |
(6,057) |
(2,219) |
|
HP finance leases initiated |
0 |
0 |
0 |
0 |
||
Other |
(28) |
16 |
3 |
0 |
||
Closing net debt/(cash) |
|
(2,679) |
(6,057) |
(2,219) |
573 |
Source: Company accounts, Edison Investment Research
Appendix 1: UK shale overview
Thick organic rich Carboniferous shales extend across Europe from Poland in the east and through The Netherlands and the Southern North Sea to the Irish Sea in the west. This Namurian and Visean basin is present onshore in the UK in several sub-basins in Northern England and Southern Scotland. Conventional fields have produced gas across Europe with these Carboniferous shales as source rock. This Carboniferous source is exceptionally rich in the UK sourcing both conventional oil and gas fields. Shale drilling in the UK has been concentrated in the western portion of the Bowland sub-basin in Lancashire, one of a number of rift basins formed by crustal extension in the UK between late Devonian/Dinantian times.
BGS estimates suggest material gas in place
The Bowland Basin is one of the largest basins in the area and continues westwards beneath the East Irish Sea, where conventional gas fields Hamilton, Douglas and Lennox have produced c 4-5 TCF to date. The key stratigraphic interval within the basin is the Bowland-Hodder shale, which extends across a large area of central Britain and is of Visean to early Namurian age. The gas bearing shale section is in excess of 6,000ft and is intensely naturally fractured in the Bowland Basin. BGS/DECC estimated in 2013 that the Bowland –Hodder unit contains P50 gas in place of 1329 TCF.
|
Exhibit 7: Regional setting of Bowland basin, PEDL 165 (Cuadrilla operated) shaded red |
|
|
Source: Cuadrilla, modified from Fraser and Gawthorpe (2003) |
The Bowland-Hodder is made up of the Upper Bowland, Lower Bowland and Hodder Mudstone. The Upper Bowland consists of laterally continuous, organic rich zones dominated by clastic deposits with occasional thin sandstones and dolomitized limestones. The Lower Bowland is much thicker and is a highly variable formation comprising a wide range of lithologies, with calcareous mudstones, siltstones and sandstones being relatively abundant. Fewer wells have been drilled into the Lower Bowland, so that its regional continuity is unclear. In its 2013 Carboniferous Bowland Shale Gas Study, BGS/DECC assigned 264 TCF to the Upper Bowland and the remaining 1065 TCF to the lower unit.
|
Exhibit 8: Schematic cross-section of northern Bowland Basin |
|
|
Source: Cuadrilla, modified from Waters and Davies, 2006 |
Regional faulting and aquifers
The Carboniferous rocks are overlain by Permo-Triassic sediments. The Manchester Marl in the Permian is effectively a Zechstein sequence that forms a regional seal between the Carboniferous and the shallow water aquifers in the Sherwood Sandstone Group (SSG). Within Cuadrilla’s PEDL 165 licence, the UK Environment Agency has assessed the water in the SSG to the west of the Woodsfold Fault to be highly saline and therefore undrinkable, based on water samples from the Kirkham geothermal test hole. To the east of the Woodsfold Fault, the water in the SSG is fresh and considered to be the second most important groundwater aquifer in England after the Chalk. Cuadrilla views the risk of aquifer contamination as low - the depth of the interval to be fracked is several thousand feet below existing aquifers.
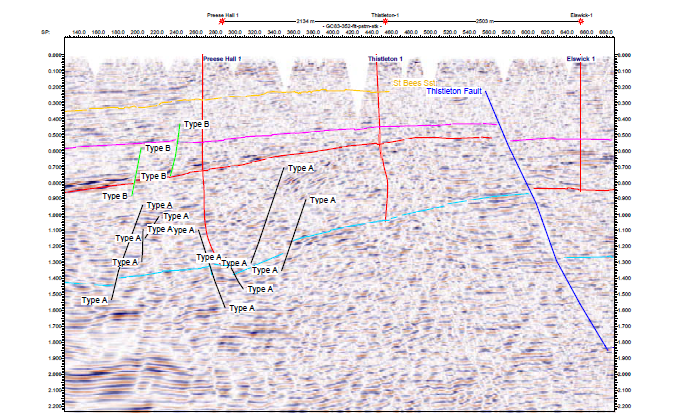
Faulting in the basin tends to a follow NE –SW trend. Within Cuadrilla’s PEDL 165 licence area the key faults are the Woodsfold fault and the Thistleton Fault. The Woodsfold fault is a major N-S fault with displacements up to 6,000ft in the Permian and Sherwood Sandstone and was the eastern boundary of the Elswick Graben in Permian times. The western boundary of the Elswick Graben is formed by the smaller Thistleton fault, which stops at the Permian anhydrite. The Thistleton fault sits around 3.5km to the east of Cuadrilla’s 2010 well, Preese Hall-1, while the Woodsfold fault is 9.4km from Preese Hall-1. A second type of faulting exists within the Bowland Shale, which is known to be heavily fractured and faulted. However, these faults are relatively small and are contained within the Bowland (Exhibit 7).
|
Exhibit 9: Reprocessed seismic showing the location of the Thistleton fault in relation to Preese Hall-1 |
|
|
Source: de Pater and Baisch, Geomechanical Study of Bowland Shale Seismicity 2011 |
Comparison of US and UK shale basins
Shale basins in the UK are significantly smaller in area relative to their North American counterparts, but tend to be much thicker. In addition, North American shale regions are simple continuous structures, while the UK basins are structurally more complex, consisting of small fault bounded basins that can be significantly faulted. The entire prospective area of the Bowland – Hodder shale was assessed by BGS/DECC to cover c 14,000km2, athlough this area also includes the Blacon, Gainsborough, Widmerpool, Edale and Cleveland basins in addition to the Bowland. Although shale thickness is greater in the UK basins, this can vary over relatively short distances, in contrast to US shale play thickness which is uniform over large distances. The Bowland Basin is considered to be most analogous to the Barnett, Marcellus and Fayetteville shales in the US.
Exhibit 10: UK versus US analogues
Play |
Depth (ft) |
Thickness (ft) |
Area (mi2) |
Bowland –Hodder play |
5,200 – 10,700 |
Up to 6,000 |
5,405 |
Barnett |
4,000 – 8,000 |
50-1,000 |
9,000 |
Marcellus |
2,000 – 10,000 |
Up to 660 |
75,000 |
Fayetteville |
1,500 – 6,500 |
50-550 |
5.853 |
Source: Edison Investment Research
Techniques for successfully drilling and stimulating shale gas wells have evolved across the US largely on a trial and error basis. While the UK shale plays will benefit from these advances in technology, operators will still need to go through a learning curve of their own to optimise results. Under the terms of its licence to drill in the Bowland, Cuadrilla has had to specify the chemicals and the volumes to be used prior to drilling the wells and this cannot be changed during the current drilling programme. By contrast, in the US, companies can alter these parameters once the well has been drilled and data has been gathered, allowing the flexibility to be reactive to well results in designing optimal fracking programmes.
The US experience also highlights that there can be a substantial difference between high and low producing wells within a play. Exhibit 11 shows observed production curves from the Barnett shale, where the top 20% of field production is driven by 7% of the wells. High producing wells are thought to be those where the fracture stimulation successfully connects to a pre-existing fracture network. In the UK it may take some time and experience to be able to tap into these higher producing sweet spots.
|
Exhibit 11: Barnett shale observed production curves, 2006-15 |
|
|
Source: The shale gas revolution: Barriers, sustainability and emerging opportunities by Middleton, Gupta, Hyman, Viswanathan |
Criteria for shale gas commercial success
The criteria required to define a successful shale gas play have been developed by the USGS in relation to the analogous shale gas plays in the US. These criteria are divided into those that are considered essential, and those that are desirable.
Exhibit 12: Successful shale gas play criteria
Minimum requirements |
Desirable characteristics |
Total organic content (TOC) > 2% |
High gamma-ray values in shale |
Kerogen Type Type I,II or IIS |
Hydrogen index > 250mg/g |
Vitrinite reflectance (Ro) > 1.1% (thermal maturity) |
Depth > 5000ft |
Net thickness > 50ft |
Not intensely structured |
Gas must be thermogenic |
Overpressured |
Minimum requirements |
Total organic content (TOC) > 2% |
Kerogen Type Type I,II or IIS |
Vitrinite reflectance (Ro) > 1.1% (thermal maturity) |
Net thickness > 50ft |
Gas must be thermogenic |
Desirable characteristics |
High gamma-ray values in shale |
Hydrogen index > 250mg/g |
Depth > 5000ft |
Not intensely structured |
Overpressured |
Source: USGS
On this basis, initial indications are promising for a successful shale gas play in the Bowland Shale. The Bowland shale is of a thickness and depth to satisfy the criteria, while results from the first shale gas well in the Bowland Basin, Preese Hall-1, have demonstrated that the Bowland Shale is thermally mature for gas. The total organic content (TOC) has been found to vary through the stratigraphy, with the highest values found within the Bowland Shale. The average TOC was 2.65% with a range of 1% to 7% in the cored intervals. The data on kerogen type is less clear. The presence of humic material indicates Type III, however Type I/II is implied at the top of the sampled section. The Bowland is more intensely structured than the shale plays in North America; however, the presence of 3D seismic over 100km2 of PEDL 165 will allow wells to be drilled away from existing faults. This structural complexity reduces to the east of the Pennines in basins such as the Gainsborough Trough. A key desirable characteristic that is not currently known is the level of overpressure, if any, that exists in the Bowland. The minerology of the Lancashire Bowland shale has been analysed using x-ray diffraction of shale core samples from the Preese Hall well, and has confirmed that both the Upper and Lower Bowland shales are well suited to hydraulic fracturing. This is due to the highly siliceous matrix and low overall clay content. Cuadrilla recently retained consultancy Anderson Thompson to produce a probabilistic-type curve for the Bowland shale based on available data and the consultancy’s specialist knowledge of the Permian, Eagle Ford, Bakken, Marcellus and Montney shale in North America. The result of this analysis is shown in Exhibit 13, with the predicted P50-type curve for a 2.5km horizontal well. We use this type curve as well as the P10 and P90 range associated with this curve in our probabilistic UK shale valuation.
|
Exhibit 13: Anderson Thompson modelled potential gas recovery from 2.5km Bowland horizontal well |
Exhibit 14: Minerology of Lancashire Bowland shale |
|
|
|
Source: Cuadrilla |
Source: Cuadrilla |
|
Exhibit 13: Anderson Thompson modelled potential gas recovery from 2.5km Bowland horizontal well |
|
|
Source: Cuadrilla |
|
Exhibit 14: Minerology of Lancashire Bowland shale |
|
|
Source: Cuadrilla |
|
||||||||||||||||||||||||||||||||||||||||||||||||||||||
|
|
Research: Industrials
The relative de-rating of Cohort against its peers since its interim results in December seems somewhat anomalous. The company looks set to maintain solid progress in FY18, which is now coming to a close. Peers in the UK defence sector have continued to face issues that do not directly read across to Cohort. While the UK defence funding environment remains uncertain at present, there appear to be some indications that a more favourable perspective may be developing following recent events. We maintain our forecasts and our fair value currently stands at 508p.