Last close As at 05/08/2026
GBP2.91
▲ 1.00 (0.34%)
Market capitalisation
GBP504m
Research: Investment Companies
Utilico Emerging Markets Trust (UEM) has been managed by Charles Jillings at ICM Group since the fund was launched in 2005. He continues to find interesting infrastructure and utility investment opportunities in emerging markets. The manager notes that investee companies have strong earnings growth, supporting higher dividend payments; however, he says that company valuations have not kept pace with earnings growth, providing opportunities for revaluation. Jillings is constructive on the outlook for emerging market equities, and comments that a resolution to the US-China trade dispute would be beneficial for most regions. He is optimistic regarding a positive outcome, given the high importance to both parties in reaching an agreement.
Utilico Emerging Markets Trust |
Finding attractively valued growth opportunities |
Investment trusts |
25 April 2019 |
Share price/discount performance
Three-year performance vs index
Gearing
Analysts
|
|||||||||||||||||||||||||||||||||||||||||||||||||||||||||||||||||||||||||||||||||||||||||
Utilico Emerging Markets Trust (UEM) has been managed by Charles Jillings at ICM Group since the fund was launched in 2005. He continues to find interesting infrastructure and utility investment opportunities in emerging markets. The manager notes that investee companies have strong earnings growth, supporting higher dividend payments; however, he says that company valuations have not kept pace with earnings growth, providing opportunities for revaluation. Jillings is constructive on the outlook for emerging market equities, and comments that a resolution to the US-China trade dispute would be beneficial for most regions. He is optimistic regarding a positive outcome, given the high importance to both parties in reaching an agreement.
|
NAV outperformance versus the MSCI Emerging Markets index over the last year – particularly over the last six months |
|
|
Source: Refinitiv, Edison Investment Research |
The market opportunity
Expectations for economic growth in emerging markets continue to meaningfully exceed those for developed economies. In addition, in aggregate, valuation differentials favour emerging markets in terms of both lower earnings multiples and higher dividend yields.
Why consider investing in Utilico Emerging Markets?
■
A specialist fund offering exposure to infrastructure and utility assets with structural growth drivers, in emerging markets, offering a 3.2% dividend yield.
■
The majority of investee companies are profitable and generating cash flows.
■
Managed by highly experienced team that forges strong relationships with the companies in which they invest.
■
Since inception, UEM’s NAV total return has compounded at 11.0% pa.
Progressive distribution policy
UEM’s current 11.0% discount to cum-income NAV compares with the 9.3% to 12.8% range of average discounts over the last one, three, five and 10 years. The trust has a progressive dividend policy; annual distributions have increased or been maintained since the fund was launched (July 2005). UEM currently offers a dividend yield of 3.2%. It can gear and has a £50m committed bank facility (1.1% net debt position at end-March 2019).
Exhibit 1: Trust at a glance
Investment objective and fund background |
Recent developments |
|||||||||||||||||||||||||||||||||||||||||||||||||||||||||||||||||||
Utilico Emerging Markets Trust’s investment objective is to provide long-term total return by investing predominantly in infrastructure, utility and related equities mainly in emerging markets. |
■ 18 February 2019: Announcement of third quarterly interim dividend of 1.80p per share. ■ 21 November 2018: Six-month results to 30 September 2018. NAV TR -7.5% versus MSCI Emerging Markets Index TR -2.0%. Share price TR -6.7%. ■ 19 November 2018: Announcement of second quarterly interim dividend of 1.80p per share. |
|||||||||||||||||||||||||||||||||||||||||||||||||||||||||||||||||||
Forthcoming |
Capital structure |
Fund details |
||||||||||||||||||||||||||||||||||||||||||||||||||||||||||||||||||
AGM |
September 2019 |
Ongoing charges |
1.1% |
Group |
ICM Group |
|||||||||||||||||||||||||||||||||||||||||||||||||||||||||||||||
Final results |
June 2019 |
Net gearing |
1.1% |
Manager |
Charles Jillings |
|||||||||||||||||||||||||||||||||||||||||||||||||||||||||||||||
Year end |
31 March |
Annual mgmt fee |
0.65% |
Address |
PO Box 208, |
|||||||||||||||||||||||||||||||||||||||||||||||||||||||||||||||
Dividend paid |
September, December, March, June |
Performance fee |
15% of outperformance (cap: 1.85% of average net assets) |
|||||||||||||||||||||||||||||||||||||||||||||||||||||||||||||||||
Launch date |
20 July 2005 |
Trust life |
Indefinite (subject to vote) |
Phone |
+44 (0)1372 271486 |
|||||||||||||||||||||||||||||||||||||||||||||||||||||||||||||||
Continuation vote |
Five yearly, next 2021 AGM |
Loan facilities |
£50m |
Website |
||||||||||||||||||||||||||||||||||||||||||||||||||||||||||||||||
Dividend policy and history (financial years) |
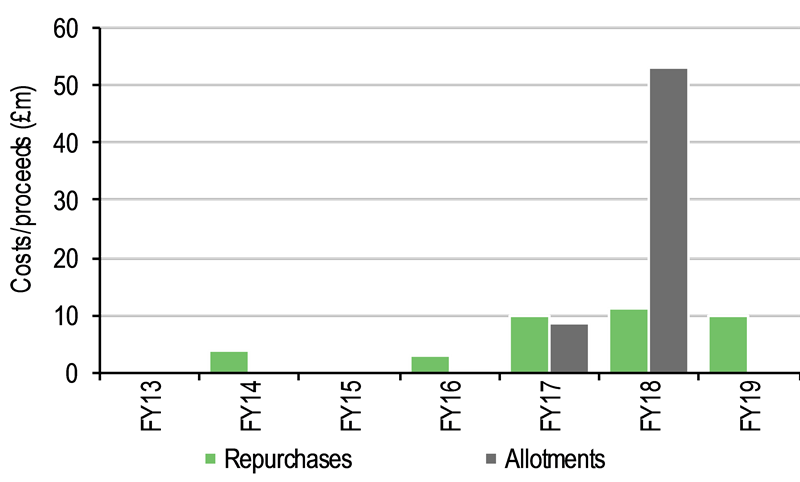
Share buyback policy and history (financial years) |
|||||||||||||||||||||||||||||||||||||||||||||||||||||||||||||||||||
The trust is managed for total return, but the board broadly seeks flat or rising dividends. |
Subject to annual renewal, UEM has authority to repurchase up to 14.99% and allot shares up to 10% of the issued share capital. Allotments include exercise of subscription shares. |
|||||||||||||||||||||||||||||||||||||||||||||||||||||||||||||||||||
|
|
|||||||||||||||||||||||||||||||||||||||||||||||||||||||||||||||||||
Shareholder base (as at 29 March 2019) |
Portfolio exposure by sector (look through as at 31 March 2019) |
|||||||||||||||||||||||||||||||||||||||||||||||||||||||||||||||||||
|
|
|||||||||||||||||||||||||||||||||||||||||||||||||||||||||||||||||||
Top 10 holdings (as at 31 March 2019) |
||||||||||||||||||||||||||||||||||||||||||||||||||||||||||||||||||||
|
||||||||||||||||||||||||||||||||||||||||||||||||||||||||||||||||||||
Source: Utilico Emerging Markets Trust, Edison Investment Research, Bloomberg, Morningstar. Note: *N/A where not in end-March 2018 top 10.
Market outlook: Superior growth, attractive valuations
The International Monetary Fund has recently released its April 2019 World Economic Outlook. The growth forecasts for emerging market economies remain superior to those for advanced economies (4.4% versus 1.8% for 2018 and 4.8% versus 1.7% for 2020 – driven largely by Asian growth prospects). Factors contributing to this higher growth include: favourable demographics with a growing working-age population; a rapidly growing middle class with high standards of education; and robust levels of infrastructure spending.
As shown in Exhibit 2 (right-hand side), emerging market equities are trading on relatively attractive forward earnings and price-to-book multiples, while offering above-average dividend yields. This backdrop of superior growth expectations in emerging markets, coupled with relatively attractive valuations, may appeal to UK investors seeking overseas equity exposure.
|
Exhibit 2: Market performance and valuation |
|
Indices’ total return performance (£-adjusted, past five years) |
Indices valuation metrics as at 31 March 2019 |
|
|
|
Source: Refinitiv, MSCI, Edison Investment Research |
|
Fund profile: EM infrastructure and utility specialist
Launched in July 2005, and historically domiciled in Bermuda as an investment company, UEM re-domiciled to the UK as an investment trust via a scheme of arrangement on 3 April 2018. Following the fund’s move to the UK, there has been no change in the investment objective or dividend policy. The trust is managed by the ICM Group (ICM and ICM Investment Management, a specialist fund manager, based in Bermuda and the UK, with c $18bn of assets under influence as at end-2018). Since launch, the lead manager has been Charles Jillings, a qualified chartered accountant with more than 30 years’ experience in global financial markets. He aims to generate attractive long-term total returns from a diversified portfolio of emerging market equities, primarily in the infrastructure, utility and related sectors.
Stocks are selected on a bottom-up basis and the manager is unconstrained by benchmark allocations, although the MSCI Emerging Markets Index is used in this report as a reference. UEM’s portfolio typically contains 60–90 positions (89 at end-H119). The benchmark for the trust’s performance fee is the UK Gilt five- to 10-year index post-tax yield, plus RPIX inflation, plus 2%, subject to an 8% minimum and capped at 1.85% of average NAV. In order to mitigate risk, there are internal investment limits in place (as a percentage of gross assets): individual investment – 10%; top 10 holdings – 60%; single country – 30%; individual sector – 25%; and unquoted companies – 5%. Gearing of up to 25% of gross assets is permitted; at end-March 2019, UEM had net gearing of 1.1%. Since launch, the trust’s NAV total return has compounded at 11.0% per annum.
The fund manager: Charles Jillings
The manager’s view: Constructive on the investment outlook
Manager Charles Jillings sees the current investment backdrop as clouded by two issues, both of which have binary outcomes: the US-China trade dispute and Brexit. He says that resolution of trade tensions would be beneficial for both the US and China, and also for the rest of the world; while he believes that a ‘hard’ Brexit would be negative for global growth, given the UK is the fifth-largest economy and the negative impacts on European economic activity could also be meaningful. Jillings says that the number one overhanging issue is US-China relations, and he expects an agreement to be reached, given the high importance of a settlement to each of the countries. When this happens, the manager says there should be a positive global economic impact, and he would also expect stock markets to react favourably, driven by improved earnings and higher valuations.
Commenting on the outlook for emerging markets in particular, Jillings says they are “reasonably well set” as equities have pulled back and valuations are undemanding. He says that UEM should benefit in particular from infrastructure spending in China and Brazil, while the latter is also undergoing a privatisation cycle, potentially creating new investment opportunities. While he believes that the US dollar should remain robust versus emerging market currencies, given that interest rates in developing countries are likely to be reduced rather than rise, he does not consider this too great an impediment for economic growth prospects.
The manager has recently returned from a trip to South America, and comments that UEM’s Argentinian positions are as attractive as other holdings in the portfolio in terms of asset quality, the strength of corporate management teams, and valuations. However, the country needs political stability before there is a clear view of earnings prospects, and there is a very sharp division between the left and right political parties ahead of the October 2019 presidential election. Jillings says that in Brazil, there have been significant new infrastructure concessions awarded. He notes that portfolio company Alupar Investimento is benefiting from building out its pipeline of projects, and is generating higher returns on capital than initially expected. The manager also believes there is a better regulatory framework in the country, as President Jair Bolsonaro has market-friendly advisers in place who are delivering favourable regulatory outcomes. Jillings also notes that in the offshore oil industry, major tenders have recently been awarded for pre-salt oil projects, running into billions of US dollars, which should be a positive boost for the Brazilian economy. He says that in aggregate, over the last six months, corporate earnings in Brazil have been stronger than expected; companies have been building out assets that provide operational leverage, and have benefited from lower interest rates and input costs.
Asset allocation
Investment process: In-depth fundamental research
Jillings and the ICM investment team seek undervalued companies, primarily in the infrastructure, utility and related sectors in emerging markets that have the potential to generate total returns of at least 15% pa. The majority of investee companies are backed by hard assets and are cash generative (operational businesses rather than greenfield investments). Favoured countries for investment are politically stable with a robust legal framework, a resilient economy and a positive attitude towards foreign investment. Jillings selects stocks on a bottom-up basis from a bespoke universe of c 900 potential investee companies. Any company considered for inclusion in UEM’s portfolio undergoes thorough fundamental analysis, including construction of detailed financial models and valuation targets, and meeting company managements and undertaking site visits are key elements of the research process. An ideal investment is in a company with operational leverage, generating strong cash flows, run by a strong management team with a good corporate governance track record, which also offers an attractive dividend yield that can provide a level of support in periods of stock market weakness.
The manager has a long-term investment horizon, avoiding short-term stock market ‘noise’. He explains that due to the nature of UEM’s investments, the trust has tended to underperform the MSCI Emerging Markets Index during a cyclical upturn led by sectors such as technology, financials and consumer discretionary, while outperforming in a falling market.
Current portfolio positioning
Compared with a year ago, UEM’s top 10 holding concentration is somewhat higher, 37.5% at end-March 2019 (31.8% 12 months earlier – see Exhibit 1). Jillings is keen to stress that all of UEM’s investments are made on a bottom-up basis. However, for illustrative purposes in Exhibit 3 we show exposure changes over the 12 months ending March 2019. The most significant changes are a higher weighting in Brazil (+5.9pp) and reduced Argentinian exposure (-6.8pp), with a higher weighting in waste and water (+2.6pp) and lower exposure to electricity assets (-4.1pp). Currently c 3% of the fund is held in unlisted companies and around three-quarters of portfolio companies pay a dividend.
The manager comments on UEM’s Romanian exposure, which has declined (-3.8pp) over the last 12 months. On 19 December 2018, the Bucharest Stock Exchange Trading Index fell by more than 10% following a surprise ‘tax on greed’ announced by the Romanian government, which aimed to raise c $2.5bn by, among other measures, imposing a tax on the assets of bank and energy companies. Following a widespread backlash, the government has watered down its proposals and the Romanian stock market has largely recovered from its December 2018 losses. Jillings reiterates that UEM’s investments in the country remain highly cash generative with strong dividend streams, and are backed by long-duration assets.
Exhibit 3: Portfolio geographic and industry exposure (% unless stated)
Geography |
Portfolio end-March 2019 |
Portfolio end- March 2018 |
Change (pp) |
Industry |
Portfolio end-March 2019 |
Portfolio end- March 2018 |
Change (pp) |
|
Brazil |
29.0 |
23.1 |
5.9 |
Electricity |
20.0 |
24.1 |
(4.1) |
|
China incl. Hong Kong |
20.3 |
17.2 |
3.1 |
Gas |
15.8 |
17.7 |
(1.9) |
|
Philippines |
8.3 |
5.6 |
2.7 |
Ports |
15.0 |
12.5 |
2.5 |
|
Romania |
7.0 |
10.8 |
(3.8) |
Road and rail |
10.4 |
8.5 |
1.9 |
|
Other Latin America |
6.1 |
4.0 |
2.1 |
Telecoms & satellites |
9.1 |
7.5 |
1.6 |
|
Middle East/Africa |
5.8 |
6.5 |
(0.7) |
Airports |
7.0 |
10.5 |
(3.5) |
|
India |
5.8 |
5.7 |
0.1 |
Other |
6.8 |
9.2 |
(2.4) |
|
Other Asia |
4.4 |
3.8 |
0.6 |
Water and waste |
6.8 |
4.2 |
2.6 |
|
Other Europe |
4.4 |
5.1 |
(0.7) |
Renewables |
5.9 |
3.8 |
2.1 |
|
Argentina |
3.4 |
10.2 |
(6.8) |
Infrastructure inv funds |
3.2 |
2.0 |
1.2 |
|
Chile |
2.9 |
4.0 |
(1.1) |
|||||
Malaysia |
1.9 |
3.2 |
(1.3) |
|||||
Thailand |
0.7 |
0.8 |
(0.1) |
|||||
100.0 |
100.0 |
|
100.0 |
100.0 |
Source: Utilico Emerging Markets Trust, Edison Investment Research
UEM provides regular detailed information on its top 20 holdings; two relatively recent additions to the list are Cosan Logistica and Cia de Saneamento do Paraná (Sanepar). Cosan Logistica (72.5% owned by Cosan) currently owns 28.5% of rail operator Rumo (also in the portfolio) and provides exposure to the company at a meaningful discount to Rumo’s standalone valuation. Sanepar is one of the largest water and waste management companies in Brazil, providing services to residential, commercial and industrial customers; the stock has appreciated meaningfully so far this year. One of UEM’s positions that is no longer in the top 20 is Malaysia Airports Holdings. The position size was reduced due to concerns about its upcoming concession renewal taking longer than expected, and uncertainty around the terms of the new regulatory framework. Also, a weaker Malaysian economy, affected by the new government’s anti-corruption agenda (a policy that tends to slow economic activity), has been negatively affecting the company’s passenger numbers.
Performance: Solid long-term returns
Exhibit 4: Five-year discrete performance data
12 months ending |
Share price |
NAV |
MSCI Emerging |
MSCI EM Infrastructure |
Performance fee |
31/03/15 |
8.2 |
12.4 |
13.2 |
13.1 |
8.0 |
31/03/16 |
(1.8) |
(0.3) |
(8.8) |
(5.5) |
8.0 |
31/03/17 |
24.3 |
22.8 |
35.2 |
24.0 |
8.0 |
31/03/18 |
2.8 |
6.1 |
11.8 |
(1.8) |
8.0 |
31/03/19 |
5.5 |
3.4 |
0.1 |
2.8 |
8.0 |
Source: Refinitiv. Note: All % on a total return basis in pounds sterling. Performance fee benchmark subject to an 8% minimum from April 2014. MSCI indices are shown for illustrative purposes.
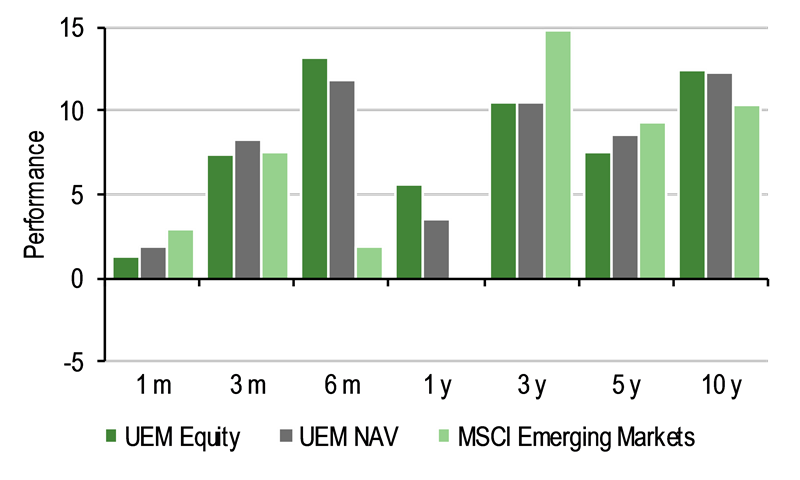
While emerging markets can be volatile, as shown in Exhibit 5 (RHS), UEM has generated solid total returns averaging 12.3% pa over the last decade in both NAV and share price terms.
|
Exhibit 5: Investment trust performance to 31 March 2019 |
|
Price, NAV and index total return performance, one-year rebased |
Price, NAV and index total return performance (%) |
|
|
|
Source: Refinitiv, Edison Investment Research. Note: Three, five and 10-year performance figures annualised. |
|
UEM’s relative returns are shown in Exhibit 6; it has outperformed the MSCI Emerging Markets Index over one and 10 years, while lagging over three and five years. However, arguably a more relevant measure, given the nature of its investments, is its performance versus the MSCI Emerging Markets Infrastructure Index – UEM has outperformed this index over one, three, five and 10 years in both NAV and share price terms. Jillings highlights the trust’s strong relative performance over the last six months. He says this is largely attributable to the large weighting in Brazil (c 30% of the fund), where there was a conscious decision to increase exposure in anticipation of a positive outcome in the 2018 Brazilian presidential election. The manager also notes that some of UEM’s holdings in the gas sector have performed well such as China Resources Gas and Comgas, which received a takeover bid at a higher than 20% premium (although the manager believes that the bid price does not fully reflect the fair value of the company).
Exhibit 6: Share price and NAV total return performance, relative to indices (%)
|
One month |
Three months |
Six months |
One year |
Three years |
Five years |
10 years |
Price relative to MSCI Emerging Markets |
(1.7) |
(0.1) |
11.0 |
5.5 |
(10.8) |
(8.2) |
19.5 |
NAV relative to MSCI Emerging Markets |
(1.1) |
0.7 |
9.7 |
3.4 |
(10.9) |
(3.2) |
18.9 |
Price relative to MSCI EM Infrastructure |
(0.1) |
2.3 |
5.4 |
2.7 |
7.7 |
7.0 |
38.1 |
NAV relative to MSCI EM Infrastructure |
0.4 |
3.1 |
4.3 |
0.6 |
7.5 |
12.8 |
37.4 |
Price relative to FTSE All-Share |
(1.4) |
(1.9) |
15.2 |
(0.8) |
2.7 |
6.5 |
11.7 |
NAV relative to FTSE All-Share |
(0.8) |
(1.1) |
13.9 |
(2.8) |
2.6 |
12.3 |
11.1 |
Price relative to performance fee benchmark* |
0.6 |
5.4 |
8.9 |
(2.3) |
7.1 |
(2.5) |
52.1 |
NAV relative to performance fee benchmark* |
1.2 |
6.2 |
7.6 |
(4.2) |
7.0 |
2.8 |
51.4 |
Source: Refinitiv, Edison Investment Research. Note: Data to end-March 2019. Geometric calculation. *Benchmark for performance fee is UK Gilt five- to 10-year post-tax yield, plus RPIX, plus 2%, subject to an 8% minimum from 1 April 2014.
|
Exhibit 7: NAV total return performance relative to MSCI EM index over five years |
|
|
Source: Refinitiv, Edison Investment Research |
Discount: Narrowed in recent months
UEM is currently trading at a 11.0% discount to cum-income NAV, which compares with an 8.6% to 16.9% range over the last 12 months. The 16.9% discount reached in October 2018 was the widest in the last decade; the narrowing of the discount in recent months may have been supported by UEM’s simplified capital structure (now registered as a UK investment trust with no subscription shares). Over the last one, three, five and 10 years, the trust has traded at average discounts of 12.8%, 11.8%, 10.4% and 9.3%, respectively. The board actively monitors the discount, and is inclined, but not committed, to buy back shares when the discount exceeds 10% (up to a maximum 14.99% of the shares in issue each year). So far in FY19, c 5.0m shares have been repurchased (2.1% of the end-FY18 share base) at a cost of £9.9m. UEM was restricted from purchasing any shares between the re-domicile date in April 2018 and mid-August 2018, due to the timing of a capital reduction to create distributable reserves. There is also the potential for periodic discretionary tender offers, although so far none have been undertaken.
|
Exhibit 8: Share price discount to NAV (including income) over three years (%) |
|
|
Source: Refinitiv, Edison Investment Research |
Capital structure and fees
Following the final exercise of subscription shares in February 2018, UEM has had a single class of share; there are currently 229.8m ordinary shares in issue. The trust has a three-year unsecured £50m revolving credit facility with Scotiabank Europe (expiring on 3 April 2021), and at end-March 2019, net gearing was a modest 1.1%.
UEM pays ICM an annual management fee of 0.65% of NAV. In H119, annualised ongoing charges were 1.1%; modestly higher than 1.0% in FY18. Subject to an 8% minimum hurdle, a 15% performance fee on returns above the UK gilt five- to 10-year index post-tax yield plus RPIX inflation plus 2% is payable; the NAV must exceed the high watermark NAV from when the performance fee was last paid (adjusted for capital events and dividends). The performance fee is capped at 1.85% of net assets, and is paid 50% in shares and 50% in cash.
Dividend policy and record
UEM’s board has a progressive dividend policy, and annual dividends have been increased or maintained each year since the fund launched in 2005. Distributions may be made from income or capital and are paid quarterly in September, December, March and June. Annual dividends have compounded at 3.8% pa over the last five years; UEM’s FY18 7.00p per share total dividend was 5.3% higher year-on-year, and was 1.3x covered by revenue. FY18 income was boosted by higher dividends from investee companies, and from UEM’s larger Latin American exposure (typically a higher-yielding region). So far in FY19, three interim dividends of 1.80p per share have been paid (total of 5.40p), which in aggregate is 3.8% higher than the 5.20p sum of the first three interim dividends paid in FY18. Based on its current share price, UEM has a dividend yield of 3.2%.
Peer group comparison
UEM is a member of the AIC Global Emerging Markets sector. In Exhibit 9, we highlight the eight funds in this group that have a market cap greater than £100m and have been trading for more than a year. While UEM offers a unique investment proposition in infrastructure and utility assets, a comparison with its peers provides some perspective. The trust’s NAV total return is well above average over 10 years (ranking second out of five funds), while lagging the averages by varying degrees over the other periods shown. However, the dilutive effect of UEM’s historic subscription shares is not adjusted for, so UEM’s actual NAV total returns are higher than the reported numbers. The trust’s discount is wider than the mean; its ongoing charge is below average, although it is one of two funds eligible for a performance fee. UEM’s dividend yield is the third highest in the selected peer group, 1.1pp above the average.
Exhibit 9: Selected peer group as at 25 April 2019*
% unless stated |
Market cap (£m) |
NAV TR |
NAV TR |
NAV TR |
NAV TR |
Discount (cum-fair) |
Ongoing charge |
Perf. |
Net gearing |
Dividend yield (%) |
Utilico Emerging Markets Trust |
512.5 |
4.1 |
34.7 |
48.7 |
186.0 |
(10.4) |
1.1 |
Yes |
101 |
3.2 |
Aberdeen Emerging Markets |
268.9 |
2.0 |
46.2 |
54.8 |
119.2 |
(13.6) |
1.0 |
No |
104 |
0.3 |
BlackRock Frontiers |
330.9 |
(8.3) |
41.5 |
42.5 |
|
(0.0) |
2.0 |
Yes |
117 |
4.2 |
Fundsmith Emerging Equities Trust |
331.7 |
2.4 |
28.2 |
|
|
0.3 |
1.8 |
No |
100 |
0.2 |
Genesis Emerging Markets Fund |
997.4 |
6.0 |
47.8 |
51.4 |
179.4 |
(12.1) |
1.5 |
No |
100 |
2.0 |
JPMorgan Emerging Markets |
1,188.9 |
12.9 |
66.4 |
85.9 |
210.4 |
(8.5) |
1.0 |
No |
100 |
1.3 |
JPMorgan Global Emerging Markets |
406.6 |
9.4 |
54.0 |
53.6 |
|
(1.5) |
1.3 |
No |
108 |
3.6 |
Templeton Emerging Markets |
1,984.3 |
9.2 |
74.4 |
55.5 |
181.4 |
(10.0) |
1.1 |
No |
102 |
1.9 |
Average |
752.6 |
4.7 |
49.2 |
56.1 |
175.3 |
(7.0) |
1.3 |
104 |
2.1 |
|
UEM rank (out of eight funds) |
4 |
5 |
7 |
6 |
2 |
6 |
5 |
5 |
3 |
Source: Morningstar, Edison Investment Research. Note: *Performance data as at 24 April 2019 based on ex-par NAV. TR = total return. Net gearing is total assets less cash and equivalents as a percentage of net assets.
The board
There are five non-executive directors on UEM’s board, of which four are independent of the manager. The chairman is John Rennocks (appointed to the board in November 2015, chairman since September 2016). The other directors and their dates of appointment are: Garry Madeiros (June 2007); Anthony Muh (October 2010); Susan Hansen (September 2013); and Garth Milne (November 2014). Hansen is considered to be non-independent as she is also on the board of a company associated with ICM. UEM’s manager Charles Jillings stood down from the board in March 2012 to increase its independence and improve corporate governance. Directors’ fees are paid in UEM shares, ensuring all shareholders’ interests are aligned.
|
|
Investment Companies
Research: TMT
Thinfilm’s recent investor update provided details on how its revised strategy, focused on driving market adoption of its NFC solutions, will potentially take the company to break-even in FY21. We will update our estimates to reflect the information given in the presentation.