Last close As at 05/08/2026
—
— 0.00 (0.00%)
Market capitalisation
—
Research: Investment Companies
Fidelity China Special Situations
Fidelity China Special Situations |
Outperformance from a broad portfolio of stocks |
Investment trusts |
6 September 2016 |
Share price/discount performance
Three-year cumulative perf. graph
Gearing
Analysts
|
|||||||||||||||||||||||||||||||||||||||||||||||||||||||||||||||||||||||||||||||||||||
Fidelity China Special Situations (FCSS) is an actively managed fund seeking long-term capital growth from investment in Chinese companies. The manager focuses on faster-growing consumer-oriented sectors and a large percentage of the portfolio is invested in mid- and small-cap stocks, which are often under-researched with valuations not reflecting the quality and potential of the business. Absolute performance has been strong and FCSS has outperformed its MSCI China index benchmark over one, three and five years and since inception, achieving substantial outperformance of open- and closed-ended peers over one, three and five years.
12 months ending |
Total share price return (%) |
Total NAV return (%) |
MSCI China (%) |
MSCI World (%) |
FTSE All-Share (%) |
31/08/12 |
(16.6) |
(17.3) |
(5.7) |
11.5 |
10.2 |
31/08/13 |
29.5 |
37.0 |
17.5 |
21.5 |
18.9 |
31/08/14 |
26.1 |
29.2 |
9.8 |
13.4 |
10.3 |
31/08/15 |
6.3 |
10.8 |
(1.9) |
4.1 |
(2.3) |
31/08/16 |
41.7 |
43.2 |
27.2 |
26.0 |
11.7 |
Note: Twelve-month rolling discrete £-adjusted total return performance.
Investment strategy: Looking for mispriced assets
Since April 2014, FCSS has been managed by Dale Nicholls. Drawing on Fidelity’s significant regional resources (12 analysts dedicated to Chinese equities), he seeks undervalued companies with long-term growth potential, robust cash flow generation and strong management teams, with company visits and management meetings comprising an important part of the investment process. Stock selection is bottom-up and unconstrained by benchmark allocations, resulting in a diversified portfolio of c 130-140 holdings, with a bias towards consumer discretionary and technology stocks. Gearing is permitted up to 30% of NAV and the maximum exposure to unlisted securities has recently been increased from 5% to 10%.
Market outlook: Potential for improvement
A bursting of the Chinese equities bubble in summer 2015 and a further market decline in early 2016 has led to attractive valuations; the forward P/E multiple of the market versus world indices is close to five-year lows, with return on equity higher than in developed markets. Although lower than the last 20 years, the IMF forecasts China’s medium-term GDP growth to be higher than most other emerging and developed markets. Multi-year demand is driven by China’s growing middle class and the shift from an investment- to a consumption-led economy, which should lead to higher quality and more sustainable growth. Investors may be attracted to a fund specialising in Chinese equities with a positive long-term performance track record.
Valuation: Discount in a widening trend
Despite strong investment performance, FCSS’s current share price discount to cum-income NAV of 14.6% is wider than the averages of the last three and five years, providing significant scope for narrowing if sentiment towards Chinese equities improves. Although managed for capital growth, FCSS shares yield 1.1%, with its dividend compounding at an annual rate of c 25% over the last four years.
Exhibit 1: Trust at a glance
Investment objective and fund background |
Recent developments |
|||||||||||||||||||||||||||||||||||||||||||||||||||||||||||||||||||||||||||||||||||||||||||||||||||||||||||
Fidelity China Special Situations aims to achieve long-term capital growth from an actively managed portfolio made up primarily of securities issued by companies listed in China or Hong Kong and Chinese companies listed elsewhere. It may also invest in listed companies with significant interests in China and Hong Kong. Futures, options and contracts for difference (CFDs) are used to provide gearing, as well as to take short positions. |
■ 22 July 2016: Nicholas Bull appointed as chairman of the board following the retirement of John Owen. ■ 2 June 2016: Final results for 12 months to 31 March 2016. NAV TR +0.02% versus benchmark -16.17%. Share price total return -4.53%. ■ 21 March 2016: Vera Hong Wei appointed as a non-executive director. |
|||||||||||||||||||||||||||||||||||||||||||||||||||||||||||||||||||||||||||||||||||||||||||||||||||||||||||
Forthcoming |
Capital structure |
Fund details |
||||||||||||||||||||||||||||||||||||||||||||||||||||||||||||||||||||||||||||||||||||||||||||||||||||||||||
AGM |
July 2017 |
Ongoing charges |
1.20% (2.20% incl. perf. fee) |
Group |
Fidelity International |
|||||||||||||||||||||||||||||||||||||||||||||||||||||||||||||||||||||||||||||||||||||||||||||||||||||||
Interim results |
November 2017 |
Net market gearing* |
23.9% |
Managers |
Dale Nicholls |
|||||||||||||||||||||||||||||||||||||||||||||||||||||||||||||||||||||||||||||||||||||||||||||||||||||||
Year end |
31 March |
Annual mgmt fee |
1.0% of net assets |
Address |
Beech Gate, Millfield Lane, Lower Kingswood, Tadworth, KT20 6RP |
|||||||||||||||||||||||||||||||||||||||||||||||||||||||||||||||||||||||||||||||||||||||||||||||||||||||
Dividend paid |
July |
Performance fee |
See page 7 |
|||||||||||||||||||||||||||||||||||||||||||||||||||||||||||||||||||||||||||||||||||||||||||||||||||||||||
Launch date |
April 2010 |
Trust life |
Indefinite |
Phone |
0800 41 41 10 |
|||||||||||||||||||||||||||||||||||||||||||||||||||||||||||||||||||||||||||||||||||||||||||||||||||||||
Continuation vote |
No |
Loan facilities |
US$150m revolving |
Website |
||||||||||||||||||||||||||||||||||||||||||||||||||||||||||||||||||||||||||||||||||||||||||||||||||||||||
Dividend policy and history |
Share buyback policy and history |
|||||||||||||||||||||||||||||||||||||||||||||||||||||||||||||||||||||||||||||||||||||||||||||||||||||||||||
Dividends are paid annually. While focused on capital growth, as an investment trust FCSS will pay out at least 85% of income received. |
When the board deems it appropriate, FCSS will buy back shares at a discount or issue them at a premium to keep the share price close to NAV. There is no rigid discount control mechanism. Financial years shown. |
|||||||||||||||||||||||||||||||||||||||||||||||||||||||||||||||||||||||||||||||||||||||||||||||||||||||||||
|
|
|||||||||||||||||||||||||||||||||||||||||||||||||||||||||||||||||||||||||||||||||||||||||||||||||||||||||||
Shareholder base (as at 30 August 2016) |
Portfolio exposure by market cap (as at 31 July 2016) |
|||||||||||||||||||||||||||||||||||||||||||||||||||||||||||||||||||||||||||||||||||||||||||||||||||||||||||
|
|
|||||||||||||||||||||||||||||||||||||||||||||||||||||||||||||||||||||||||||||||||||||||||||||||||||||||||||
Top 10 holdings (as at 31 July 2016) |
||||||||||||||||||||||||||||||||||||||||||||||||||||||||||||||||||||||||||||||||||||||||||||||||||||||||||||
|
||||||||||||||||||||||||||||||||||||||||||||||||||||||||||||||||||||||||||||||||||||||||||||||||||||||||||||
Source: Fidelity China Special Situations, Edison Investment Research, Bloomberg, Morningstar. Note: *Gearing net of short positions (capital structure). **N/A where not in July 2015 top 10.
Market outlook: Potential for improved sentiment
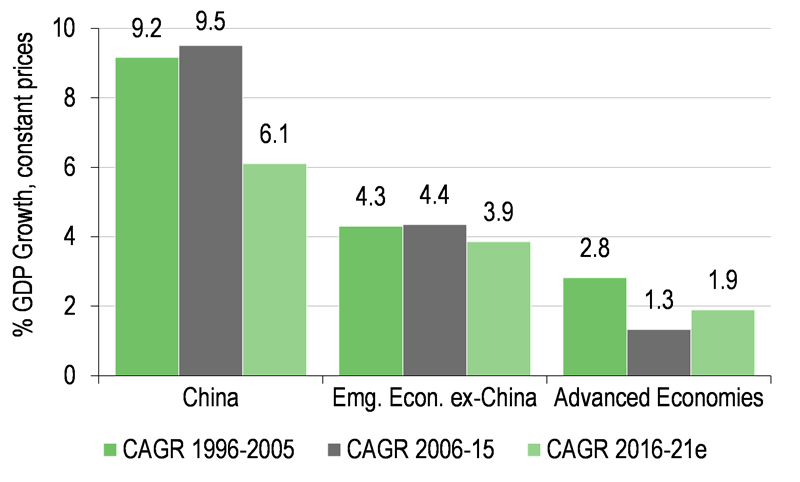
Following a strong run in the local Chinese ‘A’ share market in the first half of 2015, fuelled by margin financing, the subsequent correction, as a result of government intervention and a loosening of the exchange rate mechanism, led to a reduction in the forward P/E multiple from a peak of 19.6x in mid-June 2015 to 10.9x in late-January 2016. Considering the valuation of the Hong Kong-listed ‘H’ share market (Exhibit 2, left hand side), the current forward P/E multiple of 7.3x compares to a range of 5.3x to 8.3x over the last five years and is close to a low relative to world markets. China’s transition from an investment- to a consumption-led economy supports the expectation of superior earnings growth prospects for consumer-oriented sectors, while the implementation of further capital market reforms by the Chinese authorities suggests potential for Chinese equities to rerate over time. In its April 2016 World Economic Outlook, the IMF forecasts higher medium-term GDP growth for China than advanced and most other emerging economies. Although the forecast is lower for the next six years versus the last 20, this is not unexpected given the economy is now more mature. While being mindful of the historical volatility of the stock market, for investors wishing to gain exposure to Chinese equities, a fund focused on finding mispriced opportunities across the market capitalisation spectrum, may hold appeal.
|
Exhibit 2: China GDP growth and market valuation versus world |
|
Datastream China ‘H’ index forward P/E vs World index over five years |
Average % real GDP growth – China vs emerging & advanced economies |
|
|
|
Source: Thomson Datastream, IMF WEO April 2016, Edison Investment Research |
|
Fund profile: Specialist investment in Chinese equities
FCSS was launched in April 2010; its aim is to generate long-term capital growth via investment primarily in equities and related securities issued by Chinese companies in China and Hong Kong. The trust may also invest in companies listed elsewhere that generate a significant amount of their revenues in China and Hong Kong. Since 1 April 2014, FCSS has been managed by Dale Nicholls, who joined Fidelity as a research analyst in 1996; he has experience in managing portfolios of Asian companies, including China, and has a small/mid cap investment style. FCSS is benchmarked against the MSCI China index (sterling adjusted). Broad investment limits are in place such as at the time of acquisition, no single investment may exceed 15% of net assets, while short positions are permitted up to a maximum 15% of gross assets. At the July 2016 AGM, the limit on investment in unlisted securities was increased from 5% to 10% of gross assets. FCSS may invest directly in China ‘A’ shares via its Qualified Foreign Institutional Investor (QFII) licence and indirectly through third parties who hold a QFII. Derivatives are permitted for efficient portfolio management, gearing and hedging purposes and exposure to a single counterparty may not exceed 15% of gross assets. FCSS may borrow up to 25% of net assets and gross asset exposure either from borrowing or via derivatives will not exceed net assets by more than 30%.
The fund manager: Dale Nicholls
The manager’s view: Finding plenty of opportunities
Manager Dale Nicholls sees the merit of increasing the permitted investment in unlisted securities from 5% to 10% of net assets as providing additional investment flexibility. Following the successful IPO of Alibaba, which FCSS invested in at an early stage, there has been a trend to raise capital in the private markets, before in due course, proceeding to an IPO. The portfolio currently holds two unlisted companies: Didi Chuxing and Meituan-Dianping. Didi Chuxing is the market-leading taxi-hailing service via smartphone app in China and its recently agreed acquisition of Uber’s China operations is expected to give it unassailable market leadership. In the most recent round of funding, the valuation of Didi Chuxing increased from US$16bn to in excess of US$20bn, which has been reflected in FCSS’s NAV. Following completion of the deal with Uber, market speculation is that the valuation could exceed US$30bn. Meituan-Dianping is China’s largest online to offline service provider, where the market has potential to be greater than for online goods and has Alibaba and Tencent as strategic investors. In Nicholls’ view, both Didi Chuxing and Meituan-Dianping have strong growth potential.
The manager reiterates his view that the Chinese economy divides into two distinct sections: consumption-driven ‘new’ China and investment-driven ‘old’ China. He prefers companies that are benefitting from rising consumption, but is also focusing on ‘old’ economy companies that are benefitting from reforms. He believes that slowing GDP growth in China is inevitable, as the previous high levels were naturally unsustainable, but is concerned about high levels of debt. Chinese debt to GDP has expanded significantly since the global financial crisis and has continued to grow. The manager is encouraged by the authorities acknowledging the issue and banks addressing their non-performing loans, but expects reported bad debt levels will continue to rise and consequently does not hold any banks in the portfolio. He also views the pace of reform at state-owned enterprises (SOEs) as disappointing. The announcement of production cutbacks in the steel and coal industries is positive, but taking capacity out of the system may prove problematic given the indebted position of some industry participants. In the two-speed economy, consumption data points are generally positive and some companies are growing rapidly, such as those benefitting from the shift to online products and services. Penetration for consumer items such as luxury cars and beauty and care goods in China remains low, which offers plenty of future growth potential for companies catering to the rising middle class.
The manager comments that, having lagged other indices, the Chinese stock market now appears cheap on both a P/E and P/B basis versus history and world markets, while its ROE remains higher. He sees that despite volatility in the Chinese stock market over the last 12 months, over the long term, investors have been rewarded. While a large percentage of FCSS’s portfolio is invested in mid- and small-cap companies, the manager is also finding opportunities in the larger-cap SOEs, where valuations are often at steep discounts to private companies. Less value is seen in small caps in the China ‘A’ share market, which is driven by retail investors, and the manager has been reducing ‘A’ share exposure, but believes that the ‘H’ share market still offers good value.
Asset allocation
Investment process: Broad portfolio with mid/small-cap bias
The manager follows the same investment process for listed and unlisted securities; although for unlisted securities the liquidity risk means that the potential upside from the investment needs to be higher. He draws on the resources of a team of 12 analysts dedicated to Chinese equities to identify companies with potential to outperform the benchmark MSCI China index (in sterling terms). When considering an investment for inclusion in the FCSS portfolio, the manager seeks companies with long-term growth prospects, generating robust cash flow with strong management teams. He focuses on the potential size of the market operated, the company’s market position, management’s ability to execute and whether the valuation reflects the potential of the underlying business. A large part of the portfolio is invested in mid- and small-cap companies, where information is less widely available and the manager finds more mispriced stocks. As a result, the portfolio has a large number of holdings; typically 130-140.
Current portfolio positioning
As shown in Exhibit 3, c 50% of the portfolio comprises consumer discretionary and technology stocks. This is representative of the focus on ‘new’ China, where demand for goods and services is being driven by the rising middle class and the widespread adoption of new technologies. Within the consumer discretionary sector, the manager considers that Macau gaming stocks look attractively valued. Share prices pulled back due to lower gross gaming revenues, as a result of a government focus on anticorruption, tightening credit and a slower economy. However, there are signs that business conditions are improving led by higher demand from the mass market, which generates higher margins than the declining VIP segment, leading to a positive mix shift. Only a small percentage of the Chinese population has visited Macau, which provides a large runway for growth and the gaming stocks are trading on historically low valuations.
Exhibit 3: Portfolio sector exposure vs benchmark (%)
Portfolio end-July 2016 |
Portfolio end-July 2015 |
Change |
Index weight |
Active weight vs index (pts) |
Trust weight/ index weight (x) |
|
Consumer discretionary |
28.6 |
25.6 |
3.0 |
8.2 |
20.4 |
3.5 |
Information technology |
22.8 |
19.3 |
3.6 |
30.5 |
(7.7) |
0.7 |
Industrials |
13.9 |
11.5 |
2.4 |
6.1 |
7.8 |
2.3 |
Financials |
10.6 |
18.2 |
(7.7) |
30.5 |
(19.9) |
0.3 |
Consumer staples |
7.8 |
4.7 |
3.1 |
2.4 |
5.4 |
3.3 |
Materials |
3.9 |
3.7 |
0.2 |
1.2 |
2.7 |
3.3 |
Healthcare |
3.6 |
8.8 |
(5.2) |
2.0 |
1.6 |
1.8 |
Energy |
3.6 |
2.5 |
1.1 |
6.7 |
(3.1) |
0.5 |
Telecom services |
3.0 |
2.9 |
0.1 |
9.3 |
(6.3) |
0.3 |
Utilities |
2.2 |
2.6 |
(0.4) |
3.1 |
(0.9) |
0.7 |
100.0 |
100.0 |
100.0 |
Source: Fidelity China Special Situations, Edison Investment Research
Performance: Very strong relative performance
In the year ending 31 March 2016, FCSS’s essentially flat NAV total return of 0.02% compared favourably to the 16.17% total return decline in the benchmark. The share price total return fell by 4.53%, with the discount increasing from 13.1% to 17.2% over the period.
|
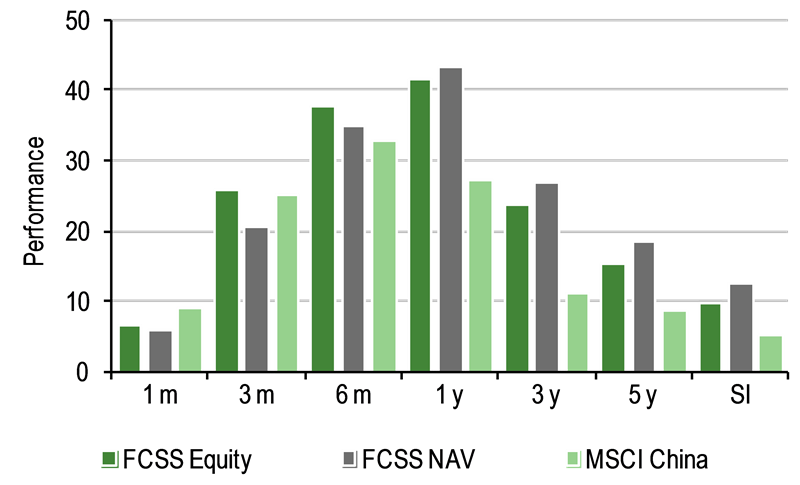
Exhibit 4: Investment trust performance to 31 August 2016 |
|
Price, NAV and benchmark total return performance, one-year rebased |
Price, NAV and benchmark total return performance (%) |
|
|
|
Source: Thomson Datastream, Edison Investment Research. Note: Three, five and SI (since inception) performance figures annualised. Inception date is 16 April 2010. |
|
Despite volatility in the Chinese stock market over the last year, as shown in Exhibit 4 (left-hand side), FCSS has achieved strong absolute returns over one, three and five years and since inception; with annualised NAV total returns of 43.2%, 27.0%, 18.3% and 12.4% respectively.
|
Exhibit 5: Share price and NAV total return performance, relative to index (%) |
|||||||
|
One month |
Three months |
Six months |
One year |
Three years |
Five years |
Since inception |
Price relative to MSCI China |
(2.0) |
0.5 |
3.8 |
11.4 |
38.6 |
35.2 |
30.9 |
NAV relative to MSCI China |
(2.9) |
(3.5) |
1.8 |
12.6 |
49.6 |
52.9 |
53.9 |
Price relative to MSCI World |
5.1 |
9.5 |
14.6 |
12.4 |
27.7 |
1.9 |
(8.8) |
NAV relative to MSCI World |
4.2 |
5.1 |
12.4 |
13.6 |
37.8 |
15.2 |
7.2 |
Price relative to FTSE All-Share |
4.7 |
15.3 |
21.7 |
26.8 |
57.7 |
30.2 |
14.1 |
NAV relative to FTSE All-Share |
3.8 |
10.7 |
19.4 |
28.1 |
70.2 |
47.2 |
34.1 |
|
Source: Thomson Datastream, Edison Investment Research. Note: Data to end-August 2016. Geometric calculation. |
|||||||
As shown in Exhibit 5, FCSS’s NAV and share price total returns have outperformed the benchmark MSCI China index (sterling adjusted) over all periods from six months to five years and since inception. As a reference for UK investors, the trust’s NAV and share price total returns have also outperformed the FTSE All-Share index over all periods shown.
|
Exhibit 6: NAV performance relative to MSCI China index since launch |
|
|
Source: Thomson Datastream, Edison Investment Research |
Exhibit 6 shows FCSS’s relative performance since launch, highlighting the consistently strong outperformance since late 2012. Over the 12 months to the end of June 2016, the strongest contributors to performance were holdings in US-listed educational service company New Oriental Education & Technology Group (154bp), which is a market leader and is focusing on improving its margins and café store chain operator, Taiwan-listed Gourmet Master (132bp), which has a very strong business model and high incremental returns on capital with a long runway for growth. The largest detractor from relative performance (-143bp) was the portfolio’s zero weighting in telecom company China Mobile, which has a near 10% weighting in the benchmark; the manager considers that there are better investment opportunities elsewhere within the sector.
Discount: Widening three-year trend
Despite strong relative performance over the last three years, FCSS’s share price discount to NAV has widened as a result of negative sentiment towards investment in Chinese stocks. While the current discount of 14.6% is narrower than the 16.8% average of the last 12 months (range of 13.7% to 20.0%), it is wider than the averages of the last three and five years, and since inception (13.2%, 9.7% and 6.6% respectively). Given FCSS’s strong performance track record, there is significant scope for the discount to narrow further if sentiment towards the Chinese stock market improves. Although there is no formal discount control mechanism in place, shares are repurchased when deemed appropriate, with the aim of keeping the share price close to NAV. During FY16, 3.1% of the share base was repurchased into treasury at a 16.4% average discount.
|
Exhibit 7: Share price discount to NAV (including income) over three years (%) |
|
|
Source: Thomson Datastream, Edison Investment Research |
Capital structure and fees
FCSS currently has 551.9m ordinary shares in issue plus a further 19.4m shares held in treasury. It has a US$150m revolving credit facility with Scotiabank Europe and has the ability to increase gearing via contracts for differences (CFDs) on a number of portfolio holdings. During FY16, the fund was geared in a falling market, which during the year detracted 1.8% from NAV total return performance. The current level of gearing reflects the manager’s belief that current valuations in the market do not reflect companies’ fundamentals and growth prospects.
Fidelity International is paid an annual management fee of 1.0% of net assets. A 15% performance fee is payable on returns higher than 2% above the benchmark, capped at 1.0% of net assets. Excess outperformance cannot be carried forward and any underperformance must be made good before any further performance fee is payable. In FY16, ongoing charges of 1.2% were nine basis points lower than in the prior year. The performance fee was capped at the maximum level of £9.1m in FY16, bringing the ongoing charge including performance fees to 2.2%.
Dividend policy and record
Although FCSS’s primary aim is capital growth, the dividend has been increased consistently since 2011. Over the last four years the dividend has compounded at an annual rate of c 25%. The 2016 dividend of 1.80p per share was a 38.5% increase on the prior year and represents a current yield of 1.1%. Revenue earnings of 2.07p per share ensured that the dividend was 1.15x covered.
Peer group comparison
Exhibit 8 shows a comparison of FCSS with other funds investing in Chinese equities. JPMorgan Chinese is the only other closed-ended fund focused on Chinese equities, so we show the AIC Asia Pacific ex-Japan averages (37% average exposure to China & Greater China). We also include open-ended funds larger than £250m from the IA China/Greater China sector. FCSS’s NAV total return is significantly higher than the Asia Pacific ex-Japan closed-end sector average over one, three and five years. Its NAV total return is above the China open-ended funds over one, three and five years, significantly higher than the top ranked open-ended fund over these periods. FCSS’s risk-adjusted returns, measured by the Sharpe ratio, are above the closed-ended peer group average over one and three years. FCSS’s 1.2% ongoing charge is modestly above the Asia Pacific ex-Japan fund average and appreciably lower than the open-ended funds, while its 2.2% ongoing charge including performance fees is similar to the open-ended fund average.
Exhibit 8: Funds investing in Chinese equities – total returns, discounts and charges as at 02 September 2016
% unless stated |
Market cap £m |
NAV TR 1 Year |
NAV TR 3 Year |
NAV TR 5 Year |
NAV TR 10 Year |
Sharpe 1y (NAV) |
Sharpe 3y (NAV) |
Discount (ex-par) |
Ongoing charge |
Perf. fee |
Net gearing |
Dividend yield (%) |
Fidelity China Special Situations |
943.8 |
47.3 |
104.0 |
132.3 |
|
1.4 |
1.1 |
(13.4) |
1.2 |
Yes |
126 |
1.1 |
JPMorgan Chinese |
148.7 |
34.1 |
40.2 |
62.9 |
225.4 |
0.9 |
0.4 |
(14.2) |
1.4 |
No |
108 |
0.9 |
Asia Pacific ex-Japan average |
372.6 |
34.3 |
34.7 |
62.6 |
217.7 |
1.3 |
0.5 |
(7.3) |
1.1 |
0.0 |
104 |
2.2 |
Open-ended funds |
||||||||||||
Aberdeen Glb Chinese Equity |
473.6 |
22.5 |
12.6 |
22.1 |
131.1 |
2.0 |
||||||
Allianz China Equity |
341.3 |
30.0 |
40.2 |
53.1 |
|
2.3 |
||||||
Baring Hong Kong China |
1,373.0 |
33.6 |
33.4 |
37.9 |
186.2 |
1.8 |
||||||
Fidelity China Focus |
2,772.1 |
32.9 |
52.9 |
62.2 |
250.2 |
1.9 |
||||||
First State Greater China Gr A |
446.8 |
34.6 |
35.3 |
64.9 |
293.5 |
1.8 |
||||||
Henderson China Opportunities |
433.4 |
41.5 |
50.9 |
58.4 |
237.1 |
1.7 |
||||||
HSBC GIF Chinese Equity |
1,111.6 |
30.9 |
35.5 |
44.9 |
|
2.4 |
||||||
Invesco PRC Equity |
580.7 |
31.0 |
22.8 |
37.3 |
159.7 |
3.1 |
||||||
Invesco Perpetual HK & China |
376.4 |
29.4 |
37.3 |
76.5 |
220.7 |
1.7 |
||||||
JPM Greater China |
444.6 |
30.7 |
36.3 |
56.9 |
213.5 |
1.8 |
||||||
Schroder ISF Greater China |
525.2 |
39.3 |
50.0 |
62.2 |
199.1 |
1.9 |
||||||
Templeton China |
404.9 |
34.2 |
18.3 |
11.7 |
133.7 |
2.5 |
||||||
Open-ended funds average |
773.6 |
32.5 |
35.5 |
49.0 |
202.5 |
2.1 |
Source: Morningstar, Edison Investment Research. Note: TR=total return. Sharpe ratio is a measure of risk-adjusted return. The ratios shown are calculated by Morningstar for the past 12- and 36-month periods by dividing a fund’s annualised excess returns over the risk-free rate by its annualised standard deviation. Net gearing is total assets less cash and equivalents as a percentage of net assets.
The board
The board of FCSS comprises six directors, five of whom are independent. Having served as chairman since the trust’s inception, John Owen stepped down at the July 2016 AGM; he is replaced by Nicholas Bull, who was appointed in 2010. Andrew Wells, Fidelity’s former global chief investment officer, fixed income, now vice chairman for Fidelity Canada, also stepped down having served on the board since 2012. David Causer and Peter Pleydell-Bouverie were appointed in 2010 and senior independent director, Elizabeth Scott in 2011. The newest members of the board are Vera Hong Wei appointed with effect from 24 March 2016 and John Ford at the 22 July 2016 AGM. Ford is Fidelity’s global chief investment officer, fixed income, solutions and real estate, and therefore is considered not to be independent.
|
|
Investment Companies