Middlefield Canadian Income (MCT) is listed on the Main Market of the London Stock Exchange. It aims to invest in a diversified portfolio of Canadian and selected US companies that are able to pay high sustainable or growing dividends and have the potential to generate long-term capital growth. On a sector basis, the trust currently has high exposure to the pipelines, power & utility and real estate sectors. MCT is benchmarked against the S&P/TSX Composite High Dividend Index, which it has outperformed over one, three and five years. MCT currently pays a regular quarterly dividend of 1.25p, although the board has recently proposed a modest increase to 1.275p; its current dividend yield is 4.7%.
Middlefield Canadian Income |
Exposure to high-yielding North American equities |
Investment trusts |
26 April 2017 |
Share price/discount performance
Three-year performance vs index
Gearing
Analysts
|
|||||||||||||||||||||||||||||||||||||||||||||||||||||||||||||||||||||||||||||||||||||||||||||||||||||||
Middlefield Canadian Income (MCT) is listed on the Main Market of the London Stock Exchange. It aims to invest in a diversified portfolio of Canadian and selected US companies that are able to pay high sustainable or growing dividends and have the potential to generate long-term capital growth. On a sector basis, the trust currently has high exposure to the pipelines, power & utility and real estate sectors. MCT is benchmarked against the S&P/TSX Composite High Dividend Index, which it has outperformed over one, three and five years. MCT currently pays a regular quarterly dividend of 1.25p, although the board has recently proposed a modest increase to 1.275p; its current dividend yield is 4.7%.
12 months ending |
Share price |
NAV |
S&P/TSX Comp. High Dividend (%) |
S&P/TSX Composite (%) |
FTSE World |
31/03/13 |
21.2 |
17.2 |
12.3 |
9.8 |
17.5 |
31/03/14 |
(8.8) |
0.3 |
(2.4) |
(2.8) |
7.6 |
31/03/15 |
(2.3) |
2.7 |
(1.9) |
4.7 |
18.8 |
31/03/16 |
(13.7) |
(8.4) |
(6.6) |
(5.5) |
0.0 |
31/03/17 |
42.9 |
36.8 |
35.0 |
32.2 |
32.9 |
Source: Thomson Datastream. Note: All % on a total return basis in pounds sterling.
Investment strategy: Top-down and bottom-up
MCT is an actively managed fund; managers Dean Orrico and Rob Lauzon select stocks on a bottom-up basis, taking account of the macro environment. They seek to outperform the benchmark by investing in companies with good fundamentals, strong management teams and attractive valuations offering a good level of income with the potential for dividend growth. While the majority of the portfolio is invested in Canada, currently c 20% is invested in US equities to allow the managers to access attractive areas that are unavailable in Canada. MCT’s currency exposure is unhedged and gearing of up to 25% of gross assets is permitted.
Market outlook: Broader sector leadership
Canadian equities delivered above-average returns to investors in 2016; however, stock market leadership was narrow, led by materials and energy, which benefited from higher commodity prices. The other two outperforming sectors were also cyclical (financials and industrials) where earnings growth was boosted by higher interest rates and more robust economic activity. So far in 2017, stock market leadership is much broader – as at end-March, only two sectors were underperforming. There is the potential for wider sector leadership to continue so for investors seeking exposure to North America, a diversified fund offering a high level of income with the potential for long-term capital growth may be of interest.
Valuation: Scope for discount to narrow further
MCT’s 5.4% current share price discount to cum-income NAV compares to the averages of the last one, three, five and 10 years (range of 5.4% to 13.4%). There is scope for the discount to narrow further if investor demand for Canadian equities increases or the manager continues to deliver positive relative investment performance. Investors should note that as recently as early 2015, MCT’s share price stood at a premium to NAV.
Exhibit 1: Fund at a glance
Investment objective and fund background |
Recent developments |
|||||||||||||||||||||||||||||||||||||||||||||||||||||||||||||||||||
Middlefield Canadian Income’s objective is to provide a high level of sustainable dividends and long-term capital growth via investment primarily in Canadian and selected US equities, with a small exposure to fixed income securities. It is benchmarked against the S&P/TSX Composite High Dividend Index in sterling terms and is a member of the FTSE All-Share Index. |
■ 20 April 2017: Annual results ending 31 December 2016. NAV TR of 44.4% versus benchmark TR of 57.7%. ■ 20 April: Board proposal to increase the quarterly dividend to 1.275p. ■ 6 April 2017: Declaration of 1.25p quarterly dividend. ■ 5 January 2017: Declaration of 1.25p quarterly dividend. |
|||||||||||||||||||||||||||||||||||||||||||||||||||||||||||||||||||
Forthcoming |
Capital structure |
Fund details |
||||||||||||||||||||||||||||||||||||||||||||||||||||||||||||||||||
AGM |
May 2017 |
Ongoing charges |
1.02% (FY16) |
Group |
Middlefield Group |
|||||||||||||||||||||||||||||||||||||||||||||||||||||||||||||||
Interim results |
June 2017 |
Net gearing |
18.0% |
Manager |
Dean Orrico and Rob Lauzon |
|||||||||||||||||||||||||||||||||||||||||||||||||||||||||||||||
Year end |
31 December |
Annual mgmt fee |
0.70% of average NAV |
Address |
288 Bishopsgate, London, EC2M 4QP, UK |
|||||||||||||||||||||||||||||||||||||||||||||||||||||||||||||||
Dividend paid |
Apr, Jul, Oct, Jan |
Performance fee |
None |
|||||||||||||||||||||||||||||||||||||||||||||||||||||||||||||||||
Launch date |
July 2006 |
Trust life |
Indefinite |
Phone |
+44 (0) 20 3709 4016 |
|||||||||||||||||||||||||||||||||||||||||||||||||||||||||||||||
Continuation vote |
Last in May 2013, none going forward. |
Loan facilities |
See page 7 |
Website |
||||||||||||||||||||||||||||||||||||||||||||||||||||||||||||||||
Dividend policy and history |
Share buyback policy and history |
|||||||||||||||||||||||||||||||||||||||||||||||||||||||||||||||||||
Dividends of 1.25p are paid quarterly in April, July, October and January. |
MCT has redeemable participating preference shares in issue (see page 7). |
|||||||||||||||||||||||||||||||||||||||||||||||||||||||||||||||||||
|
|
|||||||||||||||||||||||||||||||||||||||||||||||||||||||||||||||||||
Shareholder base (as at 21 February 2017) |
Asset mix (as at 31 March 2017) |
|||||||||||||||||||||||||||||||||||||||||||||||||||||||||||||||||||
|
|
|||||||||||||||||||||||||||||||||||||||||||||||||||||||||||||||||||
Top 10 holdings (as at 31 March 2017) |
||||||||||||||||||||||||||||||||||||||||||||||||||||||||||||||||||||
|
||||||||||||||||||||||||||||||||||||||||||||||||||||||||||||||||||||
Source: Middlefield Canadian Income, Edison Investment Research, Bloomberg, Morningstar. Note: *N/A where not in March 2016 top 10.
Market outlook: Potential for broader leadership
Exhibit 2 (LHS) shows the performance of Canadian indices in sterling terms over the last 10 years. Returns during 2016 were boosted by the weakness of sterling, which depreciated by c 23% versus the Canadian dollar. As shown in Exhibit 2 (RHS), Canadian stock market returns in 2016 were led by materials, energy, financials and industrials. During Q117, market leadership has broadened out, and as at-end March 2017, nine sectors had outperformed year-to-date; the exceptions were energy (which had been affected by a pullback in the oil price) and healthcare (a tiny sector dominated by the troubled Valeant Pharmaceuticals). There is the potential for this broader leadership to continue for the balance of the year.
|
Exhibit 2: Market performance and valuation |
||||||||||||||||||||||||||||||||||||||||||||||||||||||||||||||||||
Canadian indices last 10 years (£) |
S&P/TSX Composite Index performance to end-March 2017 (C$) |
|||||||||||||||||||||||||||||||||||||||||||||||||||||||||||||||||
|
|
|||||||||||||||||||||||||||||||||||||||||||||||||||||||||||||||||
|
Source: Thomson Datastream, Edison Investment Research, Bloomberg |
||||||||||||||||||||||||||||||||||||||||||||||||||||||||||||||||||
Following the significant share price appreciation of Canadian equities in 2016, some valuation measures are looking high relative to history (Exhibit 3, LHS). On a forward earnings basis, using the Datastream Canadian Index as a proxy, Canadian equities are trading towards the top end of their 10-year range and 14% higher than the 10-year average. However, a benign economic environment could provide support to company earnings. In its April 2017 World Economic Outlook, the International Monetary Fund forecasts 2016-21 average annual economic growth for Canada of 1.86%, which is broadly similar to the US and modestly above the growth expected in both the UK and Europe. For investors seeking exposure to North America, a fund invested broadly across the Canadian stock market (and selectively in the US), with a focus on companies generating an attractive level of income and the potential for long-term capital growth, may appeal.
|
Exhibit 3: Market valuation and GDP growth |
|||||||||||||||||||||||||||||||
Datastream Canadian Index 10-year valuation metrics (as at 20 April 2017) |
Historic and forecast GDP growth (% CAGR) |
||||||||||||||||||||||||||||||
|
|
||||||||||||||||||||||||||||||
|
Source: Thomson Datastream, Edison Investment Research, IMF WEO (April 2017) |
|||||||||||||||||||||||||||||||
Fund profile: High income, North American exposure
Middlefield Canadian Income – GBP PC (MCT) is the initial (sole) protected cell of Middlefield Canadian Income PCC (protected cell company). It is managed by the Middlefield Group, an investment company with c C$4.0bn of assets under management, with offices in Toronto, Calgary, San Francisco and London (UK). MCT is incorporated in Jersey and its shares are traded on the Main Market of the London Stock Exchange. It aims to provide shareholders with a high level of dividends and long-term capital growth from a diversified portfolio of primarily Canadian and US equities. Investments are focused on companies with good fundamentals, proven management teams, strong balance sheets and sustainable dividends. The portfolio typically contains 40-50 holdings; there are currently 47, including six debt instruments. Since fund inception, MCT has been managed by Dean Orrico; Rob Lauzon replaced the previous co-manager in May 2016. The trust is benchmarked against the S&P/TSX Composite High Dividend Index.
In February 2015, the investment limit for securities listed outside a Canadian exchange was increased from 20% to 40% and a new condition was introduced, allowing 10% of the fund to be invested in securities listed outside Canada and the US. These new rules allow the manager greater freedom to invest in sectors that are underrepresented in Canada, which could lead to higher total shareholder returns. MCT may invest up to 10% in a single issuer, the top 10 holdings may comprise 50% of the portfolio and up to 10% may be invested in unquoted securities (although none are held due to lack of liquidity). Currency exposure is not hedged. Gearing up to 25% of gross assets is permitted; it is typically in a range of 0% to 20%.
The fund managers: Dean Orrico and Rob Lauzon
The managers’ view: Improving economic outlook
From a macro perspective, co-lead manager Orrico considers that both Canadian and US economic data is relatively positive, with unemployment, purchasing manager indices and general economic activity all moving in the right direction. The manager suggests that the US economy has had more momentum than Canada, and this may continue if President Trump is able to follow through on his proposed policies. Orrico explains that Canada has come out of a difficult two-year period, where softness in the oil price and other resources weighed on the economy, but now commodity prices have improved. He suggests the improving economic outlook provides a good backdrop for the performance of North American equities. Corporate earnings have been improving since Q316, which the manager argues should support equities, given elevated valuation multiples.
The manager comments that interest-rate sensitive sectors such as real estate have been affected by higher US rate expectations over the last few months, but real estate is an industry where, in the longer term, he expects rental growth and improved occupancy to outweigh higher borrowing costs. (At more than 20%, real estate is MCT’s second largest sector exposure.) Orrico believes that if comments from the Federal Reserve Board are constructive on economic activity, there are likely to be another two US interest rate rises in 2017, but the outlook for rate rises in 2018 is too difficult to call. He suggests that 10-year US government bond yields are likely to stay in a 2.5-3.0% range and that stock markets will start to discount this. Canada has not seen interest rate rises unlike in the US; hence the manager continues to prefer Canadian commercial real estate rather than US REITs. He says that these companies have good fundamentals, solid balance sheets, good payout ratios and are selectively increasing their annual dividends.
Asset allocation
Investment process: Stock selection with macro considerations
Managers Dean Orrico and Rob Lauzon take account of the prevailing macro environment to select high-yielding, primarily Canadian companies, which have the potential to increase their dividends. The managers aim to outperform the benchmark S&P/TSX Composite High Dividend Index. When selecting stocks on a bottom-up basis, screens are used extensively, including dividend yield, payout ratios and valuation metrics, and meeting company managements is a key element of the investment process. Third-party resources are used to provide research into areas, such as energy and healthcare, that are considered too specialist for a generalist fund manager. The healthcare research is led by SSR, which is led by Dr Richard Evans. Currently, c 15% of MCT’s portfolio is invested primarily in the US to provide exposure to sectors unavailable in Canada, such as healthcare where there are a large number of listed companies available. A small percentage of the portfolio (c 6%) is held in fixed income securities. All of MCT’s equity holdings pay a dividend; the manager has analysed MCT’s portfolio and found that eight out of 41 equity holdings raised their dividends during Q416 and c 70% of current equity holdings have increased their dividends during the last three years (by an average of c 13%). The manager suggests that investing in dividend-paying companies results in a better total return with lower risk, as well as helping to fund MCT’s dividend.
Current portfolio positioning
As shown in Exhibit 4, over the last 12 months, MCT’s exposure to Canadian equities has increased, while US equity and fixed income exposure has been reduced. The manager argues there are plenty of Canadian companies that are attractive from a risk/reward and yield perspective.
Exhibit 4: Asset mix as at 31 March 2017 (% unless stated)
Portfolio end-March 2017 |
Portfolio end-March 2016 |
Change (pp) |
|
Canadian equity |
78.0 |
62.4 |
15.6 |
US & international equity |
16.3 |
30.5 |
(14.2) |
Fixed income |
5.7 |
7.1 |
(1.4) |
100.0 |
100.0 |
Source: Middlefield Canadian Income, Edison Investment Research
A recent addition to the portfolio is Chorus Aviation, which provides airline services to Air Canada (90% of revenues with contracts up to 2025) and has started diversifying its operations to third-party firms. Chorus operates in three business areas: Contracted flying operations; maintenance, repair and overhaul; and regional aircraft leasing. It has been consistently profitable since its initial public offering in 2006; its current dividend yield is c 6.5%.
Exhibit 5: Portfolio sector exposure vs benchmark (% unless stated)
Portfolio end- |
Portfolio end- |
Change |
Index weight* |
Active weight |
Trust weight/ index weight (x) |
|
Pipelines, power & utilities |
22.5 |
13.8 |
8.7 |
32.2 |
(9.7) |
0.7 |
Real estate |
21.8 |
10.1 |
11.7 |
14.9 |
6.9 |
1.5 |
Financials |
15.1 |
19.7 |
(4.6) |
29.2 |
(14.1) |
0.5 |
Energy |
12.1 |
11.8 |
0.3 |
6.0 |
6.1 |
2.0 |
Industrials |
6.3 |
6.7 |
(0.4) |
1.4 |
4.9 |
4.5 |
Bonds & convertible debentures |
5.7 |
7.1 |
(1.4) |
0.0 |
5.7 |
N/A |
Materials |
5.4 |
7.7 |
(2.3) |
1.2 |
4.2 |
4.5 |
Healthcare |
5.1 |
4.8 |
0.3 |
0.0 |
5.1 |
N/A |
Consumer discretionary |
4.8 |
8.8 |
(4.0) |
4.3 |
0.5 |
1.1 |
Other |
1.2 |
1.2 |
0.0 |
0.0 |
1.2 |
N/A |
Consumer staples |
0.0 |
5.2 |
(5.2) |
0.4 |
(0.4) |
0.0 |
Telecommunications |
0.0 |
0.0 |
0.0 |
10.1 |
(10.1) |
0.0 |
Technology |
0.0 |
3.1 |
(3.1) |
0.2 |
(0.2) |
0.0 |
100.0 |
100.0 |
100.0 |
Source: Middlefield Canadian Income, Edison Investment Research. Note: Numbers subject to rounding. *S&P/TSX Composite High Dividend Index.
Performance: Returns in 2016 boosted by weak sterling
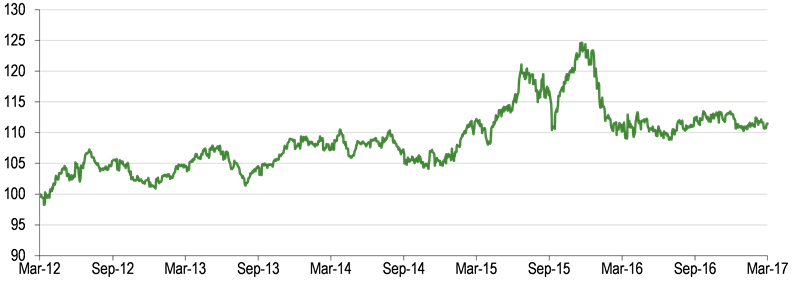
The manager comments that currency can be a challenge to performance; he suggests that on balance, investors prefer unhedged exposure, but currency moves can result in volatility in MCT’s reported NAV. During 2016, sterling’s 22.9% depreciation versus the Canadian dollar provided a tailwind to MCT’s absolute total returns, but this followed a five-year headwind due to sterling appreciation. Over the last 12 months, MCT’s share price and NAV total returns of 42.9% and 36.8%, respectively, are ahead of the 35.0% benchmark total return. In Q117, sterling was more stable, appreciating by 0.8% versus the Canadian dollar; however, the manager comments that developments around the UK’s exit from the EU are likely to lead to further sterling volatility.
|
Exhibit 6: Fund performance to 31 March 2017 |
|
Price, NAV and benchmark total return performance, one-year rebased |
Price, NAV and index total return performance (%) |
|
|
|
Source: Thomson Datastream, Edison Investment Research. Note: Three, five and 10-year performance figures annualised. |
|
MCT’s relative returns are shown in Exhibit 7; its NAV total return has outperformed the S&P/TSX Composite High Dividend Index over one, three and five years, while lagging over 10 years. As a reference to UK shareholders, MCT’s NAV total return has outperformed the FTSE All-Share Index over one and three years and significantly outperformed over the last 10 years.
Exhibit 7: Share price and NAV total return performance, relative to indices (%)
|
One month |
Three months |
Six months |
One year |
Three years |
Five years |
10 years |
Price relative to S&P/TSX Comp. High Div. |
(0.3) |
(1.0) |
0.5 |
5.9 |
(2.6) |
(1.8) |
(15.8) |
NAV relative to S&P/TSX Comp. High Div. |
0.0 |
(1.2) |
(0.7) |
1.3 |
4.2 |
11.6 |
(4.8) |
Price relative to S&P/TSX Composite |
(0.6) |
(1.1) |
1.8 |
8.1 |
(7.9) |
(4.7) |
7.6 |
NAV relative to S&P/TSX Composite |
(0.3) |
(1.3) |
0.6 |
3.4 |
(1.6) |
8.4 |
21.7 |
Price relative to FTSE World |
(1.2) |
(4.7) |
(1.2) |
7.5 |
(23.7) |
(33.3) |
(7.4) |
NAV relative to FTSE World |
(0.8) |
(4.9) |
(2.4) |
2.9 |
(18.5) |
(24.2) |
4.8 |
Price relative to FTSE All-Share |
(1.7) |
(3.2) |
3.2 |
17.2 |
(3.6) |
(16.1) |
33.1 |
NAV relative to FTSE All-Share |
(1.3) |
(3.4) |
2.0 |
12.2 |
3.1 |
(4.6) |
50.5 |
Source: Thomson Datastream, Edison Investment Research. Note: Data to end-March 2017. Geometric calculation.
|
Exhibit 8: NAV total return performance relative to benchmark over five years |
|
|
Source: Thomson Datastream, Edison Investment Research |
Discount: Narrowing over the near term
MCT’s 5.4% current share price discount to cum-income NAV is narrower than the 13.4% average of the last 12 months (range of 5.4% to 17.9%). It compares to the averages of the last three, five and 10 years of 8.7%, 5.4% and 6.4%, respectively.
There is scope for the discount to narrow further if investor demand for Canadian equities increases or the manager continues to deliver positive relative investment performance. In should be noted that in the past there have been periods where MCT’s shares traded at a premium to NAV; the last time was in early 2015.
|
Exhibit 9: Share price premium/discount to NAV (including income) over three years (%) |
|
|
Source: Thomson Datastream, Edison Investment Research |
Capital structure and fees
The authorised share capital of MCT is split between two management shares, each valued at £1, and an unlimited number of redeemable participating preference shares. The fund is able to issue or repurchase these preference shares without shareholder approval. During 2016, 1.2m redeemable participating preference shares were repurchased at an average price of 80.41p and so far in 2017, 0.5m shares have been repurchased at an average price of 104.89p (0.4% of shares outstanding at the end of 2016). There are currently 106.5m redeemable participating preference shares outstanding with a further 18.2m held in treasury, which may be sold to satisfy future demand (up to a maximum of 10% of the issued share capital at the time of the last AGM).
MCT has an on-demand credit facility agreement with the Royal Bank of Canada up to a maximum of the lesser of C$65m or 25% of its total assets. The rate of borrowing is either prime minus 0.35% or banker’s acceptances plus a stamping fee of 0.60%. MCT uses gearing strategically; it is increased when the manager considers that equities are attractively valued and paid down when valuations are unappealing. In FY16, the level of net gearing ranged from 5.6% to 17.5% and was 18.0% at end-March 2017. In recent years, the yearly average level of net gearing has increased from 4.6% in FY12 to 13.3% in FY16. Gearing is partially offset by fixed-income exposure in the portfolio, which was c 6% at end-March 2017.
Middlefield Group, the investment manager, is entitled to a management fee of 0.7% of net assets, payable quarterly in arrears. In FY16, the fees were split between capital and revenues in a ratio of 60:40. Prior to June 2013, the management fee was 0.867%. In FY16, ongoing charges of 1.02% of average NAV compared to 1.06% in the prior year.
Dividend policy and record
MCT currently pays regular 1.25p quarterly dividends in April, July, October and January. Barring unforeseen circumstances, it had been the board’s intention to continue to pay an annual dividend of 5.0p, supported by dividend and interest income from MCT’s investments. However, the board discusses the level of the dividend on a regular basis; given MCT’s positive capital returns and dividend increases in the underlying portfolio, the board has proposed to increase the quarterly dividend from 1.25p to 1.275p. Based on robust Q117 income, the 2017 pro forma dividend cover is more than 120%. MCT’s current dividend yield is 4.65%, (calculated on the proposed higher quarterly dividend, its prospective yield is 4.74%).
Peer group comparison
MCT is a member of the AIC’s North America sector – in Exhibit 10 we highlight the two funds with significant exposure to Canada. MCT has the better NAV total return over five and 10 years, while lagging over one and three years. It has a significantly lower discount, a lower ongoing charge, a broadly equal level of gearing and a higher dividend than its peer.
Exhibit 10: Selected peer group as at 20 April 2017 (£)
% unless stated |
Market cap £m |
NAV TR |
NAV TR |
NAV TR |
NAV TR |
Discount (ex-par) |
Ongoing charge |
Perform. |
Net gearing |
Dividend yield (%) |
Middlefield Canadian Income |
113.9 |
23.3 |
19.7 |
49.1 |
137.2 |
(5.4) |
1.0 |
No |
118 |
4.7 |
Canadian General Investments |
435.0 |
26.4 |
26.0 |
39.9 |
54.4 |
(28.1) |
1.7 |
No |
119 |
3.7 |
Average |
274.4 |
24.8 |
22.8 |
44.5 |
95.8 |
(16.8) |
1.3 |
119 |
4.2 |
|
MCT rank in sector |
2 |
2 |
2 |
1 |
1 |
1 |
2 |
2 |
1 |
Source: Morningstar, Edison Investment Research. Note: TR=total return. Net gearing is total assets less cash and equivalents as a percentage of net assets.
The board
There are five directors on the board of MCT, four of whom are independent of the manager. Chairman Nicholas Villiers, Raymond Apsey and Philip Bisson were appointed at the fund’s inception and Thomas Grose was appointed in 2012. Apart from a period between 2010 and 2012, MCT’s co-lead manager, Dean Orrico, has also been on the board since the fund’s inception.
|
|
Research: TMT
Piteco is buying the principal assets of LendingTools (LT), a small, privately owned US payments software provider, for up to $14.5m in cash. LT operates in the niche area of “correspondent banking”, offering financial institutions an alternative to the Federal Reserve’s FedLine Advantage. The deal provides Piteco with an attractive route into the lucrative US market, which it plans to use to grow its core treasury software solutions. On our updated forecasts, EPS rise by 12-14% over FY17 to FY19. Given the attractive growth opportunities, strong cash generation and healthy balance sheet, we continue to believe the shares are attractive on c 14x our FY18e earnings.