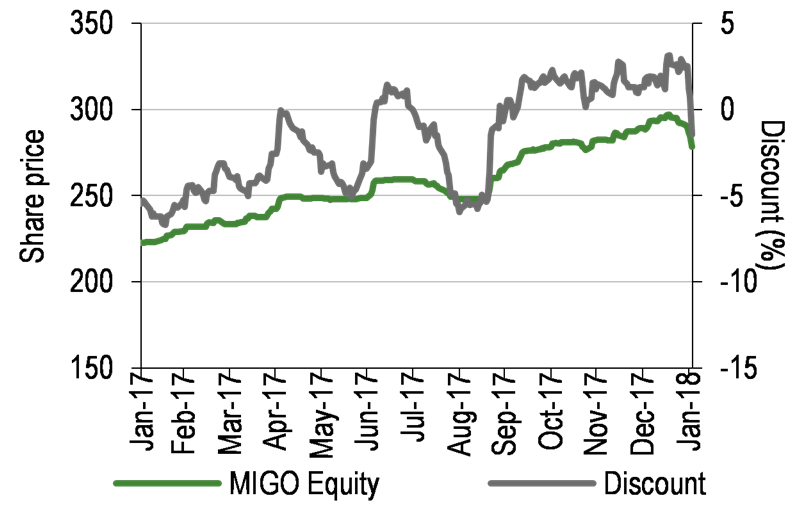
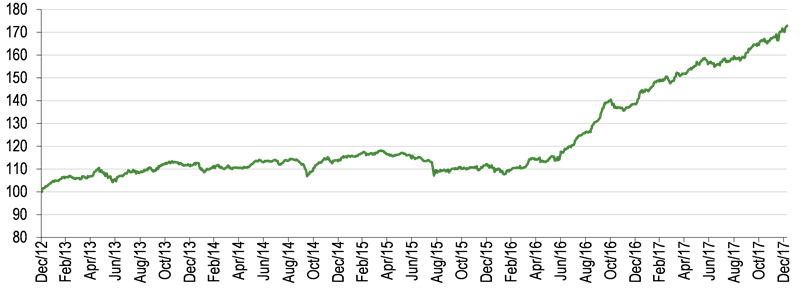
Miton Global Opportunities (MIGO) seeks to achieve capital growth, primarily through exploiting the pricing inefficiencies of investment trusts. The manager, Nick Greenwood, has over two decades of experience in identifying funds trading at deep discounts to embedded value. The unconstrained mandate also focuses on portfolio diversification across a broad range of asset classes and countries. Share price performance over the past two years has been strong in absolute terms and relative to global indices. Added to successful board initiatives to improve liquidity and promote the trust, MIGO has attracted significant interest from investors, and its shareholder base has rebalanced towards self-directed retail investors. The shares currently trade at a 1.4% discount to NAV, a significant narrowing from the five-year average discount of 7.9%. The board is currently seeking shareholder approval for a further issue of up to 10% of share capital.
Written by
Miton Global Opportunities |
Exploiting pricing inefficiencies |
Investment trusts |
5 February 2018 |
Share price/discount performance
Three-year performance vs index
Gearing
Analysts
|
|||||||||||||||||||||||||||||||||||||||||||||||||||||||||||||||||||||||||||||||||||||
Miton Global Opportunities (MIGO) seeks to achieve capital growth, primarily through exploiting the pricing inefficiencies of investment trusts. The manager, Nick Greenwood, has over two decades of experience in identifying funds trading at deep discounts to embedded value. The unconstrained mandate also focuses on portfolio diversification across a broad range of asset classes and countries. Share price performance over the past two years has been strong in absolute terms and relative to global indices. Added to successful board initiatives to improve liquidity and promote the trust, MIGO has attracted significant interest from investors, and its shareholder base has rebalanced towards self-directed retail investors. The shares currently trade at a 1.4% discount to NAV, a significant narrowing from the five-year average discount of 7.9%. The board is currently seeking shareholder approval for a further issue of up to 10% of share capital.
12 months ending |
Share price |
NAV |
3m Libor + 2% |
MSCI World |
FTSE All-Share (%) |
31/01/14 |
11.0 |
7.6 |
2.6 |
12.6 |
10.1 |
31/01/15 |
3.6 |
8.2 |
2.6 |
17.7 |
7.1 |
31/01/16 |
(0.5) |
(1.9) |
2.7 |
1.1 |
(4.6) |
31/01/17 |
41.0 |
34.5 |
2.6 |
32.8 |
20.1 |
31/01/18 |
28.8 |
20.3 |
2.5 |
11.9 |
11.3 |
Source: Thomson Datastream. Note: All % on a total return basis in GBP.
Investment strategy: Deep discounts, diversified
MIGO focuses on smaller-sized funds, where mispricing of underlying assets is more prevalent. Greenwood undertakes detailed due diligence of valuation and management to gain conviction in the underlying value of a fund, and identify catalysts for the discount to narrow. He also seeks broad diversification across asset classes and countries, as a result of which MIGO has low correlations to the FTSE 100 and MSCI World indices.
Market outlook: Benign, but valuations challenging
Equity markets have continued to perform well, with many achieving all-time highs on the back of accelerating and synchronous global growth. The outlook for global economic growth continues to be positive, and the IMF recently raised its forecast for 2018 and 2019 by 0.2pp to 3.9% pa. Meanwhile, central banks are signalling interest rate rises to be modest, leaving monetary conditions benign. However, valuations look more challenging, although some asset classes have been laggards.
Valuation: Narrow discount to NAV
MIGO currently trades at a 1.4% discount to NAV, a significant narrowing from its historic trend of trading at a persistent 8-12% discount to NAV. In addition to good fund performance, this also reflects successful initiatives taken by the board to improve MIGO’s appeal to investors. The board remains committed to managing the supply and demand for MIGO, and has requested shareholder approval for a second issue of new shares equivalent up to 10% of issued share capital.
Exhibit 1: Trust at a glance
Investment objective and fund background |
Recent developments |
||||||||||||||||||||||||||||||||||||||||||||||||||||||||||||||||||||||||||
Miton Global Opportunities (MIGO) (formerly MWGT) seeks to outperform three-month Libor plus 2% over the longer term, mainly through exploiting inefficiencies in the pricing of closed-end funds. The fund aims to provide a better return over the long term than shareholders would receive by placing money on deposit. The benchmark is only a target and is not a point of reference for the manager in selecting the portfolio. In its publications the trust also shows performance of the FTSE All-Share Index and MSCI World (£) for comparison. |
■ 20 December 2017: Interim results for six months ended 31 October. NAV TR +9.6% and share price TR +14.9% versus benchmark (sterling three-month Libor +2%) return of +1.2%. ■ 18 December 2017: Appointments of Richard Davidson and Katya Thompson as independent non-executive directors. ■ 28 June 2017: Results for the year ended 30 April. NAV TR +36.3% and share price TR +47.5% versus benchmark return of +2.4%. |
||||||||||||||||||||||||||||||||||||||||||||||||||||||||||||||||||||||||||
Forthcoming |
Capital structure |
Fund details |
|||||||||||||||||||||||||||||||||||||||||||||||||||||||||||||||||||||||||
AGM |
September 2018 |
Ongoing charges |
1.4% |
Group |
Miton Group |
||||||||||||||||||||||||||||||||||||||||||||||||||||||||||||||||||||||
Annual results |
July 2018 |
Gearing |
6.7% gross |
Manager |
Nick Greenwood |
||||||||||||||||||||||||||||||||||||||||||||||||||||||||||||||||||||||
Year end |
30 April |
Annual mgmt fee |
0.65% of market cap |
Address |
Paternoster House, 65 St Paul’s Churchyard, London EC4M 8AB |
||||||||||||||||||||||||||||||||||||||||||||||||||||||||||||||||||||||
Dividend paid |
N/A |
Performance fee |
No (see page 7) |
||||||||||||||||||||||||||||||||||||||||||||||||||||||||||||||||||||||||
Launch date |
6 April 2004 |
Trust life |
Indefinite (see page 7) |
Phone |
020 3714 1500 |
||||||||||||||||||||||||||||||||||||||||||||||||||||||||||||||||||||||
Continuation vote |
No (see page 7) |
Loan facilities |
£7m with RBS |
Website |
|||||||||||||||||||||||||||||||||||||||||||||||||||||||||||||||||||||||
Dividend policy and history (financial years) |
Share buyback policy and history (calendar years) |
||||||||||||||||||||||||||||||||||||||||||||||||||||||||||||||||||||||||||
The company has not historically paid dividends, providing the manager with flexibility in achieving MIGO’s investment objective (see Dividend policy, page 7). |
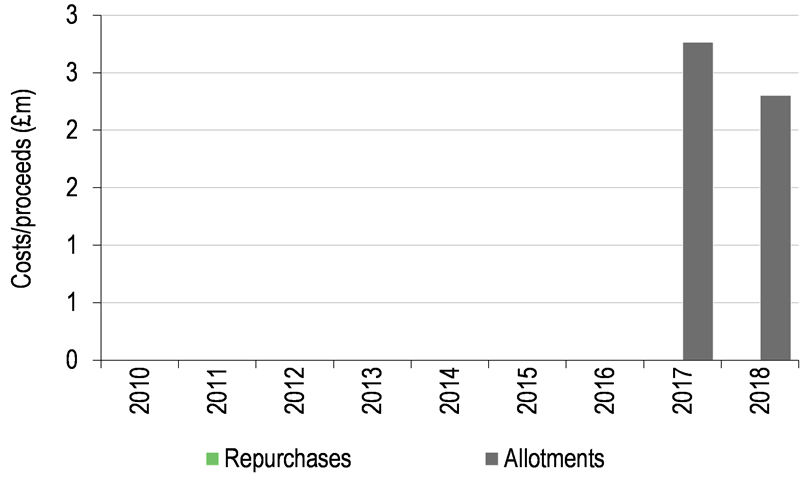
MIGO is authorised to repurchase up to 14.99% of its ordinary shares and allot up to 10% of the issued share capital to manage a discount or premium. |
||||||||||||||||||||||||||||||||||||||||||||||||||||||||||||||||||||||||||
|
|
||||||||||||||||||||||||||||||||||||||||||||||||||||||||||||||||||||||||||
Shareholder base (as at 24 January 2018) |
Portfolio exposure by geography (as at 31 December 2017) |
||||||||||||||||||||||||||||||||||||||||||||||||||||||||||||||||||||||||||
|
|
||||||||||||||||||||||||||||||||||||||||||||||||||||||||||||||||||||||||||
Source: Miton Global Opportunities, Edison Investment Research, Bloomberg, Morningstar. Note: *N/A where not in December 2016 top 10. **Taliesin in process of being acquired. |
|||||||||||||||||||||||||||||||||||||||||||||||||||||||||||||||||||||||||||
Market outlook: Monetary conditions remain benign
Equity markets around the world continued to perform strongly in 2017, with many indices achieving all-time highs on the back of synchronous and accelerating economic growth, and low interest rates. Equity valuations in many cases appear stretched relative to historical averages; however, the outlook for economic growth continues to be robust, and the IMF recently increased its global growth forecast for 2018 and 2019 by 0.2pp to 3.9% pa. Although interest rates have started to rise in some countries and central bankers are signalling tighter monetary policies, market expectations are for such moves to be modest, leaving monetary conditions reasonably benign for equities.
Fund profile: Discounted assets, well-diversified
MIGO was launched in 2004 as the iimia Investment Trust and was renamed Miton Worldwide Growth Trust when iimia Investment Management merged with MitonOptimal (now Miton Group). To better reflect the trust’s investment strategy, it took on its current name in January 2016. Nick Greenwood has managed the trust since its inception, seeking to exploit opportunities arising from special situations and mispricing of closed-ended funds, by undertaking his own research to find those trading at unjustifiable discounts to embedded asset values. Catalysts to redress the mispricing of assets can require patience, and MIGO’s closed-ended structure, protecting the trust from short-term inflows and outflows, is well-suited for its strategy. Although MIGO principally invests in closed-ended funds traded on the London Stock Exchange, it has the flexibility to invest in investment funds listed on other recognised exchanges, as well as open-ended funds. As at end-December 2017, MIGO had 56 holdings across a diverse range of assets and countries, although the top 30 account for almost 95% of the portfolio, reflecting a number of holdings in the process of liquidation or managed wind-down, or the patient building of less liquid investments.
The fund manager: Nick Greenwood
The manager’s view: Structural shifts positive for MIGO
Greenwood believes equity valuations are in “dangerous” territory. However, there is little appetite among central banks to raise interest rates materially, therefore stock markets may continue to be supported by excess liquidity. The timing and nature of a correction is difficult to predict; instead, Greenwood believes in owning a diversified portfolio of investments that trade at significant discounts to their underlying values, with low correlation to equity markets. MIGO’s correlation to each of the FTSE 100 and MSCI World indices is low, as measured by R-squared of 0.2 reflecting its broad exposures and the manager’s preference for owning “benign neglect” funds, ie those that have been abandoned by investors, often after short-lived disappointments.
The manager observes significant structural changes in the investment trust sector, which are a source of opportunities for MIGO. He notes that a significant consolidation of wealth managers, the traditional buyers of investment trusts, has created a few very large-sized players, resulting in increasing standardisation of portfolios and buying activity polarised towards the largest, most liquid trusts. As shown in Exhibit 2, investment trusts with market capitalisations above £250m have seen their discounts to NAV narrow over the past 18 months, indicating that buying activity has been concentrated in this segment. Trusts below this size are now often deemed too small for wealth managers, leaving a large universe of funds that are less well-followed. Many are invested in alternatives, where valuation data are less well understood, and trade at wider discounts. Greenwood believes these factors create opportunities for a diligent and specialist investor, such as MIGO.
Greenwood also observes a rapidly changing profile of investors in MIGO, who are increasingly self-directed retail investors via platforms (such as Hargreaves Lansdown). Platform investors accounted for around 9% of MIGO’s shareholder register around 18 months ago; today, this is over 40%. Although this may reflect the board’s successful measures to promote the trust, Greenwood believes MIGO is merely “ahead of the curve” and that its experience will become more widespread across other, smaller investment trusts. Unlike wealth managers, self-directed investors do not view small size and illiquidity as impediments to investment, and these shifts will result in a narrowing of discounts to NAV, while increasing share price volatility of funds in the short term, both of which are very positive for MIGO.
|
Exhibit 2: Discount by investment trust size over five years (%) |
|
|
Source: Thomson Datastream, Edison Investment Research. Note: Uses Datastream indices. |
Asset allocation
Investment process: Valuation due diligence is key
Nick Greenwood is a specialist investor in closed-end funds and has managed portfolios of investment trusts for over two decades, including MIGO since its inception in 2004. There are around 425 closed-end funds listed in London, of which over 300 have market capitalisations of less than £400m. This is the segment of greatest interest to the manager, as mispricing is most prevalent among smaller and less liquid funds. Greenwood draws on his depth of knowledge of the sector and applies a proprietary database to screen for ideas. He also monitors for developments that may be catalysts for narrowing discounts, including corporate actions, manager change and tender offers. Greenwood undertakes a detailed analysis of the embedded values of funds, and meets fund managers regularly. He may also engage with board members and some underlying investments. These are important parts of the investment process, which enable Greenwood to gain conviction in the underlying value of a fund and identify catalysts for the discount to narrow.
Although MIGO is unconstrained by asset class and geography, diversification is important and is carefully considered in portfolio construction. Holding sizes are influenced by the manager’s level of conviction in a fund, although initial sizes are often small, reflecting liquidity and valuation discipline.
Current portfolio positioning
As shown in Exhibits 1 (exposure by geography) and 3, MIGO is well diversified across countries and asset classes. Three investment themes have been of particular significance to MIGO over the past few years: Berlin residential property, India and private equity. Greenwood believes these themes have been very successful, but have largely “run their course”, and will become less prominent going forward.
■
Berlin - Berlin residential property fund Taliesin was MIGO’s largest holding, which Blackstone agreed to acquire in December 2017. Although the manager added to Phoenix Spree (another Berlin residential property fund), once the Taliesin transaction is completed MIGO’s exposure to Berlin property will be significantly reduced.
■
India - The manager maintains a positive long-term view on India’s growth prospects, and India Capital Growth Fund is MIGO’s second-largest holding. Greenwood, however, sees shorter-term headwinds, and has reduced the exposure in this fund from a recent peak of 9.0% to 6.9% as at end-December. India’s market valuation appears expensive relative to its own history, while a series of forthcoming elections, leading up to national elections in 18 months’ time, is likely to increase market volatility, and may cause investors to turn more cautious.
■
Private equity - Greenwood believes MIGO will see good opportunities to realise gains from its private equity exposure this year. Its funds are mature with attractive assets in a “seller’s market”. The manager notes that the sector has over US$1tn in ‘dry powder’ that needs to be invested in the near future, and expects the NAVs of MIGO’s positions to rise, and discounts to NAV to narrow, giving rise to profit-taking opportunities. Pantheon has been trimmed from 6.4% to 5.1% over the past year, and private equity in total accounted for 17.4% of the portfolio as at end-December 2017, down from 23.7% the previous year (Exhibits 3 and 4).
|
Exhibit 3: Asset allocation at 31 December 2017 |
Exhibit 4: Asset allocation as at 31 December 2016 |
|
|
|
Source: Miton Global Opportunities, Edison Investment Research |
|
Exhibit 3: Asset allocation at 31 December 2017 |
|
|
Source: Miton Global Opportunities, Edison Investment Research |
|
Exhibit 4: Asset allocation as at 31 December 2016 |
|
|
Source: Miton Global Opportunities, Edison Investment Research |
Macau residential property fund, Macau Property Opportunities has become the third-largest holding in MIGO, following strong performance. Although a government crackdown on corruption in the past two years depressed property prices, Greenwood believes the environment is now favourable for the fund. Four new casinos have opened recently, while a further two are near completion, altogether creating over 40,000 jobs. Meanwhile, a new bridge connecting Macau with Hong Kong and mainland China is due to open this year, boosting tourism prospects as it becomes significantly easier for visitors to access Macau. These factors should support a meaningful turnaround in the residential market.
More recent investments have included more mainstream assets. These includes a holding in Henderson Opportunities Trust, whose relatively small market capitalisation of less than £100m renders it too small for many wealth managers, despite being a well-regarded fund. MIGO acquired it on a discount to NAV of around 20%, and the manager believes the structural growth in self-directed investors will help this narrow over time. Atlantis Japan Growth (AJG) was also acquired at a deep discount to NAV. The manager believes the trust suffered from a misunderstanding of real returns, which were distorted by warrants issuance and, when taken into consideration, are stronger than suggested by headline returns. The share price had been weighed down by committed sellers, an overhang that has now been removed. In addition, a new manager was appointed in May 2016, with a stronger performance track record running the equivalent open-ended fund. Improved performance of AJG could act as a catalyst to narrow the discount to NAV.
Performance: Strong absolute returns
MIGO’s NAV total return has significantly outperformed its benchmark of three-month Libor +2% over all periods shown in Exhibit 6. As shown in Exhibits 5 and 6, the trust’s share price performance has performed even more strongly, reflecting the gradual disappearance of the discount to NAV since mid-2016, now at a modest premium. MIGO’s NAV total return has also outperformed the FTSE All-Share index over all periods except one month, although compared to the MSCI World index, performance has lagged over five and 10 years.
|
Exhibit 5: Investment trust performance to 31 December 2017 |
||||||||
Price, NAV and benchmark total return performance, one-year rebased |
Price, NAV and benchmark total return performance (%) |
|||||||
|
|
|||||||
|
Source: Thomson Datastream, Edison Investment Research. Note: Three-, five- and 10-year performance figures annualised. |
||||||||
|
Exhibit 6: Share price and NAV total return performance, relative to indices (%) |
||||||||
|
One month |
Three months |
Six months |
One year |
Three years |
Five years |
10 years |
|
Price relative to Libor + 2% |
2.3 |
8.6 |
14.8 |
33.4 |
70.0 |
94.3 |
45.7 |
|
NAV relative to Libor + 2% |
2.2 |
6.4 |
9.4 |
23.6 |
50.9 |
71.2 |
36.1 |
|
Price relative to MSCI World |
1.0 |
4.3 |
9.1 |
21.5 |
20.0 |
3.2 |
(20.9) |
|
NAV relative to MSCI World |
0.9 |
2.2 |
4.1 |
12.7 |
6.5 |
(9.1) |
(26.1) |
|
Price relative to FTSE All-Share |
(2.2) |
4.1 |
8.4 |
20.8 |
37.6 |
35.6 |
9.2 |
|
NAV relative to FTSE All-Share |
(2.3) |
2.0 |
3.3 |
12.0 |
22.1 |
19.5 |
2.0 |
|
|
Source: Thomson Datastream, Edison Investment Research. Note: Data to end-December 2017. Geometric calculation. |
||||||||
|
Exhibit 7: NAV total return performance relative to benchmark over five years |
||||||||
|
||||||||
|
Source: Thomson Datastream, Edison Investment Research |
||||||||
Capital structure and fees
MIGO is a conventional investment trust with one class of share; there are 27.1m ordinary shares in issue. In July 2017, the board obtained a block listing authority for 2.5m ordinary shares and in September 2017 gained authority to issue shares equal to 10% of the company’s issued share capital. Between 21 July 2017 and 21 January 2018, 1.8m ordinary shares have been issued, raising over £5m. In response to strong interest in MIGO shares and the desire to manage the share price premium, the board is seeking shareholder authority for another issue of ordinary shares equal to 10% of issued capital at a general meeting on 15 February 2018.
In September 2015, shareholders approved the removal of continuation votes in favour of a three-yearly opportunity to realise all or part of their investment, the first of which will take place September 2018. Shareholders electing realisation will be issued realisation shares, which will be separated into a distinct pool, managed with the aim of returning shareholders’ investment as soon as practicable.
Gearing is permitted up to 20% of net assets. MIGO has a £7m loan facility with Royal Bank of Scotland and, as at end-December 2017, had gearing gross of 6.7%. Miton Asset Management receives an annual management fee of 0.65% of net assets.
Dividend policy and record
MIGO’s focus is on exploiting inefficiencies in the valuations of investment trusts. It has not paid a dividend since launch, preferring to retain investment flexibility in this pursuit, without the need to take income generation into specific consideration.
Peer group comparison
MIGO is a member of the AIC Flexible Investment sector, a peer group of funds with broad investment mandates that may be absolute return or multi-asset focused. The diverse nature of the funds in this sector means direct comparisons may not be informative given the wide variation of mandates. In Exhibit 9, we have also included British Empire and Lazard World Trust, which are not members of this sector but follow broadly similar mandates. MIGO is one of the smallest funds by market capitalisation. However, its NAV total return performance compares well with these peers, in the top quartile over all periods shown below, ranking first over one and three years. It is one of two trusts that pay no dividends.
Exhibit 9: MIGO compared with AIC Flexible Investment and global sector peers as at 2 February 2018*
% unless stated |
Market cap £m |
NAV TR |
NAV TR |
NAV TR |
NAV TR 10 year |
Ongoing charge |
Perf. |
Discount (ex-par) |
Net |
Dividend yield (%) |
Miton Global Opportunities |
75.3 |
20.1 |
58.4 |
82.4 |
99.0 |
1.3 |
No |
(0.4) |
102 |
0.0 |
Aberdeen Diversified Income & Growth |
399.2 |
8.2 |
4.7 |
16.4 |
44.2 |
0.2 |
No |
(6.4) |
113 |
4.9 |
British Empire |
833.9 |
15.9 |
49.6 |
60.9 |
113.2 |
0.9 |
No |
(12.1) |
104 |
1.7 |
Capital Gearing |
214.6 |
2.2 |
18.4 |
25.7 |
93.4 |
0.9 |
No |
3.0 |
100 |
0.5 |
Establishment Investment Trust |
45.0 |
17.2 |
32.0 |
31.5 |
108.8 |
1.2 |
No |
(16.1) |
100 |
2.8 |
Henderson Alternative Strategies Trust |
112.0 |
6.4 |
23.8 |
18.6 |
(13.6) |
1.0 |
Yes |
(11.9) |
100 |
1.6 |
Invesco Perp Select Balanced |
9.8 |
7.7 |
16.3 |
26.2 |
|
1.2 |
No |
0.3 |
100 |
0.0 |
Lazard World Trust Fund |
141.5 |
19.5 |
51.6 |
84.0 |
90.8 |
1.4 |
Yes |
(2.9) |
100 |
3.3 |
New Star Investment Trust |
81.7 |
10.4 |
37.1 |
43.5 |
10.7 |
0.9 |
Yes |
(24.0) |
100 |
0.7 |
Personal Assets |
877.8 |
4.7 |
19.0 |
23.6 |
85.1 |
1.0 |
No |
1.1 |
100 |
1.4 |
RIT Capital Partners |
2,936.1 |
7.3 |
28.3 |
57.8 |
88.8 |
0.7 |
Yes |
3.4 |
104 |
0.0 |
Ruffer Investment Company |
399.5 |
0.8 |
10.5 |
20.3 |
109.3 |
1.2 |
No |
0.9 |
100 |
0.8 |
Seneca Global Income & Growth |
80.3 |
12.5 |
34.1 |
56.9 |
78.6 |
1.6 |
No |
2.3 |
104 |
3.6 |
Tetragon Financial |
1,235.6 |
(5.8) |
38.1 |
85.0 |
308.8 |
1.8 |
Yes |
(33.8) |
100 |
5.1 |
Overall average |
531.6 |
9.1 |
30.1 |
45.2 |
93.6 |
1.1 |
(6.9) |
102 |
1.9 |
|
MIGO rank in peer group |
12 |
1 |
1 |
3 |
5 |
4 |
7 |
5 |
12 |
Source: Morningstar, Edison Investment Research. Note: *Performance to 1 February 2018. TR = total return. Net gearing is total assets less cash and equivalents as a percentage of net assets (100 = ungeared).
The board
MIGO’s board is undergoing a refreshment process and currently has six independent directors. Chairman Anthony Townsend and audit committee chair James Fox have served on the board since the launch of the company, and announced their intentions to retire following a suitable handover period. On 18 December, Richard Davidson was appointed chairman-elect and Katya Thompson, chairman-elect of the audit committee. Both appointees bring considerable industry and financial experience to the board. Michael Phillips (a founder of MIGO’s original investment manager, iimia Investment Management) was also appointed at launch. Hugh Van Cutsem joined the board in 2010.
|
|
Research: TMT
discoverIE has further expanded its design and manufacturing business with the acquisition of Santon, a Dutch DC switch manufacturer, for initial consideration of €27m/£23.7m. The deal nearly doubles discoverIE’s sales into the renewables sector as well as increasing the level of business from Asia. Management expects the deal to be earnings accretive in FY19. We forecast that the acquisition will increase FY19e normalised EPS by 9% and will result in a net debt/EBITDA ratio of 1.7x by the end of FY19.