Entertainment One
Written by
Entertainment One |
Strong first-half performance, full year on track |
Interim results update |
Media |
22 November 2016 |
Share price performance
Business description
Next events
Analysts
Entertainment One is a research client of Edison Investment Research Limited |
|||||||||||||||||||||||||||||||||||||||||||||||||||||||
Strong performances across all Entertainment One’s (eOne’s) divisions underpinned 19% reported revenue growth in H117. With a significant proportion of its slate commissioned or contracted in Television, a good roster of films and strong momentum internationally in Family, the full year is on track to meet management’s expectations. We maintain our forecasts and believe the shares, trading at a considerable discount to peers, do not yet reflect the more balanced structure of the group, or its stronger operational performance.
Year end |
Revenue (£m) |
EBITDA |
PBT* |
EPS* |
DPS |
P/E |
Yield |
03/15 |
785.8 |
107.3 |
88.8 |
20.8 |
1.1 |
11.6 |
0.5 |
03/16 |
802.7 |
129.1 |
104.1 |
19.4 |
1.2 |
12.4 |
0.5 |
03/17e |
1,003.1 |
157.0 |
126.7 |
20.0 |
1.3 |
12.0 |
0.5 |
03/18e |
1,093.9 |
178.0 |
149.4 |
23.7 |
1.4 |
10.2 |
0.6 |
Note: *PBT and EPS are normalised, excluding amortisation of acquired intangibles, share-based payments and exceptional items.
Strong revenue growth across all divisions
As indicated at the recent trading update, the first half was good operationally for eOne. Reported revenue growth of 19% reflects continued strong performances from Television (+34%) and Family (+16%) and the recovery in Film (+9%), which was buoyed by a strong box office performance. The upfront minimum guarantees (MGs) and advertising associated with the cinematic release of major titles resulted in considerable margin compression in Film and a reduction in overall EBITDA year-on-year. However, this is entirely consistent with the usual cash flow characteristics of a film’s release and eOne will reap the benefits in the second half of the year as these titles move to the more profitable secondary windows.
Good pipeline underpins forecasts for a strong H2
The outlook for the second half across all divisions looks strong. Within Television a significant proportion of full-year revenues are already commissioned or contracted. Film has a strong H2 cinema slate as well as secondary windows for The BFG and The Girl on a Train and in Family Peppa and PJ Masks continue to charm international audiences, particularly in the US where Peppa sales increased 275% in H1 and where management expects a very strong performance in H2. After 10 years at the group, CFO Giles Willits also announced his intention to step down from the board.
Valuation: Discount unjustified
eOne has secured access to some of the industry’s leading producers. Yet, with an EV not far off its $1.5bn library valuation (£1.1bn adjusted for minorities), there is little in the price reflecting these relationships, or the value of its sales network. With eOne trading on FY17e EV/EBITDA of 8.8x and P/E of 12x, which is a considerable discount to peers, we see scope for rating improvement. Operationally, the group is performing well across all three divisions and the outlook for the second half is strong. Structurally, eOne has made considerable progress in delivering on its strategy to become a more balanced content group that is well positioned in the dynamic markets for premium content.
Interim results summary
Good H1 performance puts full year on track
H117 results reflect the increased level of investment in content and production, which has underpinned a recovery in Film, ongoing strong growth in Television and a continued strong performance from Family, notably in the US. Revenue and EBITDA performance in H1 is line with management’s full-year plan and we make no changes to our earnings forecasts.
Exhibit 1: Summary H1 results and forecasts, £m
Summary results |
H116 |
H216 |
FY16 |
|
H117 |
H117 chg |
|
H217e |
FY17e |
FY18e |
|
Television revenues |
107.6 |
137.1 |
244.7 |
144.5 |
34.3% |
226.1 |
377.9 |
452.0 |
|||
Family revenues |
32.7 |
33.9 |
66.6 |
37.9 |
15.9% |
40.4 |
78.3 |
91.8 |
|||
Film revenues |
221.6 |
331.8 |
553.4 |
242.0 |
9.2% |
360.0 |
602.0 |
610.1 |
|||
Eliminations |
(24.8) |
(37.2) |
(62.0) |
(23.4) |
(31.6) |
(55.0) |
(60.0) |
||||
Total revenues |
337.1 |
465.6 |
802.7 |
401.0 |
19.0% |
594.8 |
1,003.1 |
1,093.9 |
|||
Television EBITDA |
20.2 |
19.1 |
39.3 |
18.5 |
-8.4% |
30.3 |
49.7 |
56.8 |
|||
Family EBITDA |
21.9 |
21.4 |
43.3 |
24.7 |
12.8% |
31.3 |
56.0 |
61.0 |
|||
Film EBITDA |
12.9 |
39.9 |
52.8 |
(2.3) |
-117.8% |
60.0 |
57.7 |
66.6 |
|||
Eliminations |
(3.2) |
(3.1) |
(6.3) |
(3.2) |
(2.3) |
(6.4) |
(6.4) |
||||
Total EBITDA |
52.0 |
80.2 |
129.1 |
37.7 |
-27.5% |
119.3 |
157.0 |
178.0 |
|||
EBITDA margin |
15.4% |
15.3% |
16.1% |
9.4% |
20.1% |
15.7% |
16.3% |
||||
PBT |
39.9 |
64.2 |
104.1 |
23.8 |
-40.4% |
102.9 |
126.7 |
149.4 |
|||
EPS |
8.0 |
11.4 |
19.4 |
2.6 |
-67.5% |
17.4 |
20.0 |
23.7 |
|||
Investment in content & production |
104.9 |
113.6 |
218.5 |
198.4 |
89.1% |
236.6 |
435.0 |
500.0 |
|||
Free cash flow |
(30.8) |
74.1 |
43.3 |
(65.3) |
90.1 |
24.8 |
28.3 |
||||
Net debt |
180.8 |
180.8 |
263.3 |
174.1 |
174.1 |
151.8 |
|||||
Gearing |
1.4x |
1.1x |
0.9x |
||||||||
Source: eOne (historic), Edison Investment Research (forecasts)
Reported revenues increased 19% to £401m with strong growth across all divisions: Television 34%, Family 16% and Film 9%. Acquisitions contributed £20.7m to revenue growth and currency movements 9%. Group EBITDA of £38m was down 28% from the £52m reported last year (down 33% on a constant currency basis) due to the normal timing impact of elevated advertising spend and the upfront payment of MGs associated with a strong box office (theatrical revenues increased 87%), as well as the impact of one-off accounting changes at MGC following its acquisition in May 2015 (on a like-for-like basis, Television EBITDA increased by 13%).
Management has confirmed that this EBITDA performance is in line with its plan for the full year where the group should benefit from the higher-margin home entertainment sales that follow successful cinema releases. Together with higher financing costs following last December’s refinancing, this weaker EBITDA performance translated into a lower PBT of £24m (£40m in H116).
Investment in content (£130m) and production (£68m) in H1 amounted to £198m, 89% higher than H115, supporting the strong Film slate and Television production activities. An adjusted operating cash outflow of £44m reflects both the step up in content investment within Film (investment in content gap of £43m) on the back of a stronger release slate, as well as working capital outflows of £45m. These working capital movements relate principally to seasonal timing differences in Film, increased accruals at MGC and a reduction in deferred revenues at Renegade 83. Net debt increased to £263m (from £181m at March 2016). However, with a seasonally much stronger second half, this is expected to reduce by the year end to a gearing of 1.1x to 1.2x EBITDA (previous guidance 1.1x). The increased investments made in Television production reflected in a £21m increase in the use of production finance (£139m at the period end).
With a significant proportion of H217 activities already commissioned or contracted, management believes the group is on track to deliver full-year EBITDA expectations. We make no change to estimates other than to reduce our forecast investment in content and production for the year from £475m to £435m.
After 10 years at the group, CFO Giles Willits also announced his intention to step down from the board with immediate effect. Joe Sparacio will take up the role on an interim basis.
Divisional performance
eOne is now two years into its five-year plan to double the size of the business (which we interpret to mean £200m of EBITDA by 2020) and create a significant, broad-based brand and content group. The emphasis of eOne’s growth strategy is to consolidate its position in Film while rebalancing the business towards the faster-growing, higher-margin and arguably lower-risk Television and Family divisions.
Since announcing its strategy, eOne has made two significant acquisitions as well as a few smaller ones, mainly within the Television and Family divisions: the acquisition of a 51% stake in MGC in January 2015 for £86m, and a further 35% in its largest Family brand Peppa Pig in October 2015 for £140m, followed by a smaller deal to buy 65% of Renegade 83 in March 2016 (£23m). It has also continued to forge links with high-profile film producers through acquisitions and partnerships; in December 2015 eOne took a stake (cost undisclosed) in Spielberg’s new venture Amblin Partners and acquired Sierra Pictures.
These investments have considerably altered the shape of the group, which now has more diversity in its earnings base; investment in Television was roughly the same as that in Film last year and for the first time in FY17 we expect the three divisions to contribute roughly equally in terms of EBITDA. In FY17, before central costs, we are forecasting Television to contribute 30% of EBITDA, Film 35% and Family 34%, tilting the balance towards the higher-growth, higher-margin divisions. With a more balanced structure in place, the focus of investment is now on supporting organic growth.
The first-half results, which we discuss in more detail below, reflect the progress being made to create a balanced content group of growing scale.
Television: Expansion in production on track
Investment in Television increased by approximately 50% in H1 to £102m as eOne continues to ramp its production activities. This strong investment profile was reflected in the 34% revenue growth to £144m, with EBITDA of £19.4m (up 18% on a like-for-like basis once the one-off impact of accounting changes to MGC are adjusted for). The pipeline looks particularly strong at both eOne Television, which is on track to deliver its targeted 1,100 half hours of content this year and has 86% of its planned slate for the year already delivered, commissioned or contracted, as well as at MGC, which is now delivering two new productions under the new studio model and has approximately 90% of its full year plan already delivered, commissioned or contracted.
We present the Television division results in Exhibit 2 and outline some of the key developments in the period below.
Exhibit 2: Television results and forecasts
£m |
H116 |
H216 |
FY16 |
H117 |
y-o-y growth |
H217e |
FY17e |
FY18e |
eOne Television |
81.6 |
106.3 |
187.9 |
97.7 |
19.7% |
143.2 |
240.9 |
256.0 |
MGC |
7.9 |
6.7 |
14.6 |
28.3 |
258.2% |
64.4 |
92.7 |
150.0 |
Music |
18.1 |
24.1 |
42.2 |
25.8 |
42.5% |
18.5 |
44.3 |
46.0 |
Elimination |
0.0 |
|
|
(7.3)* |
|
|
|
|
Total Television division revenues |
107.6 |
137.1 |
244.7 |
144.5 |
34.3% |
226.1 |
377.9 |
452.0 |
eOne Television EBITDA |
7.9 |
15.0 |
22.9 |
7.9 |
0.0% |
20.6 |
28.5 |
31.6 |
MGC EBITDA |
12.3 |
2.1 |
14.4 |
9.0 |
-26.8% |
9.0 |
18.0 |
21.2 |
Music EBITDA |
0.2 |
1.8 |
2.0 |
2.5 |
N/A |
0.7 |
3.2 |
4.0 |
Elimination |
(0.2) |
0.2 |
0.0 |
(0.9)* |
||||
Total Television EBITDA |
20.2 |
18.9 |
39.3 |
18.5 |
-8.4% |
30.3 |
49.7 |
56.8 |
EBITDA margin |
19.0% |
13.8% |
16.1% |
12.8% |
13.4% |
13.2% |
12.6% |
|
Investment: |
||||||||
eOne Television – content |
14.3 |
4.2 |
18.5 |
11.2 |
-22% |
18.8 |
30.0 |
32.1 |
eOne Television – production |
52.7 |
20.6 |
73.3 |
63.7 |
21% |
46.3 |
110.0 |
117.9 |
eOne Television – total |
67.0 |
24.8 |
91.8 |
74.9 |
65.1 |
140.0 |
150.0 |
|
MGC – production |
0.0 |
7.6 |
7.6 |
25.2 |
54.8 |
80.0 |
110.0 |
|
Music/ other – production |
1.3 |
1.8 |
3.1 |
2.0 |
1.0 |
3.0 |
3.0 |
|
Total Television investment |
68.3 |
34.2 |
102.5 |
102.1 |
49.5% |
120.9 |
223.0 |
263.0 |
Source: eOne (historic), Edison Investment Research (forecasts). Note: *Eliminations from international sales at MGC.
Television includes its portfolio of television production companies (its 51% interest in MGC, Paperny Entertainment, Force Four Entertainment, 65% of Renegade 83, and eOne’s original television business), its international television sales business, its music labels and the digital content studio Secret Location (the remaining 50% of which was bought in August 2016).
eOne Television delivered 360 half hours of programming in H1. Although down on the 442 delivered in H116, organic revenue growth was 20% and, with a strong pipeline going into the second half, a development slate with over 100 projects in progress and 15 new first look and development deals signed, eOne Television appears comfortably on track to deliver the targeted £140m of investment across the full year (up c 40% on FY16) and 1,100 half hours of content. More specifically:
■
In scripted television, new commissions include the serialised crime drama Cardinal and hostage series Ransom. Private Eyes and You Me Her (new last year) have been re-ordered for additional seasons. The second-half pipeline includes new shows Mary Kills People and Ice and renewals Rogue 4 and Saving Hope 5.
■
As well as recurring series, non-scripted television is benefiting from Renegade 83’s new season of Naked and Afraid and new commissions for The School and Border Security US from Paperny Entertainment and Force Four, respectively.
■
The stronger Television production pipeline also serves to feed the international sales business, which is reportedly on track for a record year, with a growing number of buyers for eOne-produced shows as well as the first programme produced by the MGC under its new distribution agreement with eOne; Designated Survivor has generated strong international sales interest including a worldwide (ex US) streaming rights deal with Netflix. As MGC ramps production in the coming periods this should further contribute to eOne’s Television sales inventory.
MGC generated revenues of £28.3m, an increase of 258% y-o-y. Like-for-like comparisons are complicated by the fact that last year was a year of transition for the company, which, following its partnership with eOne, has changed its business model, as well as bringing its accounting practices into line. The current year provides a better benchmark for the group moving forward. Revenues now comprise a mixture of profit participations from its pre-existing library staples (Criminal Minds – Series 12, Criminal Minds Beyond Borders – Series 2 in production, Grey’s Anatomy – Series 13, Ray Donovan – Series 4 and Quantico – Series 2), as well as first revenues from productions contracted under the new independent studio model.
While MGC continues to see growth from its existing library staples, the vast majority of the increase in revenues is derived from delivery of its new productions (delivered under the new independent studio model). The first three episodes of Designated Survivor were delivered in the period to ABC and a further 19 episodes have been ordered (for delivery in the second half and beyond). The show premiered as ABC’s strongest scripted telecast in its timeslot in four years and claimed TV’s largest-ever total viewer lift for any single telecast. Conviction, MGC’s second show under the new arrangement, has also been picked up by ABC and started broadcasting in October. Along with the remaining episodes of Designated Survivor and associated international sales revenues from these shows, this will contribute to further strong growth in revenues in the second half.
Guidance for programme investment at MGC this year has been reduced to £80m (from £100m) but remains a significant increase on last year’s £7.6m. It is worth remembering that eOne’s capital risk on this investment is approximately 15-20% once broadcaster commitments received prior to green lighting and government subsidies are taken into account. MGC appears to be delivering on high expectations at the time of acquisition. It has over 30 other television projects and several film projects in development, featuring a star-studded list of directors and actors, which should support our forecast ramp up in investment and sales into 2017 and beyond.
The Music division, following the recent acquisition of Dualtone Music Group in January 2016 and Last Gang Entertainment (March 2016), is becoming more significant in the group context. Revenues in H1 increased by 43% to £26m and EBITDA of £2.5m compares to a prior year H1 of £0.2m. Much of this growth is acquisition related, although its urban labels had a strong line up and The Lumineer’s Cleopatra (Dualtone) performed well, reaching number one on the US Billboard 200. In H117 45 albums and 98 digital singles were released, compared to 32 and 59, respectively, in H1 last year. As for in the Film division, eOne is also restructuring its physical distribution activities in music. As of this year, Warner Music’s ADA will handle physical sales and distribution in the US and Canada enabling eOne to exit its own activities.
Music also includes the activities of Secret Location. eOne took an initial stake in the digital content studio in 2014 and in August 2016 acquired the remaining 50%. This is a strategic investment, providing eOne a foothold into this emerging content genre. While fairly immaterial to the group’s current financial performance, the studio is involved in developing content for the rapidly evolving virtual reality industry. A number of these projects are already being monetised and additional game launches are planned for 2017.
Family: Peppa and PJ Masks charm US children
Family revenues increased by 16% to £38m, with EBITDA increasing 13% to £25m. As in recent periods, strong performances from Peppa as well as the newer properties, particularly PJ Masks, have underpinned growth. On the back of encouraging US holiday season sell-in data from licensees on both Peppa Pig and PJ Masks, management appears very confident about the second-half outlook, indicating it should drive higher than forecast licensing and merchandising sales.
Exhibit 3: Family results and forecasts
£m |
H116 |
H216 |
FY16 |
H117 |
y-o-y growth |
H217e |
FY17e |
FY18e |
Family revenues |
32.7 |
33.9 |
66.6 |
37.9 |
15.9% |
40.4 |
78.3 |
91.8 |
Family EBITDA |
21.9 |
21.4 |
43.3 |
24.7 |
12.8% |
31.3 |
56.0 |
61.0 |
EBITDA margin |
67.0% |
63.1% |
65.0% |
65.2% |
77.5% |
71.5% |
66.4% |
|
Family – investment in content |
0.5 |
1.1 |
1.6 |
0.7 |
0.4 |
0.7 |
1.4 |
2.2 |
Family – investment in production |
1.9 |
2.3 |
4.2 |
1.6 |
-0.2 |
2.0 |
3.6 |
5.8 |
Family – total investment |
2.4 |
3.4 |
5.8 |
2.3 |
-4.2% |
2.7 |
5.0 |
8.0 |
Source: eOne (historic), Edison Investment Research (forecasts)
Peppa, Family’s principal asset, continues to perform well across all its territories – notably the US, where revenues increased by 275% in the period and where Peppa was the bestselling preschool girls’ toy in September 2016. This is subsequently being backed up by an extension of merchandise ranges and in-store promotions. Exposure also continues to grow in China, where Peppa is now one of the most popular programmes for preschoolers on state broadcaster CCTV and also has a phenomenal following on local video hosting sites (Peppa has generated eight billion views on iQiyi, Youku and Tudou), which has resulted in the launch of a steadily increasing range of merchandise by the major online retailers (Jing Dong and Tmall), and in store at Toys R Us. The roll out of Peppa across the US, emerging Europe and Asia should continue to support strong momentum in the brand, which is being refreshed with the addition of 52 new television episodes (10 delivered in the period) and a first film planned for release next Easter. Peppa generated $1.1bn in retail sales in 2016 and management continues to believe it has the potential to reach $2bn.
While Peppa clearly has ongoing strong momentum, eOne has also been focused on diversifying its range of children’s assets, a number of which are starting to gain considerable traction. PJ Masks, Winston Steinburger and Sir Dudley Ding Dong and Ben and Holly’s Little Kingdom continue to build audiences in the US in particular and licensing momentum is following, with a wider retail launch planned for these brands in early 2017.
Film: A more robust performance
Film revenues increased by 9% to £242m, underpinned by a very strong performance at the box office, offsetting the headwind faced in home entertainment from the weaker cinema slate last year and the ongoing structural shifts to digital platforms.
The upfront payment of MGs along with P&A costs associated with a strong cinema release slate meant an EBITDA loss in H1 of £2m. This EBITDA profile is entirely consistent with the typical cash flow characteristics of major film releases, which are supported by intense advertising (P&A) spend to support the theatrical release, which then drives higher-margin revenues from the subsequent release windows (home entertainment, digital and broadcast). The second-half outlook for film distribution looks strong and we expect the EBITDA margin to normalise across the year as the films progress to secondary windows and as the benefits of the £10m cost-saving programme continue to incrementally contribute.
Exhibit 4: Film results and forecasts
£m |
H116 |
H216 |
FY16 |
H117 |
y-o-y growth |
H217e |
FY17e |
FY18e |
Revenues |
||||||||
Theatrical |
22.7 |
42.2 |
64.9 |
42.5 |
87.2% |
81.1 |
123.6 |
112.0 |
Home entertainment |
79.2 |
113.2 |
192.4 |
58.6 |
-26.0% |
106.2 |
164.8 |
171.0 |
Broadcast and digital |
80.1 |
109 |
189.1 |
75.4 |
-5.9% |
115.2 |
190.6 |
209.6 |
Production and int. sales |
26.5 |
33.9 |
60.4 |
56.5 |
113.2% |
24.5 |
81.0 |
80.0 |
Other |
14.4 |
34.1 |
48.5 |
11.5 |
-20.1% |
33.5 |
45.0 |
40.5 |
Eliminations |
(1.3) |
(0.6) |
(1.9) |
(2.5) |
|
(0.5) |
(3.0) |
(3.0) |
Film division revenues |
221.6 |
331.8 |
553.4 |
242.0 |
9.2% |
360.0 |
602.0 |
610.1 |
Film EBITDA |
12.9 |
39.9 |
52.8 |
(2.3) |
-117.8% |
60.0 |
57.7 |
66.6 |
EBITDA margin |
5.8% |
12.0% |
9.5% |
-1.0% |
16.7% |
9.6% |
10.9% |
|
Investment* |
||||||||
Film I in content |
30.6 |
67.7 |
98.3 |
97.7 |
219.3% |
62.3 |
160.0 |
179.0 |
Film I in production |
3.6 |
8.3 |
11.9 |
(3.7) |
-202.8% |
50.7 |
47.0 |
50.0 |
Film – total I |
34.2 |
76.0 |
110.2 |
94.0 |
175% |
108.0 |
202.0 |
229.0 |
Source: eOne (historic), Edison Investment Research (forecasts). Note: *I = investment.
After two difficult years, Film has had a stronger period in the box office. Although the absolute number of releases is down year-on-year (85 vs 96 last year), there have been a number of high-profile releases including The BFG, David Brent: Life on the Road, Eye in the Sky and Bad Moms, among others. Box office takings in H1 were $152m compared to $97m last year.
The slate for the second half looks similarly strong, including The Girl on the Train (which has already generated £23m in UK box office takings since its debut in early October), Arrival, Office Christmas Party (the third title from eOne’s association with Spielberg’s Amblin Partners), Bad Santa 2, Lion and La La Land. Full-year investment in acquired content is expected at approximately £160m, unchanged from previous guidance, and far more promising than last year’s subdued investment of £98m. A stronger cinema release slate should, in coming periods, translate to a better home entertainment and digital performance where revenues declined 26% and 6%, respectively, in H117, affected by structural changes in the industry as well as the weaker box office performance over the last two years.
Production and international sales (+113%) reflect the investment made in Sierra Pictures in December 2015 and the buy-out of the remaining interest in Sierra Affinity (the international sales business managed by Sierra Pictures) in September 2016.
Filming has started on a number of new productions in the period (including Villa Capri starring Tommy Lee Jones, Morgan Freeman and Rene Russo, and Xavier Dolan’s The Death and Life of John F. Donovan) and eOne also signed a first-look deal with Tooley Productions (producer of The Fighter and Limitless) and already has one project in development as a result of this partnership (Fool Me Once, starring Julia Roberts). However, across the year, the production schedule has slipped and management now budgets £45m investment for the film production division (from £70m previously).
Overall, we expect a good second-half revenue performance in Film and a recovery in EBITDA margins as key cinema releases move through the more profitable distribution windows, supported by the incremental benefit of eOne’s cost-saving initiatives. The new home entertainment distribution partnerships with 20th Century Fox Home Entertainment (multi-territory) and Sony Pictures Home Entertainment (US), part of eOne’s £10m restructuring programme in Film, are on target to be fully integrated by the end of the financial year.
Cash generation and net debt
The three divisions each have distinct growth, margin, investment and cash-flow dynamics, and unpicking the cash flow in the past has been challenging. However, management has started to provide a considerable amount of detail on divisional cash flows as well as the use of production financing structures, which provides a clearer understanding of the underlying dynamics of each division.
Exhibit 5 summarises divisional cash flow performance. It distinguishes activities funded by the group’s own balance sheet from those funded by production financing (PF) arrangements. This distinction is made as PF is considered to be akin to working capital finance. It is arranged on an individual production basis by special purpose vehicles (SPVs), which are ring-fenced from the group (if a production is not delivered, it is the SPV that is affected, not the group as a whole – this has never happened to eOne). The PF financing is short term, and is paid back once the production is delivered. A higher level of production debt, in theory, should reflect a better outlook for the group as a whole as it is indicative of a strong pipeline of activities, which (once the PF has been repaid) go on to drive revenues across the group.
Exhibit 5: Summary H116 cash flows
£m |
Non IPF funded business |
|
IPF funded business |
|||||||||||||
TV |
Family |
Film |
plc |
Total |
|
TV |
Family |
Film |
plc |
Total |
||||||
EBITDA |
21.2 |
24.8 |
(3.2) |
(3.2) |
39.6 |
|
(2.7) |
(0.1) |
0.9 |
(1.9) |
||||||
Production IIC* gap |
1.5 |
(1.3) |
1.4 |
1.6 |
|
(48.4) |
0.8 |
24.9 |
(22.7) |
|||||||
Content IIC* gap |
2.4 |
(0.3) |
(43.3) |
(41.2) |
|
|
||||||||||
Working capital |
(13.7) |
(6.6) |
(24.4) |
(44.7) |
|
33.2 |
(0.5) |
(13.2) |
19.5 |
|||||||
JV movements |
0.3 |
0.3 |
|
0.0 |
||||||||||||
Adjusted cash flow |
11.7 |
16.6 |
(69.5) |
(3.2) |
(44.4) |
|
(17.9) |
0.2 |
12.6 |
|
(5.1) |
|||||
Cash conversion |
55% |
67% |
N/A |
100% |
-112% |
|
663% |
-200% |
1,400% |
268% |
||||||
Capital expenditure |
(0.9) |
|
(0.1) |
|||||||||||||
Tax paid |
(7.1) |
|
(1.6) |
|||||||||||||
Net interest paid |
(12.9) |
|
|
|||||||||||||
Free cashflow |
|
|
|
|
(65.3) |
|
|
|
|
|
(6.8) |
|||||
One-off items |
(7.0) |
|
(0.4) |
|||||||||||||
Acquisitions net of production financing acquired |
(2.1) |
|
||||||||||||||
Other |
(0.9) |
|
|
|||||||||||||
Dividends paid |
(6.8) |
|
|
|||||||||||||
Foreign exchange |
(0.6) |
|
(13.5) |
|||||||||||||
Movement |
|
|
|
|
(82.5) |
|
|
|
|
|
(20.7) |
|||||
Net financing/debt at the start of the period |
180.8 |
|
118.0 |
|||||||||||||
Net financing/debt at the end of the period |
263.3 |
|
138.7 |
|||||||||||||
Source: eOne. Note: The IIC gap is the difference between content or production investment and related amortisation.
Group EBITDA (excluding that funded by PF activities) of £39.6m is converted to an adjusted cash outflow of £44m. The difference is accounted for by the step up in investment in content investment within Film (investment in content gap of £43m) on the back of a stronger release slate as well as a working capital outflow of £45.6m.
In Television, the working capital outflow stemmed principally from increased accruals at MGC and a reduction in deferred revenue at Renegade 83. In Film, working capital was affected by lower receivables as a result of the transition of physical distribution to Sony Pictures Home Entertainment in the US (part of the restructuring plans) and a decrease in broadcast and digital receivables due to lower sales, offset in part by a seasonal decrease in payables (which should reverse in the second half). Net debt increased to £263m (from £181m at March 2016). With a seasonally much stronger second half, this is expected to reduce by the year end to gearing of 1.1x to 1.2x (previous guidance 1.1x).
Use of production finance increased by £21m to £139m as a result of the ramp up in investment in Television, while Film, where the level of production activities was lower in the first half (there were a number of films in production last year including Eye in the Sky), generated positive cash flows.
Investment case and valuation
While the shares have performed well in recent months, we believe the current share price continues to offer considerable upside.
The most recent independent valuation of eOne’s library dated 31 March 2016 was $1.5bn (£1.2bn), or about £1.1bn deducting the minority interest of 51%-owned MGC (since the library value includes 100% of MGC’s library). Even allowing for some need to adjust for other Television JV minorities, this suggests the greater part of eOne’s market value (current EV of £1.3bn excluding production finance, or £1.4bn inclusive) is underpinned by the library, leaving little in the valuation ascribed by the market for its network of relationships with many of the industry’s leading producers, or its extensive sales network.
When compared to peers, eOne’s March 2017 EV/EBITDA rating of 8.8x and P/E of 12.0x are at considerable discounts to its closest US peer Lions Gate Entertainment (trading at 21.6x EV/EBITDA and 32.1x P/E in FY16e).
Investors should consider the following:
■
The market for premium content remains dynamic and eOne, which has extended its partnerships and investments over the last two years, is well positioned in these markets.
■
On an EBITDA basis, the acquisitions made over the last two years, together with eOne’s organic investments, have firmly tilted the shape of the group towards the higher-margin, higher-growth Family and Television divisions (61% of FY16 EBITDA) and we believe the group has a much better overall structure.
■
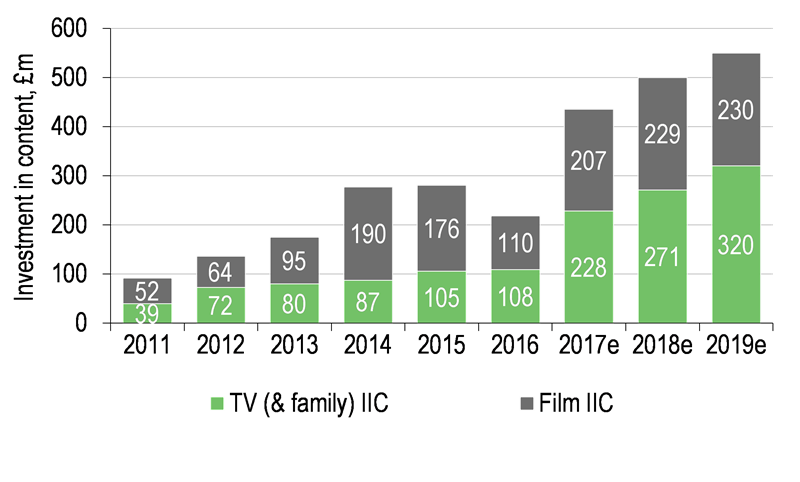
Operationally, all divisions are performing well. After a difficult few years in Film, and a weaker than planned investment in Television last year, eOne is now on track to double investment in content and production across the group this year. In H117, eOne delivered strong revenue growth, which puts it on course to double EBITDA (from FY14 level of £107m) by 2020 as targeted by management (Exhibit 6 and 7).
■
With a forecast year-end gearing of 1.1x to 1.2x EBITDA, and much of the group’s planned expansion in production funded via working capital facilities, eOne has the balance sheet flexibility to continue to make bolt-on acquisitions to support its strategy.
|
Exhibit 6: EBITDA historic and forecast |
Exhibit 7: Investment in content |
|
|
|
Source: eOne (historic), Edison Investment Research (forecasts) |
|
Exhibit 6: EBITDA historic and forecast |
|
|
Source: eOne (historic), Edison Investment Research (forecasts) |
|
Exhibit 7: Investment in content |
|
|
Source: eOne (historic), Edison Investment Research (forecasts) |
Exhibit 8: Summary peer valuations
Company |
Share price |
Market Cap |
Sales growth |
EBITDA margin (%) |
EPS growth |
EV/Sales |
EV/EBITDA |
EV/EBIT |
P/E |
|||||||
ccy |
Ccy m |
This |
This |
This yr |
This |
Next |
This |
Next |
This |
Next |
This |
Next |
This |
Next |
||
Entertainment One |
241 |
1,035 |
25 |
9% |
16 |
3.1 |
18.4 |
1.3 |
1.2 |
8.3 |
7.3 |
8.6 |
7.5 |
12.0 |
10.2 |
|
Entertainment One adjusted for minorities* |
241 |
1,035 |
25 |
9 |
15 |
3.1 |
18.4 |
1.3 |
1.2 |
8.8 |
7.7 |
9.6 |
8.4 |
12.0 |
10.2 |
|
Walt Disney Co/ |
98 |
157,882 |
10 |
6 |
31 |
20.5 |
11.7 |
3.0 |
2.8 |
9.7 |
9.0 |
11.2 |
10.4 |
16.5 |
14.7 |
|
ITV |
1.7 |
6,823 |
5 |
1 |
29 |
33.1 |
(1.2) |
2.4 |
2.3 |
8.2 |
8.2 |
9.3 |
9.1 |
10.3 |
10.4 |
|
Lions Gate Entertainment |
23 |
3,446 |
14 |
12 |
9 |
112.6 |
14.7 |
1.9 |
1.7 |
21.6 |
18.7 |
463.0 |
55.5 |
32.1 |
28.0 |
|
Source: Bloomberg, Edison Investment Research. Note: *Adjusted for MGC forecast EBITDA and EBIT.
Exhibit 9: Financial summary
£m |
2014 |
2015 |
2016 |
2017e |
2018e |
||
Year end 31 March |
IFRS |
IFRS |
IFRS |
IFRS |
IFRS |
||
PROFIT & LOSS |
|||||||
Revenue |
823.0 |
785.8 |
802.7 |
1,003.1 |
1,093.9 |
||
Cost of Sales |
(642.3) |
(578.0) |
(610.1) |
(762.4) |
(831.4) |
||
Gross Profit |
180.7 |
207.8 |
192.6 |
240.8 |
262.5 |
||
EBITDA |
92.8 |
107.3 |
129.1 |
157.0 |
178.0 |
||
Operating Profit |
90.2 |
103.6 |
124.7 |
151.7 |
172.2 |
||
Amortisation of intangibles |
(36.0) |
(22.2) |
(27.4) |
(33.0) |
(30.0) |
||
Exceptional items |
(22.1) |
(17.9) |
(16.6) |
(7.5) |
0.0 |
||
Share based payment charge |
(2.7) |
(3.4) |
(5.7) |
(4.0) |
(4.0) |
||
JV tax, finance costs, dep'n |
0.0 |
0.1 |
(1.6) |
0.0 |
0.0 |
||
Operating Profit |
29.4 |
60.2 |
73.4 |
107.2 |
138.2 |
||
Net Interest |
(11.8) |
(14.8) |
(20.6) |
(25.0) |
(22.9) |
||
Exceptional finance items |
3.9 |
(1.4) |
(6.5) |
0.0 |
0.0 |
||
Profit Before Tax (norm) |
78.4 |
88.8 |
104.1 |
126.7 |
149.4 |
||
Profit Before Tax (FRS 3) |
21.5 |
44.0 |
47.9 |
82.2 |
115.4 |
||
Tax (reported) |
(1.5) |
(2.7) |
(7.7) |
(16.4) |
(23.1) |
||
Tax (adjustment for normalised earnings) |
|
(18.4) |
(16.8) |
(16.2) |
(12.2) |
(10.5) |
|
Profit After Tax (before non-controlling interests) (norm) |
58.5 |
69.3 |
80.2 |
98.1 |
115.8 |
||
Profit After Tax (before non-controlling interests) (FRS3) |
20.0 |
41.2 |
40.2 |
65.8 |
92.3 |
||
Non-controlling interests |
0.0 |
0.0 |
(4.2) |
(12.6) |
(14.0) |
||
Average Number of Shares, Diluted (m) |
318.7 |
332.9 |
379.1 |
427.3 |
429.4 |
||
EPS - normalised (p) |
18.4 |
20.8 |
19.4 |
20.0 |
23.7 |
||
EPS - FRS 3 (p) |
5.5 |
12.7 |
9.8 |
12.6 |
18.5 |
||
Dividend per share (p) |
1.0 |
1.1 |
1.2 |
1.3 |
1.4 |
||
Gross Margin (%) |
22.0 |
26.4 |
24.0 |
24.0 |
24.0 |
||
EBITDA Margin (%) |
11.3 |
13.7 |
16.1 |
15.7 |
16.3 |
||
Operating Margin (before GW and except) (%) |
11.0 |
13.2 |
15.5 |
15.1 |
15.7 |
||
BALANCE SHEET |
|||||||
Non-current Assets |
366.0 |
538.4 |
890.7 |
883.0 |
848.8 |
||
Intangible Assets (incl Investment in programmes) |
343.1 |
473.9 |
808.2 |
801.6 |
768.8 |
||
Tangible Assets |
5.5 |
6.1 |
60.1 |
64.8 |
70.0 |
||
Deferred tax/Investments |
17.4 |
58.4 |
22.4 |
16.6 |
10.1 |
||
Current Assets |
559.9 |
634.3 |
752.0 |
775.2 |
868.8 |
||
Stocks |
47.2 |
52.0 |
51.1 |
51.1 |
51.1 |
||
Investment in content rights |
230.1 |
221.1 |
241.3 |
272.7 |
309.0 |
||
Debtors |
243.7 |
289.9 |
351.3 |
401.4 |
458.7 |
||
Cash |
38.9 |
71.3 |
108.3 |
50.0 |
50.0 |
||
Current Liabilities |
(449.2) |
(488.3) |
(568.7) |
(565.1) |
(561.0) |
||
Creditors |
(401.1) |
(398.7) |
(470.7) |
(467.1) |
(463.0) |
||
Short term borrowings |
(48.1) |
(89.6) |
(98.0) |
(98.0) |
(98.0) |
||
Long Term Liabilities |
(168.6) |
(319.6) |
(413.6) |
(375.6) |
(356.8) |
||
Long term borrowings |
(155.9) |
(295.9) |
(309.1) |
(271.1) |
(252.3) |
||
Other long term liabilities |
(12.7) |
(23.7) |
(104.5) |
(104.5) |
(104.5) |
||
Net Assets |
308.1 |
364.8 |
660.4 |
717.6 |
799.9 |
||
CASH FLOW |
|||||||
Operating Cash Flow |
264.2 |
271.9 |
320.3 |
480.3 |
586.4 |
||
Net Interest |
(10.7) |
(13.4) |
(31.0) |
(25.0) |
(22.9) |
||
Tax |
(5.9) |
(10.8) |
(17.7) |
(20.0) |
(27.7) |
||
Capex |
(4.2) |
(4.8) |
(8.6) |
(10.0) |
(11.0) |
||
Acquisitions/disposals |
(6.1) |
(104.3) |
(226.0) |
(5.2) |
0.0 |
||
Investment in content rights and TV programmes |
(281.4) |
(280.8) |
(218.5) |
(435.0) |
(500.0) |
||
Proceeds on issue of shares |
0.0 |
0.0 |
194.6 |
0.0 |
0.0 |
||
Dividends |
0.0 |
(2.9) |
(4.0) |
(5.3) |
(6.0) |
||
Net Cash Flow |
(44.1) |
(145.1) |
9.1 |
(20.3) |
18.8 |
||
Opening IFRS debt/(cash) |
144.5 |
165.1 |
314.2 |
298.8 |
319.1 |
||
Movements in exchangeable notes |
0.0 |
0.0 |
0.0 |
0.0 |
0.0 |
||
Other including forex |
23.5 |
(4.0) |
6.3 |
0.0 |
0.0 |
||
Closing IFRS debt/(cash) |
165.1 |
314.2 |
298.8 |
319.1 |
300.3 |
||
IFRS DEBT comprises: |
|||||||
Production finance |
54.0 |
89.3 |
118.0 |
145.0 |
148.5 |
||
Net debt |
111.1 |
224.9 |
180.8 |
174.1 |
151.8 |
||
Source: eOne (historic), Edison Investment Research (forecasts)
|
|