Last close As at 05/08/2026
GBP0.94
— 0.00 (0.00%)
Market capitalisation
—
Research: Industrials
Softness in the automotive markets (see Stellantis’s recent update) is weighing on sentiment in the auto sector forecasts and has led us to trim our FY25 forecasts. Dowlais management is currently reviewing the options for its smaller Powder Metallurgy division. An exit would leave GKN Automotive dominated by the higher-quality Driveline business (60% of GKN Automotive sales) and its Chinese joint venture (JV). Assuming proceeds of c £700m (latest NAV £860m), this would leave the shares trading on a pro-forma FY25 EV/EBITDA of c 2x.
Dowlais Group |
Driveline – the strong core |
Investment update |
Automobiles and parts |
21 October 2024 |
Share price performance
Business description
Next events
Analyst
Dowlais Group is a research client of Edison Investment Research Limited |
||||||||||||||||||||||||||||||||||||||||||
Softness in the automotive markets (see Stellantis’s recent update) is weighing on sentiment in the auto sector forecasts and has led us to trim our FY25 forecasts. Dowlais management is currently reviewing the options for its smaller Powder Metallurgy division. An exit would leave GKN Automotive dominated by the higher-quality Driveline business (60% of GKN Automotive sales) and its Chinese joint venture (JV). Assuming proceeds of c £700m (latest NAV £860m), this would leave the shares trading on a pro-forma FY25 EV/EBITDA of c 2x.
Year end |
Revenue (£m) |
PBT* |
EPS* |
DPS |
P/E |
Yield |
12/22 |
5,246 |
212 |
(15.3) |
0.0 |
N/A |
N/A |
12/23 |
5,489 |
264 |
13.8 |
4.2 |
4.0 |
7.6 |
12/24e |
4,987 |
207 |
11.0 |
4.2 |
5.0 |
7.6 |
12/25e |
4,929 |
215 |
12.1 |
4.2 |
4.6 |
7.6 |
Note: *PBT and EPS are normalised, excluding amortisation of acquired intangibles, exceptional items and share-based payments.
GKN Automotive Driveline: A high-quality business
Driveline (60% of GKN Automotive revenues) exhibits many characteristics of a high-quality business. It has high market share (estimated at over 40% of the outsourced market), a strong technology position (more than 1,800 patents), a broad customer base (serving over 90% of OEMs) and a global geographical footprint. In addition, the business is powertrain agnostic as the industry transitions to electric vehicles (EVs). The Chinese JV (13% of sales) has similarly positive characteristics.
Margin potential
Management is targeting operating margins of 10%+ for the Automotive business. We forecast a 6.4% margin in FY24. We see three key elements to margin expansion: the current restructuring programme £100m/2.5%; recovery of the automotive market – we assume 5% upside (halfway back to peak levels) with a 30% drop through £52m/1.3%; and turnaround of the eDrive Systems (either through restructuring or cost base leverage through growth) providing £30m/0.8%.
Forecast changes
We have adjusted our FY25 forecasts for reduced auto production expectations (2% growth to flat) and recent strengthening of sterling. FY24 is unchanged, FY25 PBT reduces from £247m to £215m (-12.9%) and EPS from 13.4p to 12.1p (-9.8%).
Valuation: Deep discount on all metrics
On lower forecasts our peer-derived valuation comes to 83p a share from 102p or 121p (from 136p) using a higher-margin peer group more in line with management’s strategy. Our discounted cash flow (DCF) valuation comes to 109p. We also note the valuation potential post any disposal of Powder Metallurgy. Assuming net cash receipt of £700m from Powder Met (current NAV: £860m), the shares would trade on a pro-forma FY25 EV/EBITDA of 1.9x.
Overview
The current strategic review of the Powder Metallurgy business is inevitably seen as the short-term potential catalyst for the shares. In the H124 results, the NAV for Powder Metallurgy stood at £860m (assets: £1,251m, liabilities: £391m), which translates to an EBIT multiple of 9.0x and an EBITDA multiple of 5.9x based on the FY23 results. Clearly the outcome of this review process is uppermost in investor thinking. However, the key driver for the group is the Automotive division (also known as GKN Automotive), which accounted for 81% of underlying sales and 76% of underlying profit in FY23. In this note we review GKN Automotive, in particular the two key issues that we believe will drive the valuation of the shares:
■
Quality of the business: the underlying dynamics, market position and strength of the business through its Driveline business (60% of GKN Automotive sales), supported by the long-term performance growing ahead of the auto markets over the last two decades.
■
Margin potential: management’s stated target margin is 10%+ (pre central costs) for the business. We see three key elements to achieving this – two within management’s control (restructuring and eDrive systems profit improvement) and one from recovery of the external market.
The appendix gives a full description of the Automotive business’s activity profile.
Quality of the GKN Automotive
Market-leading position of Driveline
Driveline, consisting of sideshafts, constant velocity joints (CVJs) and propshafts, is the key business within GKN Automotive, accounting for 60% of sales. The other 40% consists of the China JV (with a similar product portfolio), All Wheel Drive and eDrive activities. GKN Driveline is the clear market leader in sideshafts and CVJs, responsible for transmitting power from the engine to the wheels for light vehicles. It claims relationships with more than 90% of the world’s OEMs and over 40% share of the driveline wallet from its top 10 customers. Dowlais Group’s management estimates that it is at least twice the size of the next largest player. We also note that previous GKN management (before acquisition by Melrose) claimed a c 50% share of the outsourced market (c 10% being insourced by the OEMs), suggesting more than a 40% market share. Given the international nature of the automotive sector, along with OEM preference for dual supply, we see such dominant market positions as limiting the potential for market share gains. These dominant market positions are not the norm in the auto world; other such notable companies include Autoliv (55% market share in safety systems), TI Fluid Systems (35% market share in brake and fuel lines) and Garrett Motion (30% market share in turbos). Dowlais also claims the market-leading position in propeller shafts (propshafts).
|
Exhibit 1: Key product market shares |
|
|
Source: Dowlais Group |
GKN Automotive’s key competitors are shown in Exhibit 2. An automotive drivetrain system distributes power from the engine to the wheels and consists of a range of components including transmission, driveshaft, differentials and axles along with the associated control systems. CVJs and propshafts account for a relatively small element of the system, hence it is not possible to directly compare revenues in the table, although it is worth noting that all peers are part of large, diverse automotive groups.
Exhibit 2: Key competitors
Company |
Division |
Division sales (FY23) |
Division as % of group |
Dowlais |
Automotive |
£5.0bn |
80% |
American Axle |
Driveline |
$4.2bn |
69% |
BorgWarner |
Driveline & battery systems |
$4.3bn |
38% |
Dana |
Light vehicles |
$4.0bn |
38% |
Hyundai WIA |
Automotive one of four divisions |
Group: $6.5bn |
N/A |
Linamar |
Mobility |
$7.1bn |
76% |
Magna |
Power & Vision |
$14.3bn |
33% |
Nexteer |
Driveline systems |
$800m |
20% |
NTN |
CVJ/axle |
$3.4bn |
58% |
Schaeffler |
Automotive Technologies |
€7.0bn |
43% |
Valeo |
Powertrain Systems |
€5.6bn |
28% |
Vitesco |
Powertrain Solutions |
€6.1bn |
66% |
Source: Company accounts
Strong technology position
The first CVJ for a commercial front-wheel drive vehicle was designed by Birfield (now owned by GKN Automotive) in the 1950s for the Austin Mini. GKN Automotive has retained this first-mover advantage through continued investment in technology protected by an extensive portfolio of more than 1,800 patents either active or pending. This technology is supported by research and development (R&D) at 3.1% of sales, in line with automotive peers, albeit behind those with exposure to the electronics and higher-technology elements of the automotive sector. It is worth noting that, given GKN Automotive’s market share, its R&D in absolute terms is probably on a par with all the other outsourced driveline competitors combined.
Exhibit 3: R&D to sales
Dowlais |
3.1% |
American Axle |
2.6% |
BorgWarner |
5.1% |
Dana |
2.2% |
Magna |
2.8% |
Nexteer |
3.6% |
NTN |
2.2% |
Schaeffler |
4.7% |
Valeo |
9.3% |
Vitesco |
5.9% |
Average |
3.6% |
Source: Company accounts
Global business
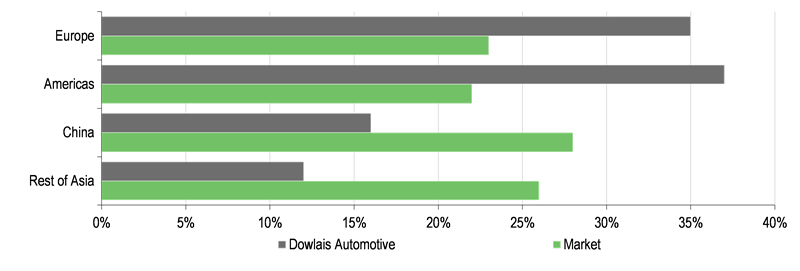
GKN Automotive is truly global, with a broad geographical exposure reflecting its diverse customer base. There is a bias towards the Western markets, see Exhibit 4, as Chinese exposure is affected by the joint venture (JV) structure and the rest of Asia by the keiretsu/chaebol business structures seen in Japan and South Korea, respectively, which promote local companies with financial ties to an OEM. The Chinese JV, now in its 36th year, is a clear strength, serving both Western and local OEMs in what has become the largest automotive market in the world.
|
Exhibit 4: Automotive geographic sales against the market |
|
|
Source: Dowlais Group |
Diverse customer base
Automotive suppliers often have a customer bias, reflecting their initial development as a subsidiary within an OEM or similar close ties. GKN Automotive has a broad spread with the top five customers accounting for c 55% of revenues (note the Chinese JV has similar diversity).
|
Exhibit 5: GKN Automotive customer profile |
Exhibit 6: Peer customer profile |
||||||||||||||||||||||||
|
|
||||||||||||||||||||||||
|
Source: Dowlais Group |
Source: Company accounts |
|
Exhibit 5: GKN Automotive customer profile |
||||||||||||||||||||||||
|
||||||||||||||||||||||||
|
Source: Dowlais Group |
||||||||||||||||||||||||
|
Exhibit 6: Peer customer profile |
||||||||||||||||||||||||
|
||||||||||||||||||||||||
|
Source: Company accounts |
Powertrain agnostic
Management expects the business to be powertrain agnostic, with inevitable gains and losses as highlighted in Exhibit 7.
|
Exhibit 7: Automotive EV impact by product group |
|
|
Source: Dowlais Group capital markets presentation 2023 |
Electric motors are significantly smaller and cheaper than internal combustion engines (ICEs). Hence the powertrain architecture for four-wheel drive vehicles is moving from a single front-mounted power unit connected to a rear-drive axle via a propshaft to two electric motors, positioned front and rear. This is clearly negative for propshafts. However, this new architecture will see sideshafts replace rigid axles and is likely to see an increase in the number of four-wheel drive vehicles given the superior performance. Management’s view therefore is that the penetration of sideshafts will increase from 2.1 per vehicle to 2.4. All-wheel drive (AWD) will also decline, at least in complexity, as drive systems become more electronically controlled, while the eDrive components and systems will naturally increase as the market migrates.
While it is difficult to assess the overall impact, it is worth noting the revenue progress in China, the most advanced market in terms of EV penetration. Exhibit 8 highlights sales in local currency and EV penetration. Note that 2024e uses annualised H124 performance. In H124 the China JV reported underlying growth of 6.6%, ahead of the market at c 5%, despite the continued shift to EVs (23% to 26% of production). Given that the China JV is more orientated towards sideshafts and propshafts, this provides evidence of the agnostic nature of the business.
|
Exhibit 8: China JV performance |
|
|
Source: Dowlais Group, Edison Investment Research |
Finally, it is worth noting that the group has been winning significant EV business. 2023 total order intake was more than £6bn, with 74% for EVs. This compares favourably with peers, as highlighted in Exhibit 9.
Exhibit 9: Order intake
EV proportion of order intake |
Book-to-bill (x) |
|
Dowlais |
74% |
1.4 |
American Axle |
50% |
N/A |
Dana |
74% |
N/A |
Linamar |
68% |
N/A |
Magna |
N/A |
1.15 |
Valeo |
18% |
1.9 |
Vitesco |
68% |
1.3 |
Source: Company accounts
Stable financial performance
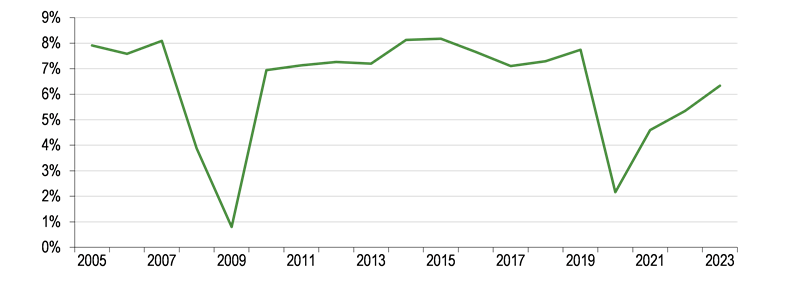
Operating margins within the Automotive division have been resilient at c 8%, with the inevitable exception through the financial crisis and COVID-19 when automotive volumes experienced significant declines. Such turbulence is inevitably exacerbated down the component supply chain through the destocking and restocking cycles.
|
Exhibit 10: Operating margins – GKN Automotive Driveline |
|
|
Source: Dowlais Group, Edison Investment Research |
Historical growth ahead of the market
The strong market position limits the ability to grow, as OEMs prefer dual or multiple suppliers to limit risk and ensure competition. Combining this with the automotive market requirements for annual price reductions provides clear challenges to growth. The strong presence in China has been a clear positive, albeit the 50/50 JV has limited the benefit to GKN Automotive over the period of strong Chinese automotive growth. Overall, we estimate that GKN Automotive’s organic sales growth has outperformed the global light vehicle market by an average 0.5% over the last 20 years.
|
Exhibit 11: GKN Automotive’s growth relative to the light vehicle market |
|
|
Source: GKN, Melrose Industries, Dowlais Group, Statista |
Summary
Exhibit 12 highlights the key reasons for our view of the quality of the business. This is further evidenced by the long-term market outperformance and stable margin performance, with the exception of the market dislocation during the financial crisis and COVID-19.
Exhibit 12: GKN Automotive’s key strengths
High market share |
✓ |
Strong technology position |
✓ |
Broad customer base |
✓ |
Global geographical presence |
✓ |
Powertrain agnostic |
✓ |
Source: Edison Investment Research
Margin potential
Dowlais Group’s management is targeting operating margin of 10%+. This is at the divisional level (ie pre-central costs), which, on a pro rata basis for the group, has a c 50bp impact. As Exhibit 10 shows, operating margins fluctuated between 7% and 8% in 2010–19 (after central overheads), suggesting that management is looking to improve underlying returns by 200–300bp.
These improvements are expected to come from three main avenues: the restructuring programme, the resolution of Driveline issues and recovery in the end market.
Restructuring benefits
The business was restructured under Melrose as part of its normal ‘improvement’ strategy and actions have continued under Dowlais as an independent company. Much of the focus has been on the manufacturing footprint, reducing the number of plants and shifting the balance to ‘best cost’ locations within the requirement for customer proximity. The number of plants has been reduced from 85 to 74 (Exhibit 13) with the balance to ‘best cost’ increased from 37% to 45%. Alongside this there has been a c 15% reduction in headcount, as highlighted in Exhibit 14. The weaker automotive market has inevitably affected the sales metric in both charts. Nevertheless, sales per plant have improved by c 6% and sales per employee by c 10%.
|
Exhibit 13: Manufacturing footprint |
Exhibit 14: Employees |
|
|
|
Source: Dowlais Group |
Source: Melrose Industries, Dowlais Group |
|
Exhibit 13: Manufacturing footprint |
|
|
Source: Dowlais Group |
|
Exhibit 14: Employees |
|
|
Source: Melrose Industries, Dowlais Group |
Published accounts provide limited detail on operating costs, particularly at divisional level. The best external analysis therefore comes from headcount savings. As shown in Exhibit 15, GKN Automotive’s headcount has reduced by c 3,300 since 2019, with an average cost per employee of £50k in 2023 suggesting a saving of £168m. However, the softness of the automotive market inevitably reduces the net benefits to the group, that is 10% of the 15% headcount reduction offset by the softer end market, hence we estimate net savings of c £60m before any benefit of moving to ‘best cost’. While this does not capture all the restructuring benefits, it provides an example of the impact and the potential additional upside when the markets recover.
Exhibit 15: Headcount savings
Restructuring |
Market downturn |
Net savings |
|
Headcount reduction |
3,334 |
2,160 |
1,174 |
Average cost per employee (2023, £000s) |
50.4 |
50.4 |
50.4 |
Savings (£m) |
168 |
109 |
59 |
Source: Edison Investment Research
An alternative approach is to look at the restructuring spend over recent years and assess the expected benefits. Exhibit 16 highlights the restructuring charges since 2019 and our expectation going forward. Management has indicated that the current programme will be completed by 2025 when restructuring charges will return to the normal ongoing rate of c £25m. Looking purely at 2023–25 suggests a cumulative spend of c £300m. Restructuring paybacks are normally short relative to other types of investment. For example, BorgWarner recently announced the restructuring of its ePropulsion business, with costs of $75m generating annual savings of $100m (payback less than one year). Valeo announced a €300m programme expected to generate savings of over €200m (payback 1.5 years). Assuming a conservative three-year payback would suggest savings of £100m, equivalent to a 2.5% improvement on the operating margin.
Exhibit 16: Restructuring spend in GKN Automotive (£m)
2019 |
83 |
2020 |
60 |
2021 |
147 |
2022 |
37 |
2023 |
146 |
2024e |
100 (46 in H1) |
2025e |
50 |
2026e |
25 |
Source: Melrose Industries, Dowlais Group, Edison Investment Research
eDrive Systems issues
The ePowertrain subdivision covers three activities: All-Wheel Drive, ePowertrain Components and eDrive Systems. eDrive Systems provides a complete package for converting the electrical output of the battery to the mechanical drive motion. This requires inverters to condition the electrical energy, motors to convert into mechanical power and transmissions/actuators (replacing gearboxes) to control and distribute the rotating power to the sideshafts and on to the wheels. This is all wrapped up in a software control system.
Initially, the shift towards EVs was niche, with high engineering costs and low volumes leading to specialists such as GKN Automotive building a strong presence, as seen with the BMW i6. However, these systems replace the engine and transmission (gearbox) in a traditional ICE vehicle. Incumbents in these areas, often the OEMs, have come to understand the threat to their business, including the potential of ‘stranded’ factories and the impact on employees. Hence, they have looked to build capabilities in this area, leading, among other things, to insourcing by the OEMs (recently estimated by Valeo at 60% of the ePowertrain market), reducing the outsourced market and increasing pricing pressure. Hence, while the market has been growing strongly, it has also become more competitive.
In the recent interim results, GKN Automotive’s ePowertrain sales fell by £176m or c 25%. Management commented that this was ‘driven by double-digit decline in AWD systems largely due to delays in a platform launch in Americas, moderate decline in ePowertrain components, driven by softening in Asia, and significant revenue decline in eDrive Systems due to volatility in BEV production volumes’. The Systems business was particularly affected by three contracts that saw significant volume declines leading to the business falling from 17% of ePowertrain to 8%, c £120m to c £45m in H1.
The eDrive Systems business has a limited number of customers (around 10) but the value per vehicle is high. Management does not provide details of individual contracts. However, GKN Automotive supplies a two-in-one integrated eDrive unit for the electric Fiat 500 (the e500). This model had been selling c 80,000 units a year but has been affected by the slowdown in EV sales, indeed Stellantis recently announced a temporary shutdown of production. Assuming £1,000 per vehicle, a reduction of 50,000 units would reduce revenue by £50m. Clearly, such reduced activity is likely to have a significant impact on overall financial performance. The eDrive Systems business also carries significant engineering costs of more than £35m per year.
Dowlais does not disclose profitability at this level, but the challenge can be seen in Vitesco’s results (Exhibit 17). Despite being around twice the scale of GKN Automotive’s ePowertrain business, Vitesco’s Electrical Solutions business is still loss making. Note that, like GKN Automotive, its traditional Powertrain Solutions business is healthily profitable.
Exhibit 17: Vitesco divisional results 2023
Powertrain Solutions division |
Electrification Solutions division |
|
Sales (€m) |
6,119 |
3,162 |
EBIT (€m) |
465 |
-98 |
Operating margin |
7.6% |
-3.1% |
Source: Vitesco
Magna provides another example. Despite a far broader portfolio in the EV space, its inflexion point to profitability is not expected until 2026 and this was before the recent EV slowdown. The company also highlights engineering costs as a percentage of sales, a further volume leverage on the business. Dowlais does not provide profitability at this level but we would expect it to be loss-making, requiring either significant volume growth to generate operational gearing benefits and/or restructuring.
|
Exhibit 18: Magna’s EV profit inflection point |
|
|
Source: Magna |
Market recovery
The automotive markets recovered well post the COVID downturn, despite supply issues in areas such as computer chips. However, further weakness is now expected in the current year, with 2024 global automotive production excluding China likely to be c 10% below the pre-COVID peak level.
|
Exhibit 19: Auto light vehicle production ex China (indexed to 2017) |
|
|
Source: Statista, Edison Investment Research |
Recovery in the end markets clearly provides positive operational gearing. Management guidance is for 30% drop through from revenues. Exhibit 20 highlights the potential benefits to profitability from a 5% recovery in the market (ie halfway to the 2017 peak), which we see as realistic in the 2026 timeframe. Note this excludes the Chinese JV.
Exhibit 20: GKN Automotive excluding China JV (€m)
2024 sales forecast |
3,434 |
Market recovery sales @ 5% |
172 |
Profit impact from 30% drop through |
52 |
Source: Edison Investment Research
Summary: Target margins achievable
Exhibit 21 brings together our estimates of the potential impact from these three key profit improvement elements. Perhaps the most difficult decision will be on the future of the eDrive Systems business, growth or restructuring, particularly within the management’s longer-term EV strategy.
Exhibit 21: GKN Automotive recovery potential
Sales (€m) |
Operating profit (€m) |
Operating margin |
|
Edison FY24 forecast |
3,977 |
255 |
6.4% |
Turnaround of eDrive Systems |
30 |
0.8% |
|
Automotive market recovery |
172 |
52 |
1.3% |
Restructuring |
100 |
2.5% |
|
Medium-term potential |
4,149 |
437 |
10.5% |
Source: Edison Investment Research
We also note the Chinese JV’s consistent double-digit returns, which support management’s target.
|
Exhibit 22: China JV operating margin |
|
|
Source: Dowlais Group. Note: 2020 and 2021 include the small JVs within the Powder Metallurgy division. |
Finally, to put GKN Automotive’s margins into context, it is worth looking at the peer group. Exhibit 23 suggests that its peers’ returns are also under pressure, with an average return of 9.5% in 2017 falling to 4.3% in 2023. We also note the relative improvement at GKN Automotive from second bottom in 2017 to third from top in 2023, behind only BorgWarner and TI Fluid Systems (a non-powertrain business).
Exhibit 23: Peer operating margins (%)
FY17 |
FY23 |
|
Dowlais (Automotive/Driveline division) |
7.1 |
6.3 |
American Axle |
11.5 |
2.8 |
BorgWarner |
12.5 |
9.0 |
Dana |
7.9 |
3.7 |
Linamar |
10.0 |
4.4 |
Magna |
7.8 |
5.7 |
Nexteer |
11.5 |
1.6 |
NTN (Automotive division) |
4.3 |
0.6 |
Schaeffler |
11.3 |
3.1 |
TI Fluid Systems |
11.0 |
7.3 |
Valeo (Powertrain systems) |
7.4* |
5.0 |
Peer group average |
9.5 |
4.3 |
Source: LSEG Data & Analytics, Edison Investment Research. Note: *Estimated.
Forecasts
We have updated our forecasts to reflect key changes to our assumptions since the interim results were announced. While there is some risk to FY24, the primary changes to our assumptions affect FY25. The key changes are:
■
Reduced auto production. We are reducing our auto production growth expectations (excluding China) for FY25 from +2% to flat. This suggests a c £900m revenue reduction. Assuming 20% drop through (general management guidance 30% – H124 14% post management actions) affects profit by £20m.
■
Further currency headwinds. Further strengthening of sterling against key currencies (the dollar, euro, renminbi) have an impact of c £10m.
Exhibit 24: Forecast changes
(£m) |
2024e |
2025e |
||||
Old |
New |
Change |
Old |
New |
Change |
|
Revenues |
4,987 |
4,987 |
0.0% |
5,107 |
4,929 |
(3.5%) |
Adjusted operating profit |
314 |
314 |
(0.0%) |
360 |
330 |
(8.5%) |
Targeted operating profit margin (ex central costs) |
7.1% |
7.1% |
(0.0%) |
7.8% |
7.5% |
(0.3%) |
Adjusted operating profit margin |
6.3% |
6.3% |
(0.0%) |
7.1% |
6.7% |
(0.4%) |
Adjusted PBT |
207 |
207 |
0.0% |
247 |
216 |
(12.6%) |
Basic EPS (p) |
11.0 |
11.0 |
0.0% |
13.4 |
12.1 |
(9.5%) |
Dividend per share (p) |
4.2 |
4.2 |
0.0% |
4.2 |
4.2 |
0.0% |
Net cash/(debt) |
(907) |
(916) |
1.0% |
(899) |
(921) |
2.4% |
Source: Edison Investment Research
Detailed P&L and cash flow forecasts
Exhibit 25: P&L
Year to December (£m) |
2023 |
2024e |
2025e |
2026e |
Organic growth |
|
|
|
|
Automotive |
7.0% |
-8.0% |
0.0% |
2.5% |
Powder Metallurgy |
3.5% |
-1.0% |
0.0% |
0.0% |
Group organic growth |
6.3% |
-6.7% |
0.0% |
2.0% |
Automotive |
4,437 |
3,977 |
3,931 |
4,029 |
Powder Metallurgy |
1,047 |
1,010 |
998 |
998 |
Hydrogen |
5 |
|||
Revenue |
5,489 |
4,987 |
4,929 |
5,027 |
Operating margin |
||||
Automotive |
6.9% |
6.5% |
7.0% |
7.5% |
Powder Metallurgy |
9.2% |
9.5% |
9.5% |
9.5% |
Group operating margin (ex central costs) |
7.3% |
7.1% |
7.5% |
7.9% |
Automotive |
306.0 |
259.5 |
275.1 |
302.2 |
Powder Metallurgy |
96.0 |
95.9 |
94.8 |
94.8 |
Hydrogen |
(15.0) |
(7.0) |
0.0 |
0.0 |
Central costs |
(32.0) |
(35.0) |
(40.0) |
(41.0) |
Group underlying operating profit |
355.0 |
313.5 |
330.0 |
356.0 |
Associates (PAT) adjustment |
(30.0) |
(26.1) |
(26.1) |
(26.7) |
Intangible amortisation |
(197.0) |
(197.0) |
(197.0) |
(197.0) |
Reorganisation costs |
(120.0) |
(110.0) |
(70.0) |
(35.0) |
Write downs |
(449.0) |
(59.0) |
||
Other |
(9.0) |
|||
EBIT (reported) |
(450.0) |
(78.5) |
36.9 |
97.3 |
Financing charges |
(91.0) |
(106.6) |
(113.7) |
(114.1) |
Exceptional financing charges |
19.0 |
|||
PBT reported |
(522.0) |
(185.1) |
(76.8) |
(16.8) |
PBT before exceptionals |
264.0 |
206.9 |
216.2 |
241.9 |
Tax rate underlying |
20% |
25% |
25% |
25% |
Adjusted profit after tax |
198.3 |
155.2 |
168.7 |
188.1 |
Minority interest |
(6.0) |
(6.0) |
(7.0) |
(8.0) |
EPS Adjusted (p) |
13.8 |
11.0 |
12.1 |
13.5 |
Average shares |
1393 |
1353 |
1333 |
1333 |
Source: Edison Investment Research
Exhibit 26: Cash flow
Year to December (£m) |
2023 |
2024e |
2025e |
2026e |
Operating profit (pre exc & g/w) |
355 |
313.5 |
330.0 |
356.0 |
Amortisation inc development costs/IT |
10 |
10.0 |
10.0 |
10.0 |
Depreciation |
253 |
260.0 |
255.0 |
250.0 |
Underlying EBITDA |
618 |
583.5 |
595.0 |
616.0 |
Equity accounted investments |
(81) |
(70.4) |
(70.4) |
(72.1) |
Net change in WC |
18 |
10.0 |
0.0 |
(4.4) |
Restructuring |
(70) |
(105.0) |
(75.0) |
(30.0) |
Pension etc |
(30) |
(45.0) |
(45.0) |
(45.0) |
Demerger |
(48) |
|||
Other |
(23) |
(10.0) |
(10.0) |
(10.0) |
Operating cash flow |
384 |
363.1 |
394.6 |
454.5 |
Net interest |
(63) |
(93.6) |
(98.7) |
(99.1) |
Dividends received (Ass & JV's) |
63 |
70.0 |
72.0 |
74.0 |
Total tax paid |
(61) |
(51.7) |
(47.5) |
(53.8) |
Net CAPEX |
(279) |
(260.0) |
(250.0) |
(250.0) |
Free cash flow |
44 |
27.8 |
70.3 |
125.6 |
Equity dividends paid |
(26.0) |
(60.9) |
(60.0) |
(60.0) |
Shares issued / (repurchased) |
(7.0) |
(35.0) |
(15.0) |
|
Net cash flow |
11.0 |
(68.1) |
(4.7) |
65.6 |
Exchange rate differences |
24.0 |
|||
Other non-cash/refinancing |
(3.0) |
|||
Net cash/(debt) b/fwd |
(880.0) |
(848.0) |
(916.1) |
(920.9) |
Movement in net debt |
32.0 |
(68.1) |
(4.7) |
65.6 |
Net cash / (debt) |
(848.0) |
(916.1) |
(920.9) |
(855.2) |
Source: Edison Investment Research
Valuation
Peer group valuation
Exhibit 27 provides a valuation using a peer group comprising drivetrain/powertrain competitors, along with other, predominantly automotive, activities, and are either listed in Europe or the US. We have included TI Fluid Systems as the only other similar-sized, UK-listed auto components supplier. Note that we have also taken Dowlais Group’s pension deficit into account by reducing EBIT and EBITDA by the anticipated ongoing cash cost of £40m. This provides an average valuation of 83p per share.
Exhibit 27: Direct peer group valuation
EV/EBIT (x) |
EV/EBITDA (x) |
P/E (x) |
|||||||
2024e |
2025e |
2026e |
2024e |
2025e |
2026e |
2024e |
2025e |
2026e |
|
Peer group 1 |
|||||||||
American Axle |
13.3 |
12.9 |
11.8 |
4.4 |
4.4 |
4.4 |
20.8 |
11.4 |
7.9 |
Dana |
8.2 |
7.2 |
6.8 |
4.0 |
3.8 |
3.7 |
11.9 |
7.8 |
7.3 |
Linamar |
4.4 |
4.3 |
3.9 |
2.8 |
2.8 |
2.5 |
6.3 |
6.0 |
5.1 |
Magna |
8.2 |
7.4 |
6.9 |
4.8 |
4.5 |
4.1 |
10.5 |
9.0 |
8.6 |
TI Fluid Systems |
7.5 |
6.4 |
5.5 |
4.2 |
3.8 |
3.5 |
6.8 |
5.7 |
4.8 |
Valeo |
7.5 |
5.7 |
4.5 |
2.3 |
2.1 |
1.9 |
8.0 |
4.9 |
3.4 |
Vitesco |
6.3 |
4.9 |
2.6 |
2.2 |
2.0 |
1.4 |
12.6 |
9.4 |
8.0 |
Median |
7.9 |
6.5 |
5.8 |
3.3 |
3.1 |
2.9 |
10.8 |
7.2 |
6.1 |
Dowlais financials (EBIT £m, EBITDA £m, EPS p) |
314 |
330 |
356 |
589 |
610 |
636 |
11.0 |
12.1 |
13.3 |
Annual pension cash contribution (£m) |
(40) |
(40) |
(40) |
(40) |
(40) |
(40) |
|||
Dowlais underlying pension adjusted (£m) |
274 |
290 |
316 |
549 |
570 |
596 |
11.0 |
12.1 |
13.3 |
Enterprise valuation (£m) |
2165 |
2021 |
1896 |
1935 |
1905 |
1831 |
|||
Equity valuation (£m) |
1238 |
1055 |
950 |
1008 |
938 |
885 |
|||
Dowlais valuation (p/share) |
91 |
77 |
70 |
74 |
69 |
65 |
121 |
94 |
86 |
Source: LSEG Data & Analytics, Edison Investment Research. Note: Prices as at 17 October 2024.
Dowlais’s market-leading position suggests a higher quality of earnings than general auto peers. Exhibit 28 shows a valuation using automotive stocks generating consistent double-digit operating margins (ie similar to Dowlais management targets). This suggests a price of 121p per share.
Exhibit 28: Higher-margin peer group valuation
EV/EBIT (x) |
EV/EBITDA (x) |
P/E (x) |
|||||||
2024e |
2025e |
2026e |
2024e |
2025e |
2026e |
2024e |
2025e |
2026e |
|
Autoliv |
8.4 |
6.9 |
6.2 |
6.1 |
5.2 |
4.8 |
11.0 |
8.7 |
7.5 |
Borg Warner |
8.5 |
7.8 |
7.3 |
5.9 |
5.5 |
5.2 |
8.9 |
7.9 |
7.0 |
Brembo |
8.9 |
8.0 |
7.2 |
5.5 |
5.1 |
4.6 |
10.8 |
9.5 |
8.6 |
Median |
8.6 |
7.6 |
6.9 |
5.8 |
5.3 |
4.9 |
10.2 |
8.7 |
7.7 |
Dowlais valuation |
108 |
94 |
94 |
169 |
151 |
145 |
113 |
108 |
108 |
Source: LSEG Data & Analytics, Edison Investment Research. Note: Prices as at 17 October 2024.
Discounted cash flow model
Our DCF valuation is based on a 10-year cash flow and subsequent terminal valuation. To reflect the cyclicality of the automotive sector, we have included a downturn in 2029/30 with Dowlais sales declining by 10% and margins falling by 50%. Note that this is based on the current structure of the group (ie including Powder Metallurgy). We calculate the current WACC to be 9.0%. Then assuming 1% terminal growth (ie a conservative approach assuming that the auto market peaks, becoming a purely replacement market), our valuation comes to 109p per share.
Exhibit 29 DCF valuation per share (p)
Terminal growth rate |
|||||
0.0% |
1.0% |
2.0% |
3.0% |
||
WACC |
12.0% |
49 |
54 |
61 |
69 |
11.0% |
61 |
68 |
77 |
88 |
|
10.0% |
77 |
86 |
98 |
113 |
|
9.0% |
96 |
109 |
125 |
148 |
|
8.0% |
120 |
138 |
163 |
196 |
|
Source: Edison Investment Research
Valuation excluding Powder Metallurgy
The outcome of the strategic review has yet to be announced. Nevertheless, the following provides an estimation of the valuation of the group relative to an assumed disposal price of the Powder Metallurgy business. Note that we have taken full account of the pension deficit (cash cost within EBIT/EBITDA and IAS 19 in the EPS).
Exhibit 30: Pro forma valuation
EV/EBIT (x) |
EV/EBITDA (x) |
||||
2025e |
2026e |
2025e |
2026e |
||
Proceeds from disposal |
500 |
4.2 |
3.8 |
2.3 |
2.2 |
600 |
3.8 |
3.4 |
2.1 |
2.0 |
|
700 |
3.4 |
3.1 |
1.9 |
1.8 |
|
800 |
3.0 |
2.7 |
1.7 |
1.6 |
|
900 |
2.7 |
2.4 |
1.5 |
1.4 |
|
Source: Edison Investment Research
Exhibit 31: Financial summary
£m |
2022 |
2023 |
2024e |
2025e |
2026e |
||
Year to 31 December |
IFRS |
IFRS |
IFRS |
IFRS |
IFRS |
||
INCOME STATEMENT |
|||||||
Revenue |
5,246 |
5,489 |
4,987 |
4,929 |
5,027 |
||
Cost of Sales |
(3,937) |
(4,611) |
(4,139) |
(4,041) |
(4,072) |
||
Gross Profit |
1,309 |
878 |
848 |
887 |
955 |
||
EBITDA |
594 |
618 |
584 |
595 |
616 |
||
Operating profit (before amort. and excepts.) |
333 |
355 |
314 |
330 |
356 |
||
Amortisation of acquired intangibles |
(198) |
(197) |
(197) |
(197) |
(197) |
||
Exceptionals |
(48) |
(578) |
(169) |
(70) |
(35) |
||
Associate adjustment |
(29) |
(30) |
(26) |
(26) |
(27) |
||
Reported operating profit |
58 |
(450) |
(79) |
37 |
97 |
||
Net Interest |
(121) |
(100) |
(107) |
(114) |
(114) |
||
Profit Before Tax (norm) |
212 |
264 |
207 |
216 |
242 |
||
Profit Before Tax (reported) |
(63) |
(522) |
(185) |
(77) |
(17) |
||
Reported tax |
(14) |
27 |
40 |
13 |
(2) |
||
Profit After Tax (norm) |
152 |
198 |
155 |
169 |
188 |
||
Profit After Tax (reported) |
(77) |
(495) |
(145) |
(64) |
(19) |
||
Minority interests |
(5) |
(6) |
(6) |
(7) |
(8) |
||
Net income (normalised) |
147 |
192 |
149 |
162 |
180 |
||
Net income (reported) |
(82) |
(501) |
(151) |
(71) |
(27) |
||
Average Number of Shares Outstanding (m) |
0 |
1,393 |
1,353 |
1,333 |
1,333 |
||
EPS - normalised (p) |
(15.3) |
13.8 |
11.0 |
12.1 |
13.5 |
||
EPS - normalised fully diluted (p) |
(15.3) |
13.8 |
11.0 |
12.1 |
13.5 |
||
EPS - basic reported (p) |
N/A |
(36.0) |
(11.2) |
(5.3) |
(2.0) |
||
Dividend (p) |
0.0 |
4.2 |
4.2 |
4.2 |
4.2 |
||
Revenue growth (%) |
0.0 |
6.3 |
(6.7) |
0.0 |
2.0 |
||
Gross Margin (%) |
25.0 |
16.0 |
17.0 |
18.0 |
19.0 |
||
EBITDA Margin (%) |
11.3 |
11.3 |
11.7 |
12.1 |
12.3 |
||
Normalised Operating Margin |
6.3 |
6.5 |
6.3 |
6.7 |
7.1 |
||
BALANCE SHEET |
|||||||
Fixed Assets |
5,483 |
4,717 |
4,577 |
4,462 |
4,362 |
||
Intangible Assets |
3,075 |
2,365 |
2,255 |
2,145 |
2,035 |
||
Tangible Assets |
1,813 |
1,751 |
1,721 |
1,716 |
1,726 |
||
Investments & other |
595 |
601 |
601 |
601 |
601 |
||
Current Assets |
1,450 |
1,517 |
1,441 |
1,441 |
1,462 |
||
Stocks |
498 |
510 |
476 |
476 |
486 |
||
Debtors |
638 |
628 |
586 |
586 |
598 |
||
Cash & cash equivalents |
270 |
313 |
313 |
313 |
313 |
||
Other |
44 |
66 |
66 |
66 |
66 |
||
Current Liabilities |
(1,472) |
(1,446) |
(1,490) |
(1,490) |
(1,514) |
||
Creditors |
(1,188) |
(1,179) |
(1,101) |
(1,101) |
(1,122) |
||
Tax and social security |
(109) |
(100) |
(100) |
(100) |
(100) |
||
Short term borrowings |
0 |
(2) |
(100) |
(100) |
(100) |
||
Other |
(175) |
(165) |
(190) |
(189) |
(192) |
||
Long Term Liabilities |
(2,250) |
(2,222) |
(2,049) |
(1,950) |
(1,816) |
||
Long term borrowings |
(1,104) |
(1,158) |
(1,129) |
(1,134) |
(1,068) |
||
Other long term liabilities |
(1,146) |
(1,064) |
(920) |
(817) |
(748) |
||
Net Assets |
3,211 |
2,566 |
2,479 |
2,463 |
2,494 |
||
Minority interests |
39 |
36 |
34 |
33 |
34 |
||
Shareholders' equity |
3,172 |
2,530 |
2,445 |
2,430 |
2,460 |
||
CASH FLOW |
|||||||
Operating Cash Flow |
516 |
537 |
513 |
525 |
544 |
||
Working capital |
(32) |
18 |
10 |
0 |
(4) |
||
Exceptional, pension & other |
(187) |
(171) |
(160) |
(130) |
(85) |
||
Tax |
(72) |
(61) |
(52) |
(48) |
(54) |
||
Net operating cash flow |
225 |
323 |
311 |
347 |
401 |
||
Capex |
(219) |
(279) |
(260) |
(250) |
(250) |
||
Acquisitions/disposals |
(3) |
0 |
0 |
0 |
0 |
||
Dividends received from JV |
59 |
63 |
70 |
72 |
74 |
||
Net interest |
(9) |
(63) |
(94) |
(99) |
(99) |
||
Free cash flow |
53 |
44 |
28 |
70 |
126 |
||
Equity financing/buy-back |
0 |
(7) |
(35) |
(15) |
0 |
||
Dividends paid |
0 |
(26) |
(61) |
(60) |
(60) |
||
Other |
(1,971) |
21 |
0 |
0 |
0 |
||
Net Cash Flow |
1,038 |
32 |
(68) |
(5) |
66 |
||
Opening net debt/(cash) |
(1,918) |
880 |
848 |
916 |
921 |
||
Closing net debt/(cash) |
880 |
848 |
916 |
921 |
855 |
Source: Dowlais accounts, Edison Investment Research
Appendix: GKN Automotive division activity profile
Exhibit 32 provides an overview of GKN Automotive’s product set.
|
Exhibit 32: The product set |
|
|
Source: Dowlais Group |
Sideshafts and constant velocity joints
The sideshaft and two CVJs form a system connecting the motor/gearbox to the wheel to transfer the torque to the wheel (see Exhibit 33). Critical aspects are the efficient transfer of torque with minimal rotational losses while permitting the required angular variation. The system consists of three components:
■
A CVJ (see Exhibit 34) transmits torque from the sideshaft to the wheel. The ability to maintain constant velocity to the wheels despite the changing directional angles is key. The system operates as a ball and socket joint. The ball end houses an arrangement of ball bearings, which slot into grooves in the socket to transfer the rotational power. These grooves enable the point of contact to move as the wheels turn and hence the orientation between the wheel and the sideshaft changes, but the rotational transfer remains consistent. These joints operate at angles up to 50° as required in steering.
■
Sideshaft: this is the connecting rod that transfers the torque between the two joints. The weight and stiffness/torsional resistance are key.
■
A lower specification joint is positioned at the inboard end attaching the sideshaft to the engine/gearbox. This is a simpler and cheaper joint, which transfers the torque but only permits limited angular movement as required primarily by the suspension between the motor and the wheels as the directional movement is limited.
|
Exhibit 33: Sideshaft |
Exhibit 34: Constant velocity joint |
|
|
|
Source: Dowlais Group |
|
Exhibit 33: Sideshaft |
|
|
Source: Dowlais Group |
|
Exhibit 34: Constant velocity joint |
|
|
Source: Dowlais Group |
Propshafts
A propshaft is a rotating metal rod/tube to take the power from the engine/gearbox in the front of the car to the rear axle. Like a sideshaft, this is a relatively simple component, albeit having to handle significant torsional stress.
|
Exhibit 35: Propshaft |
|
|
Source: Dowlais Group |
ePowertrain systems
GKN Automotive has developed a range of products designed to control torque transfer, which include vectoring capabilities enabling varying levels of torque to be delivered to each wheel, thereby improving traction and cornering. Traditional systems utilised the braking system on individual wheels, which the GKN system does not. This family of products includes clutches and differentials.
|
Exhibit 36: AWD Twinster torque vectoring |
|
|
Source: Dowlais Group |
eDrive components and systems
A full eDrive powertrain system converts the battery’s electrical energy into the mechanical rotational torque required to drive the wheels. The system incorporates an electric motor to generate the mechanical power, power electronics/invertor to control the motor and gearbox/differentials/torque management systems to condition the torque and transfer to the sideshafts, all within an overarching software control system. The entire system is termed three-in-one (motor, gearing and invertor), whereas systems without the invertor are known as two-in-one. GKN Automotive’s involvement came from its torque management expertise, vertically integrating to provide the full drive package along with internally developed control software. Exhibit 37 highlights the key components in the system.
|
Exhibit 37: eDrive system and components |
|
|
Source: Dowlais Group |
|
|
Research: Investment Companies
BB Biotech (BION) invests in innovative, rapidly expanding biotech companies. BION’s portfolio company Wave Life Sciences (Wave) recently announced a significant milestone in the field of genetic medicine: the first successful therapeutic RNA editing in humans. This news lifted Wave’s share price by c 60%. It follows recent positive developments in three of BION’s largest holdings, Alnylam, Intra-Cellular Therapies and Agios, which all saw substantial improvements in their longer-term revenue prospects after positive Phase III readouts. Wave’s news adds to the recent positive momentum in BION’s NAV, which rose by 5.2% in the year ended 30 September 2024, after several years of annual declines, although this return lagged the Nasdaq Biotech Index’s 12.3% rise. Yet the company’s share price declined by 8.1% over this period and the share price discount to NAV is currently over 15%, in stark contrast to an average NAV premium of c 10% over the past 10 years. With interest rates falling and the outlook for the biotech sector potentially brightening accordingly, as we argued in our August 2024 update, this may represent an opportunity for investors to acquire access to the exciting opportunities offered by this industry at what may be an uncommonly wide discount.