AJ Lucas (AJL) has benefited from a material recovery in profitability from its Australian onshore drilling division, with underlying EBITDA in H119 (31 December 2018) of A$13.1m (17.2% margin), up from A$5.5m (9.7% margin) in the previous year. High rig utilisation and strong coal mine degassing demand support our forecast of revenue sustained at close to H119 levels (A$76.2m). AJL’s track record and tier 1 client relationships support management guidance of FY19 drilling underlying EBITDA in excess of FY18’s A$19.7m (Edison FY19 forecast: A$22.5m). Valuing Lucas Drilling Services (LDS) at 6x Edison adjusted EBITDA (after associated overheads) equates to A$0.15/share or A$0.03/share after consideration of group net debt. This excludes our net P50 UK shale valuation of A$0.91/share. We intend to update our probabilistic value of UK shale based on an improved understanding of key inputs including initial production rate (IP rate), estimated ultimate recovery (EUR) and well costs.
Written by
AJ Lucas Group |
Drilling recovery, but a growing debt pile |
Drilling recovery |
Oil & gas |
13 May 2019 |
Share price performance
Business description
Next events
Analysts
AJ Lucas Group is a research client of Edison Investment Research Limited |
|||||||||||||||||||||||||||||||||||||||||||||||
AJ Lucas (AJL) has benefited from a material recovery in profitability from its Australian onshore drilling division, with underlying EBITDA in H119 (31 December 2018) of A$13.1m (17.2% margin), up from A$5.5m (9.7% margin) in the previous year. High rig utilisation and strong coal mine degassing demand support our forecast of revenue sustained at close to H119 levels (A$76.2m). AJL’s track record and tier 1 client relationships support management guidance of FY19 drilling underlying EBITDA in excess of FY18’s A$19.7m (Edison FY19 forecast: A$22.5m). Valuing Lucas Drilling Services (LDS) at 6x Edison adjusted EBITDA (after associated overheads) equates to A$0.15/share or A$0.03/share after consideration of group net debt. This excludes our net P50 UK shale valuation of A$0.91/share. We intend to update our probabilistic value of UK shale based on an improved understanding of key inputs including initial production rate (IP rate), estimated ultimate recovery (EUR) and well costs.
Year-end |
Revenue |
Gross profit |
Operating cash flow (A$m) |
Edison adjusted |
Capex |
Net debt |
06/17 |
122.6 |
1.4 |
(27.2) |
(3.8) |
(12.8) |
85.1 |
06/18 |
127.1 |
21.6 |
(13.1) |
15.4 |
(13.5) |
75.0 |
06/19e** |
140.9 |
22.5 |
18.2 |
18.3 |
(35.5) |
104.2 |
06/20e** |
143.7 |
21.6 |
9.5 |
17.3 |
(5.0) |
111.5 |
Note: *Before share of loss from equity accounted investees, asset sales and one-off costs, before UK investment overhead and after Australian overheads. **Forecasts exclude discontinued activities – Lucas Engineering & Construction.
AJL drilling valuation
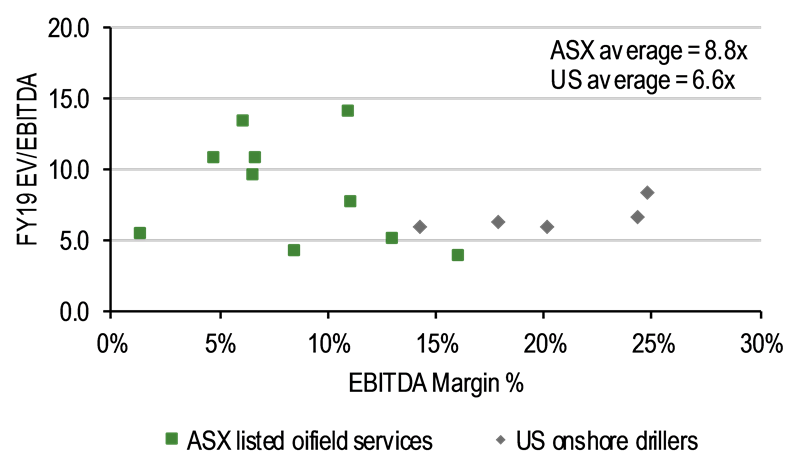
We value LDS on the basis of 6x FY19e underlying EBITDA (A$22.5m before overheads and A$18.3m after associated overheads). This multiple is towards the bottom end of the Australian domestic OFS sector, which includes a diverse set of businesses, and in line with the US onshore drilling sector. We believe this multiple reflects the cyclical nature of rig demand, utilisation and operating margins visible in LDS’s recent history. LDS is currently experiencing strong top-line and margin growth driven by underlying rig demand, with visibility of earnings from current customers underpinning our FY19 EBITDA forecasts.
UK shale: Evolving model inputs
Model inputs for our probabilistic valuation of UK shale potential continue to evolve, and we expect to provide an update based on Cuadrilla’s estimates of scaled-up IP rates, UK Onshore Oil and Gas (UKOOG) estimates of EUR and estimates of Springs Road well costs.
Valuation: Debt a key consideration for equity holders
Including our last published P50 value for UK shale potential to our LDS valuation (see our initiation report, published on 9 April 2018), our group valuation rises to A$0.94/share. Total balance sheet debt at end December 2018 stood at A$108.9m. Despite continued support from debt holders and with senior loan note repayment obligations deferred to September 2019, the 18% (cash and accrued interest) pre-tax cost of debt remains high.
Continued positive momentum in LDS
LDS’s positive H1 momentum, both top-line and in EBITDA margin, has been driven by increased activity levels, higher rig utilisation and improved pricing. Demand for coal mine degassing and directional drilling remains robust and the ability to sustain margins at current levels is supported by the existing backlog (five to six months) as well as leading/lagging indicators. In this regard, we follow Australian mining exploration metres drilled and shipped coal tonnage indicators. As shown in Exhibit 3, mining exploration expenditure and metres drilled have reached multi-year highs (last reached in 2013).
LDS’s H119 underlying EBITDA margins (to 31 December 2018) stood at c 17.2%, compared to 15.8% in FY18 and 9.7% in H118. AJL does not disclose detailed information on rig utilisation, day-rates or rig margins hence it is difficult to determine the precise drivers behind this increase. Nevertheless, management has strong contract visibility for H219, underpinning guidance that LDS’s underlying EBITDA should exceed A$19.7m in FY19e. We forecast an average underlying margin of 16.5% for FY19, dropping to 15% for FY20. We believe that AJL’s track record (execution and safety), scale and strong relationships with tier 1 clients enable it to retain pricing power despite smaller-scale competitors adding directional drilling rig-count.
|
Exhibit 1: Underlying LDS EBITDA margins |
Exhibit 2: Peer-group EV/EBITDA multiples |
|
|
|
Source: Edison Investment Research |
Source: Bloomberg, Edison Investment Research |
|
Exhibit 1: Underlying LDS EBITDA margins |
|
|
Source: Edison Investment Research |
|
Exhibit 2: Peer-group EV/EBITDA multiples |
|
|
Source: Bloomberg, Edison Investment Research |
AJL sees potential to add further rigs to the company’s 39-strong fleet, which would drive further top-line growth. In the current environment, we would expect rig investments to deliver high returns on investment and quick payback. However, AJL capital restrictions may limit management appetite for a material expansion in rig fleet.
|
Exhibit 3: Australian mining exploration expenditure and metres drilled |
Exhibit 4: Shipped coal tonnage from three major ports* |
|
|
|
Source: Australian Bureau of Statistics, Edison Investment Research |
Source: Edison Investment Research. Note: *Dalrymple Bay, Hay Point and Abbot Point coal terminals. **Exports decrease due to weather-related issues. |
|
Exhibit 3: Australian mining exploration expenditure and metres drilled |
|
|
Source: Australian Bureau of Statistics, Edison Investment Research |
|
Exhibit 4: Shipped coal tonnage from three major ports* |
|
|
Source: Edison Investment Research. Note: *Dalrymple Bay, Hay Point and Abbot Point coal terminals. **Exports decrease due to weather-related issues. |
UK shale: Upcoming work programme
At present, we do not have details of the continuing work programme at Preston New Road, but note comments made by Cuadrilla CEO, Francis Egan, as of 1 May 2019: ‘We’re looking forward now to the next phase of hydraulic fracturing and unlocking a huge economic opportunity for the county and country for decades to come. Please be reassured that work is ongoing and both our wells remain ready for hydraulic fracturing.’
AJ Lucas has a 47.6% interest in Cuadrilla, a company active in the exploration and appraisal of shale in the UK. Cuadrilla’s appraisal of shale gas potential at Preston New Road appears to have stalled due to the restrictions imposed under the current oil and gas authority (OGA) micro-seismicity traffic light system (TLS). As it stands, the TLS obligates operators to halt hydraulic fracturing operations if the seismic monitoring measures a seismic event in the location of the operation exceeding 0.5M. The Richter scale is a log scale and events below 2M (178 times as powerful as a 0.5M event) are generally not felt.
We have not conducted any analysis on whether or not the TLS is fit for purpose, but looking at the last 12 months of data published by the British Geological Society (BGS) on seismic events in the UK, frequent naturally occurring seismic events are well in excess of 0.5M.
|
Exhibit 5: BGS data on UK seismic events (last 12 months) with TLS overlay |
|
|
Source: British Geological Society, Edison Investment Research |
UK shale: Probabilistic valuation update
We intend to revisit our probabilistic approach to valuation of UK shale based on updated input distributions for key value drivers including IP rate, EUR, gas prices and well costs. We will revise our valuation once there is further information made available from the IGas-operated Springs Road-1 (SR-1) vertical well. IGas expects to release information on core data from SR-1 in Q219.
Our last reported valuation for AJL’s net UK shale exposure, through its 47.6% interest in Cuadrilla, was an unrisked P50 of US$2,142/acre (after assumed 50% farmout dilution), or a net risked A$692m. On a per share basis, this equates to A$0.91/share, net of our current estimate of allocated AJL UK shale expense. Valuation uncertainty was significant prior to appraisal, with Edison estimating a P35 net valuation of A$1.28/share and P65 of A$0.65/share for AJL’s net UK shale exposure. Based on this approach, we estimated a 67% chance of commercial success (NPV15 being greater than zero).
US shale type curves continue to evolve
The United States has been leading the charge in terms of global shale resource exploration and monetisation. Drilling companies have been developing state-of-the-art technologies and operating methodologies relating to hydraulic fracturing in order to reduce break-even costs and maximise per well returns. The deployment of modern completion technology and extended reach lateral drilling has resulted in improvements driving cost reductions and increased resource recovery. Exhibits 6 to 9 below show the evolution in type curves, EUR, well laterals length and drilling and completion costs over the past years of EQT, a top Marcellus shale gas producer. US shale operators are likely to continue to innovate in order to maximise returns in a market with some of lowest gas prices globally.
UK shale producers are likely to be able to take advantage of US technology advancements, but there is still likely to be a learning curve as operational practices are manipulated to fit UK shale rock properties, basin complexity and operational restrictions.
|
Exhibit 6: Evolution of EQT Marcellus type curves and EUR over the last years |
Exhibit 7: Evolution of EQT Marcellus lateral length between 2013 and 2018 |
|
|
|
Source: EQT, Edison Investment Research |
|
Exhibit 8: Evolution of EQT EUR per lateral length between 2013 and 2018 |
Exhibit 9: Evolution of EQT drilling and completion cost per mcfe between 2013 and 2018 |
|
|
|
Source: EQT, Edison Investment Research |
|
Exhibit 6: Evolution of EQT Marcellus type curves and EUR over the last years |
|
|
Source: EQT, Edison Investment Research |
|
Exhibit 8: Evolution of EQT EUR per lateral length between 2013 and 2018 |
|
|
Source: EQT, Edison Investment Research |
|
Exhibit 7: Evolution of EQT Marcellus lateral length between 2013 and 2018 |
|
|
Source: EQT, Edison Investment Research |
|
Exhibit 9: Evolution of EQT drilling and completion cost per mcfe between 2013 and 2018 |
|
|
Source: EQT, Edison Investment Research |
Key risks and other valuation sensitivities
Key caveats that may have an impact on our probabilistic valuation include:
■
There is a risk of a change in government stance with regard to the exploitation of shale gas.
■
We assume a two-year planning cycle for well pads; however, recent events including restrictions under the TLS could lead to extended delays.
■
We do not assume resource limitations due to land access restrictions in our analysis over and above those applied by BGS in the society’s calculation of GIIP.
■
We assume recoverable gas per acre is homogeneous across the BGS Bowland prospective shale area. This could prove to be a conservative assumption as Cuadrilla is ideally located in the heart of the Bowland Basin, which contains a thick upper and lower Bowland shale section, ie a thicker than average shale.
■
At this stage, we do not include any value for Cuadrilla’s Weald Basin licences (a further 24,600 acres). The company’s current focus is on shale activity in North West England/UK.
Key changes to our valuation include:
■
An increase in the drilling component of our valuation to reflect recent top-line strength and recovery in EBITDA margins as described earlier in this note.
■
Updated net debt as of December 2018.
■
A change in AJ Lucas equity in Cuadrilla from 47.45% to 47.60%.
Edison’s P50 UK shale valuation remains unchanged at this point, subject to review.
Our total valuation for AJL excluding UK shale stands at A$0.03/share (A$0.16 for LDS and LEC working capital unwind, after a reduction of A$0.13/share for net debt). Including our last published UK shale valuation net of UK SG&A and net UK shale appraisal costs this rises to A$0.94/share.
|
Exhibit 10: AJL valuation waterfall |
|
|
Source: Edison Investment Research |
Exhibit 11: AJL SOTP valuation
Asset NOSH: 750m |
Country |
Diluted WI % |
CoS % |
Recoverable reserves |
Net risked |
Value per share |
||
Gross |
Net |
NPV/boe |
value |
risked |
||||
bcf |
bcf |
A$/mcf |
A$m |
A$/share |
||||
Net debt at end December 2018 |
(96) |
(0.13) |
||||||
UK SG&A - NPV10 of 3yrs |
UK |
100% |
100% |
(6) |
(0.01) |
|||
Lucas E&C working capital unwind remaining |
Australia |
100% |
100% |
10 |
0.01 |
|||
Lucas Drilling services |
Australia |
100% |
100% |
110 |
0.15 |
|||
Lucas net UK shale appraisal costs |
UK |
100% |
100% |
(30) |
(0.04) |
|||
Net UK shale valuation P50 |
UK |
50%* |
67% |
10,459 |
2,282 |
0.47 |
716 |
0.96 |
Valuation |
729 |
0.94 |
||||||
Source: Edison Investment Research. Note: *Based on risked P50 NPV output from probabilistic model.
Financials and forecasts
We highlight changes to our short-term forecasts below. Our previously published FY20 forecasts had included an associate income from UK onshore shale activity. We no longer forecast a UK shale contribution in FY20, hence the reduction in income from associates. Our top-line and EBITDA forecasts are driven by LDS activity levels and drilling margins.
Exhibit 12: Old versus new forecasts
Edison new |
Edison old |
Change |
||||
A$m |
2019e |
2020e |
2019e |
2020e |
2019e |
2020e |
Revenues |
140.9 |
143.7 |
127.2 |
129.7 |
11% |
11% |
Drilling underlying EBITDA |
22.5 |
21.6 |
17.8 |
18.2 |
27% |
19% |
Group net income |
(11.6) |
(10.3) |
(10.9) |
51.8 |
7% |
(120%) |
Source: Edison Investment Research
Below we take a look at AJL’s ability to fund ongoing UK shale capital commitments, LDS maintenance capex (estimated at A$5m pa) and upcoming debt repayment obligations. Current cash at A$10m (31 December 2018) provides visibility of funding through to September 2019, the current date at which AJL is due to reduce its senior loan note balance to A$20m. Assuming further deferment of repayment obligations, current cash could provide visibility of funding through to June 2020. However, equity holders need to be cognisant of the fact that AJL’s debt pile will continue to grow on inclusion of accrued interest on existing debt facilities.
|
Exhibit 13: Cash bridge 31 June 2018 to 31 June 2020 assuming further deferment of debt repayments |
Exhibit 14: Current debt maturities* |
|
|
|
Source: AJ Lucas, Edison Investment Research. Note: *After cash interest expense and A$10m working cap unwind from E&C sale. |
Source: AJ Lucas, Edison Investment Research. Note: *Includes accrued interest as of December 2018. |
|
Exhibit 13: Cash bridge 31 June 2018 to 31 June 2020 assuming further deferment of debt repayments |
|
|
Source: AJ Lucas, Edison Investment Research. Note: *After cash interest expense and A$10m working cap unwind from E&C sale. |
|
Exhibit 14: Current debt maturities* |
|
|
Source: AJ Lucas, Edison Investment Research. Note: *Includes accrued interest as of December 2018. |
AJL’s cost of debt remains high relative to industry standards with outstanding facilities priced at 18% (cash payments and accrued interest). This continues to reflect the use of funds to pursue the appraisal of UK shale and recent volatility in AJ Lucas drilling EBITDA. Subordinated debt is provided by AJ Lucas’s largest shareholder, Kerogen, and equity holders need to be aware of potential equity dilution if loan holders were to convert to equity. Historically, debt has only been converted to equity by Kerogen to take up rights under an entitlement offer. As such, this would not lead to dilution as long as a shareholder participates for its pro rata entitlement in such a capital raise.
On 3 April 2019, AJ Lucas announced that it had reached agreement with its principal debt provider, OCP Asia, to amend certain terms of its loan. This has led to the deferral of AJL’s obligation to pay down US$42.4m of its outstanding loan to US$20m from 30 June 2019 to 30 September 2019. AJL has also secured an extension to the date at which it is required to pay down the balance of its loan from January 2020 to end March 2020.
Concurrently, Kerogen has agreed to extend its loan facility from 31 July 2020 to the earlier of 30 September 2020 or six months from full repayment of the senior loan notes facility.
Exhibit 15: AJL debt facilities
Debt instrument |
Amount outstanding (book value) |
Maturity |
Rate |
Kerogen Tranche 2 |
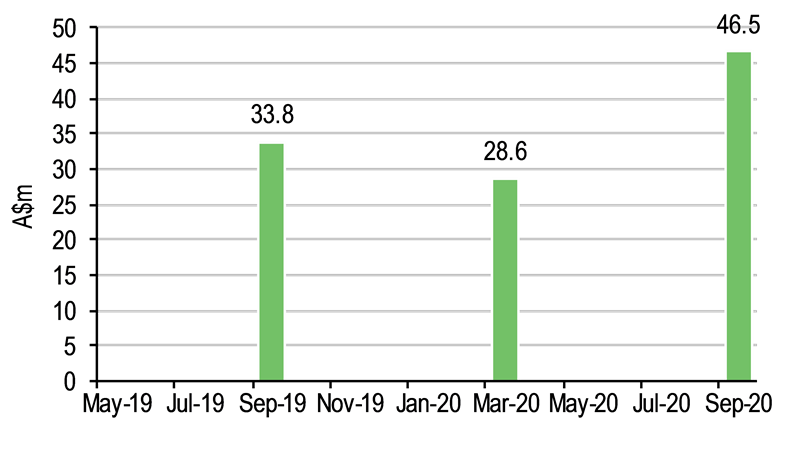
A$46.5m |
Dec-19 |
18% to be repaid earlier of 30 September 2020 or six months from repayment of senior loan notes. Interest compounds quarterly if unpaid. |
Senior loan note (OCP) |
A$62.4m |
Sep-19 |
18% paid 12% quarterly and 6% accruing until termination. To be reduced to US$20m by 30 September 2019 and repaid before March 2020. |
Source: Edison Investment Research
Exhibit 16: Financial summary
Year-end: June |
|
A$m |
2016 |
2017 |
2018 |
2019e |
2020e |
|
|
|
IFRS |
IFRS |
IFRS |
IFRS |
IFRS |
PROFIT & LOSS |
|||||||
Revenue |
|
|
126.0 |
122.6 |
127.1 |
140.9 |
143.7 |
Cost of Sales |
(104.7) |
(121.2) |
(105.5) |
(118.4) |
(122.2) |
||
Gross Profit |
21.3 |
1.4 |
21.6 |
22.5 |
21.6 |
||
Underlying EBITDA |
|
|
18.3 |
0.8 |
19.7 |
22.5 |
21.6 |
Edison adjusted EBITDA* |
|
|
14.6 |
(3.8) |
15.4 |
18.3 |
17.3 |
Operating Profit (before amort. and except.) |
|
|
(10.6) |
(12.1) |
7.3 |
10.1 |
12.1 |
Intangible Amortisation |
0.0 |
0.0 |
0.0 |
0.0 |
0.0 |
||
Exceptionals |
0.0 |
0.0 |
0.0 |
0.0 |
0.0 |
||
Other / P&L equity accounted investees |
(6.8) |
(2.7) |
8.2 |
(2.2) |
(2.2) |
||
Operating Profit |
(17.4) |
(14.9) |
15.5 |
7.9 |
9.9 |
||
Net Interest |
(2.1) |
(24.2) |
(24.1) |
(19.5) |
(20.2) |
||
Profit Before Tax (norm) |
|
|
(12.7) |
(36.3) |
(16.7) |
(9.5) |
(8.1) |
Profit Before Tax (FRS 3) |
|
|
(19.5) |
(39.0) |
(8.5) |
(11.6) |
(10.3) |
Tax |
0.0 |
0.0 |
0.0 |
0.0 |
0.0 |
||
Profit After Tax (norm) |
(19.5) |
(39.0) |
(8.5) |
(11.6) |
(10.3) |
||
Profit After Tax (FRS 3) |
(19.5) |
(39.0) |
(8.5) |
(11.6) |
(10.3) |
||
Average Number of Shares Outstanding (m) |
395.0 |
585.0 |
749.9 |
749.9 |
749.9 |
||
EPS - normalised (c) |
|
|
(4.9) |
(6.7) |
(1.1) |
(1.6) |
(1.4) |
EPS - normalised fully diluted (c) |
|
|
(4.9) |
(6.7) |
(1.1) |
(1.6) |
(1.4) |
EPS (IFRS) (c) |
|
|
(.0) |
(.0) |
(.0) |
(.0) |
(.0) |
Dividend per share (c) |
0.0 |
0.0 |
0.0 |
0.0 |
0.0 |
||
Gross Margin (%) |
16.9 |
1.1 |
17.0 |
16.0 |
15.0 |
||
EBITDA Margin (%) |
(1.9) |
(7.1) |
(4.2) |
0.0 |
0.0 |
||
Operating Margin (before GW and except.) (%) |
(8.4) |
(9.9) |
5.8 |
7.1 |
8.4 |
||
BALANCE SHEET |
|||||||
Fixed Assets |
|
|
163.5 |
163.6 |
184.1 |
212.0 |
209.3 |
Intangible Assets |
18.3 |
21.0 |
35.9 |
35.9 |
35.9 |
||
Tangible Assets |
39.0 |
37.9 |
27.7 |
27.7 |
27.2 |
||
Investments |
106.2 |
104.8 |
120.5 |
148.4 |
146.2 |
||
Current Assets |
|
|
65.6 |
76.6 |
82.8 |
66.1 |
66.1 |
Stocks |
16.0 |
30.9 |
40.8 |
32.8 |
32.8 |
||
Debtors |
25.8 |
22.5 |
27.2 |
25.2 |
25.2 |
||
Cash |
22.5 |
22.2 |
9.8 |
8.0 |
8.0 |
||
Other |
1.3 |
1.1 |
4.9 |
0.0 |
0.0 |
||
Current Liabilities |
|
|
(70.4) |
(35.5) |
(59.3) |
(54.5) |
(54.5) |
Creditors |
(35.7) |
(34.3) |
(42.1) |
(37.3) |
(37.3) |
||
Short term borrowings** |
(34.7) |
(1.1) |
(17.2) |
(17.2) |
(17.2) |
||
Long Term Liabilities |
|
|
(71.9) |
(107.0) |
(68.5) |
(96.1) |
(103.7) |
Long term borrowings |
(71.0) |
(106.1) |
(67.7) |
(95.2) |
(102.8) |
||
Other long term liabilities |
(.9) |
(.8) |
(.9) |
(.9) |
(.9) |
||
Net Assets |
|
|
86.8 |
97.8 |
139.1 |
127.5 |
117.2 |
CASH FLOW |
|||||||
Operating Cash Flow |
|
|
(24.6) |
(27.2) |
(13.1) |
18.2 |
9.5 |
Net Interest |
0.0 |
0.0 |
0.0 |
0.0 |
0.0 |
||
Tax |
0.0 |
0.0 |
0.0 |
0.0 |
0.0 |
||
Capex |
(6.6) |
(12.8) |
(13.5) |
(35.5) |
(5.0)*** |
||
Acquisitions/disposals |
0.0 |
0.0 |
0.0 |
0.0 |
0.0 |
||
Financing |
5.2 |
15.2 |
15.2 |
0.0 |
0.0 |
||
Dividends |
0.0 |
0.0 |
0.0 |
0.0 |
0.0 |
||
Net Cash Flow |
(26.1) |
(24.7) |
(11.4) |
(17.3) |
4.5 |
||
Opening net debt/(cash) |
|
|
62.9 |
83.2 |
85.1 |
75.0 |
104.4 |
HP finance leases initiated |
0.0 |
0.0 |
0.0 |
0.0 |
0.0 |
||
Other |
5.7 |
22.8 |
21.5 |
(12.1) |
(12.1) |
||
Closing net debt/(cash) |
|
|
83.2 |
85.1 |
75.0 |
104.4 |
112.0 |
Source: AJ Lucas accounts, Edison Investment Research. Note: *Before share of loss from equity accounted investees, UK investment overhead, asset sales and one-off costs. **Assumes continued extension of short-term maturities. ***No expenditure currently modelled for Cuadrilla ahead of confirmation of work programme.
|
||||||||||||
|
||||||||||||
Research: TMT
Mondo TV has started FY19 in much improved financial health, with a more concentrated portfolio centred on properties with good potential globally. YooHoo has been sold to Netflix as an original series and is now airing internationally, generating revenues and also acting as a flagship project. Licensing revenues should pick up in its wake. Robot Trains should also contribute from this year. The highly competitive environment between terrestrial and SVoD carriers provides a strong trading backdrop as they vie for content. Post the re-basing, Mondo TV is a far less risky investment proposition, yet is priced at a substantial discount to global peers.