AJ Lucas offers investors exposure to the most advanced UK shale appraisal programme in the UK. Current activity is focused on a drilling campaign at Preston New Road where the company has approval to drill and test up to four horizontal wells. Prior to appraisal, which is aimed at reducing technical and economic uncertainty, we utilise a probabilistic approach to valuation estimating a 67% chance of commercial success for UK shale (NPV15 >0) with a net P50 risked value of A$0.92/share. At a group level, incorporating AJL’s operating business units and net debt, we derive a P50 (mid-case) valuation of A$0.86/share.
Written by
AJ Lucas Group |
Dominant Bowland shale position |
Initiation of coverage |
Oil & gas |
9 April 2018 |
Share price performance
Business description
Next events
Analysts
AJ Lucas Group is a research client of Edison Investment Research Limited |
|||||||||||||||||||||||||||||||||||||||||||||||
AJ Lucas offers investors exposure to the most advanced UK shale appraisal programme in the UK. Current activity is focused on a drilling campaign at Preston New Road where the company has approval to drill and test up to four horizontal wells. Prior to appraisal, which is aimed at reducing technical and economic uncertainty, we utilise a probabilistic approach to valuation estimating a 67% chance of commercial success for UK shale (NPV15 >0) with a net P50 risked value of A$0.92/share. At a group level, incorporating AJL’s operating business units and net debt, we derive a P50 (mid-case) valuation of A$0.86/share.
Year end |
Revenue |
Reported EBITDA (A$m) |
Underlying EBITDA* (A$m) |
Capex |
Net debt |
06/16 |
126.0 |
(2.4) |
14.6 |
(6.6) |
(83.2) |
06/17 |
122.6 |
(8.7) |
(3.8) |
(12.8) |
(85.1) |
06/18e |
122.1 |
(5.4) |
0.4 |
(8.5) |
(55.8) |
06/19e** |
97.3 |
1.1 |
6.3 |
(7.0) |
(73.2) |
Note: *Before share of loss from equity accounted investees, UK investment overhead, asset sales and one-off costs. **Assumes sale of Lucas Engineering & Construction.
De-risking UK Bowland Basin shale acreage
AJ Lucas has interest in 256,000 net shale acres, and is currently participating in the drilling and completion of up to four horizontal wells at the Cuadrilla operated Preston New Road (PNR) site. Initial results from PNR are expected in Q418, with potential to be followed by an extended well test during which produced gas is sold in to the local gas grid. Whilst there is significant uncertainty around productivity, Cuadrilla is confident that results from the planned c 1km horizontal will exceed those of the nearby Preese-Hall 1 where gas flowed from the Bowland at 400-500mscfd in 2011 from three vertical frac stages. Consultancy, Anderson Thompson, has constructed probabilistic-type curves for the Bowland using US analogue and core data, implying that a mid-case EUR of 6.5bcf and 30-day IP rate of c.15mmscfd (Edison interpretation from published data) is achievable from a 2.5km lateral. Confidence in our valuation will increase once a type curve (initial production rate, decline rate and gas recovery) has been established.
UK shale valuation – a probabilistic approach
Given current uncertainty around Bowland shale type curves, well costs, rig availability and gas prices we have used a probabilistic approach when determining the likelihood of commercial success. This analysis indicates a commercial success of 67% (NPV15 >0), and a net risked P50 valuation of A$690m or A$0.92/share (after assumed 50% value dilution through development farm-out). This equates to a unit value of US$2,142/acre. Key sensitivities include initial production rate, estimated ultimate recovery (EUR), gas price and well cost.
AJ Lucas group valuation
For the group’s continuing operating business we use a conservative 6x average EBITDA in light of recent revenue and margin volatility. Our P50 (mid-case) group valuation stands at A$0.86/share. Investors should be aware of the high cost of current debt, and should make further concessions in order to factor in their view of UK shale political risk.
Investment summary
Company description: Australian drilling services and UK shale
AJ Lucas provides investors with exposure to both the exploitation of UK shale resource through the group’s direct equity interest in UK licences (PEDLs) and through a 47.4% interest in Cuadrilla Resources and the Australian drilling services sector, through its operating business unit. Exhibit 2 outlines group structure and licence ownership.
Valuation: High probability of commercial success
Valuation of AJL’s UK shale acreage is based on a probabilistic approach given the wide range of uncertainty driving key inputs including: gas productivity, well type curves, access to UK based rigs and pressure pumping services and well costs. We utilise extensive data-sets from US dry gas analogues (Marcelles, Barnett and Fayetteville) and British Geological Survey (BGS) estimates of gas initially in place (GIIP). Our analysis implies a commercial chance of success at 67% and net P50 risked shale valuation of A$690m (A$0.92/share).
Risks and sensitivities: Quantifying uncertainty
Key valuation drivers include well IP rates, realised gas prices and well costs. Risks include political support for shale gas extraction in the UK, as the leading political parties maintain opposing views on the net benefits of UK shale extraction. The current incumbent believes that shale will provide a significant benefit in terms of employment, security of energy supply and will support a renewable energy transition. Mitigation measures have been put in place following the seismic events experienced in the Cuadrilla operated Preese Hall-1 well in 2010; however any further similar events at Preston New Road would likely have a negative impact on public sentiment.
|
Exhibit 1: AJL group valuation waterfall |
|
|
Source: Edison Investment Research |
Financials: Volatile revenues and margins
Operating business units are the key drivers of current revenues and operating profit; however margins have been volatile in recent reporting periods. Free cash flow remains negative in the short-term reflecting UK shale investment and debt servicing. Given the group’s debt maturities in 2019, we expect debt holders, to extend existing facilities. Shareholders need to be cognisant of the relative high cost of maturing debt, with interest rates ranging from 16-18%. AJ Lucas announced an equity placing and entitlement offer in January 2018 raising A$51.2m, with proceeds used to reduce current debt and contribute towards UK shale net capex/overhead costs.
AJ Lucas company description
AJ Lucas has equity interests in two operating business units and has an equity interest in Cuadrilla Resources as described in Exhibit 2 below:
1.
Oil and gas investments/Cuadrilla – leveraging drilling expertise to source early shale gas opportunities in the UK
2.
Drilling services (LDS) – a major drilling provider to the coal and CSG coal mine degassing and exploration drilling sectors in Australia
3.
Engineering and construction (LEC) – provides engineering and construction services to the coal, energy, water and waste water and public utility sectors. AJL is currently assessing several non-binding proposals for the sale of this business unit.
|
Exhibit 2: AJ Lucas & Cuadrilla corporate structure |
|
|
Source: AJ Lucas |
UK shale – current understanding and upcoming activity
Numerous studies have been conducted in order to quantify UK shale gas resources; these form the basis of our economic analysis as described in the valuation section of this note. Historic core wells and a vertical exploratory well at Preese Hall provide supportive data to suggest potential for commercial well pad economics. The Bowland shale is thermally mature for gas and benefits from very thick shale sections. Total organic content ranges from 1-7% in cored intervals, and Cuadrilla has demonstrated gas flow to surface at Preese Hall. Significant uncertainty remains with regard to level of overpressure, the impact of structural complexity on gas recovery and well type curves. Upcoming activity is aimed at reducing this uncertainty through further exploration and appraisal. Cuadrilla recently spudded an exploratory well at Preston New Road and initial results from a 90 day flow test are expected in Q418. This is to be followed by an extended well test, which should provide valuable data on the type curve for a fracture stimulated horizontal well – a key determinant of well economics and valuation. Assuming strong gas flows, Cuadrilla may decide to connect the wells and sell gas in to the local grid. A key input to our valuation is the 2.5km horizontal well probabilistic-type curve produced by consultancy Anderson Thompson (Exhibit 30) – if actual type curves vary significantly from those predicted this would have a material impact on valuation. We expect greater valuation certainty after flow test results from Preston New Road.
UK shale – summary and upcoming activity
AJ Lucas, through its direct holdings and 47.4% interest in Cuadrilla, offers investors exposure to the most advanced UK shale appraisal programme, and a dominant acreage position in the Bowland Basin. A geological description of the Bowland shale, discussion of key historical well results and benchmarking versus US analogues is provided in Appendix 1 of this report. A brief summary of this analysis is provided below:
BGS estimates suggest material gas in place
UK drilling has been concentrated in the western portion of the Bowland sub-basin in Lancashire, one of a number of rift basins formed by crustal extension in the UK between late Devonian/Dinantian times. The Bowland Basin is one of the largest basins and continues westwards beneath the East Irish Sea, where conventional gas fields Hamilton, Douglas and Lennox have produced c 4-5 TCF to date. The key stratigraphic interval within the basin is the Bowland-Hodder shale, which extends across a large area of central Britain and is of Visean to early Namurian age. The gas bearing shale section is in excess of 6000ft and is intensely naturally fractured. BGS/DECC estimated in 2013 that the Bowland-Hodder unit contains P50 gas in place of 1,329tcf.
Preese Hall-1 well result and UK shale versus US analogues
Initial indications are promising for a successful shale gas play in the Bowland Shale. In 2010, the Preese Hall-1 exploration well demonstrated that the Bowland Shale is thermally mature for gas, flowing hydrocarbons to surface at a comingled rate of 400-500mcfd from three small vertical frac stages. The total organic content (TOC) has been found to vary through the stratigraphy averaging 2.65% (BGS 2013) with a range of 1% to 7% in the cored intervals. The Bowland is thicker but more intensely structured than the shale plays of North America - the presence of 3D seismic over 100km2 of PEDL 165 will allow wells to be drilled away from existing faults. The level of overpressure, if any, that exists in the Bowland is a key unknown characteristic.
|
Exhibit 3: Bowland licence map |
|
|
Source: UK Oil and Gas Authority (copyright), Cuadrilla |
During the fracture stimulation programme in 2010, two seismic events were observed after and as a result of this the programme was curtailed. An 18 month suspension was put in place while the cause of the tremors was investigated and rules for future mitigation were developed.
Preston New Road activity
Cuadrilla has planning permission to drill up to four horizontal wells from its Preston New Road (PNR) location in the Fylde, Lancashire. The current programme includes two wells with the remaining two wells to be drilled at a later stage. The location has been chosen in an area with the best well control and where there is a high confidence in the subsurface stratigraphy. Vertical drilling was completed in January 2018 through the Upper and Lower Bowland which was cored and logged. Based on the data gathered from the well, Cuadrilla has chosen where to position two 1000m horizontal wells which will be hydraulically stimulated with 45 stages per well. Each well will then be flow tested for up to 90 days. This initial test may be followed by an Extended Well Test (EWT) which would likely last for 18 to 24 months and would allow Cuadrilla to gather longer term production data with the option to sell produced gas in to the local grid.
Other UK shale activity
Other activity across the sector includes:
■
Third Energy’s potential fracture and flow test at Kirby Misperton-8, Yorkshire. In December 2016, Third Energy’s planning permission for KM-8 was upheld and the judicial review case by Friends of the Earth and Frack Free Rydale was dismissed. On 6 February 2018, the secretary of state asked the Oil & Gas Authority to undertake a review of Third Energy’s financial position prior to final consent to hydraulically fracture the KM-8 well. This process is currently ongoing.
■
Operator IGas received planning approval to drill two exploratory wells in Springs Road, Misson Springs, North Nottinghamshire in November 2016, and the site received final planning consents (Section 106) from Nottinghamshire County Council earlier this year.
■
Ineos has submitted numerous planning applications for core sampling across its extensive licence base. Activity includes coring at Bramleymoor lane, Harthill and 3D seismic in the East Midlands.
|
Exhibit 4: Operated gross shale acreage (top 10) |
|
|
Source: Edison Investment Research, OGA |
UK gas markets – a primary fuel to 2040
While detailed supply and demand analysis of UK gas markets is beyond the scope of this report, it is worth noting that we expect static UK gas demand growth in CY17 after a 13% increase in gas demand in 2016 versus 2015. The 2016 increase was driven by a 40% increase in gas being used for electricity generation as coal power generation declined. Demand is expected to remain close to this higher level in 2017. Demand for gas is expected to remain robust for baseload generation and as flexible generation capacity to support growth of renewable sources. The national grid expects gas to remain a primary heating fuel until the 2040s and then will support the electrification of the sector by providing an efficient source of top-up heating.
On the supply side, UK gas production peaked in 2000 and has since been declining, with the UK becoming increasingly reliant on pipeline and LNG imports. Under the National Grid’s ‘Gone Green’ energy scenario, which assumes no shale gas development in the UK (due to public perception rather than environmental or technical concerns), import dependency reaches nearly 90% by 2040; this compares to just 32% in its ‘consumer power’ or high shale gas case.1 On 1 March 2018, the National Grid warned of a potential gas shortage due to unseasonably low temperatures prompting within day prices to spike to over 200p/therm. This highlighted potential concerns over UK energy security in the event of extreme weather events and/or the failure of key gas import infrastructure.
National Grid: Future Energy Scenarios (UK gas and electricity transmission), July 2016.
From a pricing perspective we use an uncertainty range around the current forward curve to drive our economic analysis as described later in this report. To the downside, there is concern that as new US LNG export projects are sanctioned and commissioned European hub prices further converge with Henry Hub in the short-term given a forecast short-term glut in global LNG. At current Henry Hub prices (US$3/mcf), a European natural gas price of US$4.5/mcf to US$5/mcf is required in order to incentivise exports and cover marginal costs. However, we estimate the full-cycle cost of US LNG (including fixed costs) at $US7-7.5mcf, a price higher than current UK 12m average national balance point (NBP). We expect US LNG to provide a cap and floor to European gas prices in the short-term before LNG markets start to tighten beyond 2020. There is scope for UK gas prices to experience volatility, beyond normal seasonal drivers, due to increasing import dependency and the closure of domestic storage facilities combined with strong domestic demand growth.
|
Exhibit 5: US to Europe LNG economics |
Exhibit 6: Coal to gas switching economics* |
|
|
|
Source: Vermilion Energy |
Source: Vermilion Energy, Bloomberg. Note: *4 January 2018 strip. |
|
Exhibit 5: US to Europe LNG economics |
|
|
Source: Vermilion Energy |
|
Exhibit 6: Coal to gas switching economics* |
|
|
Source: Vermilion Energy, Bloomberg. Note: *4 January 2018 strip. |
UK shale gas valuation and sensitivities
The UK shale industry remains in its infancy; however, several catalysts over the course of the next 12-24 months have potential to significantly reduce technical and commercial uncertainties. Given the current uncertainties, we feel that it would be imprudent to utilise a deterministic DCF based valuation approach which remains the oil and gas E&P equity analyst’s preferred valuation tool. We have assessed the advantages and disadvantages of several valuation approaches including:
■
use of historic UK transaction values;
■
DCF valuation using deterministic model inputs;
■
DCF valuation using a probabilistic approach; and
■
use of US valuation analogues including acreage and resource multiples.
Historical UK transactions are outdated and range significantly in implied value per acre. Using transaction values is somewhat arbitrary and results in wide valuation range – a net value of US$64.4m to US$773m (A$80.5m to A$966m) for the AJ Lucas’s net Bowland shale position (based on transaction values that range from US$250/acre to US$3,000/acre). US comps also provide a wide range based on US E&P shale acreage values; we find these to be even less relevant given the gas price environment, hydrocarbon mix, the fact that most companies have several years of production history and also differences in tax/royalty regime compared to the UK.
The graph below looks at non-US shale transaction values (2009-2015) and how acreage values increase with project maturity.
|
Exhibit 7: Non-US shale gas transaction values/project maturity (log scale) |
|
|
Source: Egdon Resources |
Based on the exceptionally wide valuation ranges implied by UK transactional data and US shale comps we conclude that alternative methods would be more appropriate in determining the group’s UK shale value potential. We conclude that a probabilistic approach would provide a more useful tool in order to incorporate the various ‘known unknowns’ that set the bounds for valuation of a UK shale portfolio.
Utilising a probabilistic approach in order to value UK shale
Supporting the choice of a probabilistic or Monte Carlo approach for UK shale valuation is the extensive data-sets that help us describe the uncertainty of modelled inputs. These include data from thousands of wells drilled in US dry gas shales (Marcellus, Fayetteville, Barnett) which assist in the determination of probabilistic type curves (interpreted by consultancy Anderson Thompson and provided in Exhibit 30) and estimates of drilling and completion costs. In addition there are studies on UK shale carried out by reputable organisations, such as the British Geological Survey, which provide us with strong data support for gas in place inputs. We note that Anderson Thompson’s probabilistic 2.5km lateral-type curve assumes a mid-case EUR of 6.5bcf and from Exhibit 30 we estimate a 30-day IP rate of c 15mmscfd, which is comparable to a prolific Marcellus producer – we cannot validate the accuracy of this input and flag that it is a key driver of our valuation.
The table below highlights key inputs that drive our probabilistic valuation model.
Exhibit 8: UK shale analysis key input overview (see Appendix 2 for further detail)
Key inputs |
Data source |
Distribution/model used for analysis |
P50 value |
Gas initially in place (GIIP tcf) |
BGS* Bowland shale GIIP P10 to P90 |
1,329 |
Recovery Factor (Rf %) |
US analogue data (Marcelles, Barnett) |
Pert distribution range from 3% to 13% |
9.5% |
Well IP rate (mmcfd) |
Anderson Thompson modelled type curve 2.5km lateral |
lognormal distribution |
15,030 |
Well EUR (bcf) |
Anderson Thompson modelled type curve 2.5km lateral |
lognormal distribution |
6,498 |
Gas price (p/therm) |
Forward curve and contract volatility |
Black Scholes option pricing model |
45.8 |
Well cost ($m) |
US analogue data (Marcelles, Barnett) UK adjusted for 2.5km lateral and 100 frack stages |
Pert distribution based on US costs UK adjusted |
17.3 |
UK rig additions per year |
Existing rig count / logistical limitations |
Discrete uniform distribution from 1- 5 |
3 |
UK rig plateau |
Minimal data - will be correlated to shale commerciality |
Discrete uniform 10 to 30 rigs UK wide available capacity |
20 |
Source: Edison Investment Research. Note: *British Geological Society.
We provide graphical descriptions and further data on our chosen input distributions in Appendix 2 of this report. In the section below we discuss the key outputs from our AJL shale gas valuation model. Key steps of our AJL net shale valuation workflow are described below:
1.
Use of BGS Bowland shale GIIP distributions in order to determine the average GIIP/acre across mapped prospective acreage.
2.
Application of this distribution to AJL’s net Bowland shale acreage based on licensing data.
3.
Application of the input distributions as described in Exhibit 9 and Appendix 2 of this note including Bowland shale probabilistic type curves produced by Anderson Thompson.
4.
Monte Carlo2 simulation in order to define output distributions and analysis of this data.
A mathematical technique that introduces an element of uncertainty and random sampling to solve problems that might be deterministic in nature.
Key UK shale valuation conclusions
A description of key inputs, data sources and distributions is provided in Appendix 2 of this report. We describe the key outputs of our probabilistic valuation below.
NPV distribution – P50 net US$818m
The resulting NPV distribution from our probabilistic DCF model is provided below – this includes all outcomes including negative values which reflect low gas price, high cost and low productivity scenarios. The P50 NPV15 net to AJL is US$818m. As can be expected there is a relatively wide range of outcomes; however, it is encouraging to find that over 67% of modelled scenarios generated a positive NPV. We expect Cuadrilla’s upcoming appraisal programme to reduce technical uncertainty, especially with regard to well type curves which should provide for a tighter valuation distribution and increased confidence in potential investment returns.
|
Exhibit 9: NPV US$m distribution (including non-commercial cases where NPV15<0) |
|
|
■ Output NPV ranges from P90 negative US$1,653m to P10 positive US$3,540m. ■ 67% of calculated NPVs exceed zero. ■ P50 NPV15 net to AJL of US$818m. ■ Pmean NPV15 net to AJL of US$909m, higher than the P50 given the positive skew in our NPV distribution. |
|
Source: Edison Investment Research |
|
Commercial chance of success 67%
From our analysis, we observe that there is a 67% chance of shale gas development generating a positive NPV15 based on our input assumptions. A 15% WACC is used to reflect the through-cycle cost of capital of a UK based E&P rather than AJ Lucas’s current cost of capital. The commercial chance of success sensitivity to WACC is described below with a lower chance of success for higher cost of capital scenarios. We note that in all instances chance of success exceeds 50%.
|
Exhibit 10: Cumulative NPV US$m distributions for NPV15 NPV17.5 and NPV20 cases (unbounded) |
|
|
■ Implied probability of commerciality of 66.8% (NPV15 exceeds zero). ■ Implied probability of commerciality drops to 65.6% at NPV17.5 and 64.5% at NPV20. ■ Key sensitivities include type curve, gas price and well cost. |
|
Source: Edison Investment Research |
|
Positive NPV scenarios – risked diluted NPV of A$690m (A$0.92/share)
If shale gas is proven to be commercial, we estimate a net unrisked AJL P50 NPV of US$1,654m equating to unit value of US$6,418/acre. Applying a commercial chance of success of 67%, this reduces to US$4,284/acre. In value terms, after assumed 50% farm-out value dilution (ie Cuadrilla releases 50% of the value in the asset for a development cost carry), this is worth a net A$690m to AJL shareholders.
|
Exhibit 11: NPV US$m distribution (commercial success) |
|
|
■ For the commercial success case (NPV15>0) we exclude values below zero from the distribution shown in Exhibit 9 and calculate the following metrics: ■ P50 NPV15 net to AJL of US$1,654m. ■ Pmean NPV15 net to AJL of US$1,978m ■ P10 to P90 range of US$331m to US$4,065m. ■ Risked diluted P50 value of A$690m* or A$0.92/share. ■ *A$690m = 67% x US$1,654 x 1.25(fx) x 50%.** ■ **50% relates to assumed value dilution after development carry farm-out. |
|
Source: Edison Investment Research |
|
Unit NPV of risked P50 US$4,284/acre
Displaying the above NPV distribution on a unit basis provides the following $/acre distribution and values.
|
Exhibit 12: Bowland implied $/acre values (commercial success case) |
|
|
■ The mean implied unrisked US$/acre value from our analysis is US$7,675/acre with P50 of US$6,418/acre. ■ This only assumes positive values for $/acre, ie a commercial success case. ■ Including a commercial success risking of 67%, this drops to P50 US$4,284/acre. Reducing again by 50% to reflect potential farm-out dilution, this falls to US$2,142/acre. ■ Edison’s calculated unit value range and P50 value is comparable to historical UK shale transaction values. |
|
Source: Edison Investment Research |
|
Valuation sensitivities – type curve a key driver
Exhibit 13 below provides an insight into key valuation sensitivities. IP rate, EUR, gas price and well cost are key sensitivities. The sensitivity tornado shows the impact on our unrisked P50 UK shale valuation when the top and bottom 10% of our input distributions are used in our valuation. This demonstrates that given the known uncertainty ranges for key inputs the most sensitive factor from a valuation perspective is IP rate with low initial rate scenarios driving negative NPVs. We believe that Cuadrilla’s upcoming appraisal programme at Preston New Road will reduce uncertainty on IP rate and EUR providing for a tighter valuation range.
|
Exhibit 13: Key sensitivities to NPV distribution US$m – sensitivity bounded by top/bottom 10% point values from assigned input distributions (ranked by effect on output P50) |
|
|
■ Based on assigned distributions, the key sensitivities for NPV are well IP rate, EUR, gas price and well cost. ■ We expect uncertainty over IP rate to be reduced on conclusion of Preston New Road flow tests in early 2018. ■ Rf (ranging from 3% to 13%) is less of a driving factor over our modelling period out to 2050. ■ Negative values shown in dark green |
|
Source: Edison Investment Research |
|
Exhibits 14 and 15 show all of the modelled scenarios and the impact of key inputs on valuation – in this case IP rate and EUR. Our analysis suggest that in generating a positive NPV15, IP rate needs to be at a minimum 5mmscfd and EUR at least 2.3bcf for a 2.5km lateral.
|
Exhibit 14: Key sensitivity IP rate |
Exhibit 15: Key sensitivity EUR |
|
|
|
Source: Edison Investment Research |
|
Exhibit 14: Key sensitivity IP rate |
|
|
Source: Edison Investment Research |
|
Exhibit 15: Key sensitivity EUR |
|
|
Source: Edison Investment Research |
Key risks and other valuation sensitivities
Key caveats that impact our probabilistic valuation:
■
Risk of change in government stance with regard to the exploitation of shale gas
■
We assume a 2 year planning cycle for well pads, however we do not see extended planning processes as a major influence on value. We assume that companies have visibility on the duration of planning processes and submit planning applications accordingly.
■
We do not assume resource limitations due to land access restrictions in our analysis over and above those applied by BGS in the society’s calculation of GIIP.
■
We assume recoverable gas per acre is homogeneous across the BGS Bowland shale prospective shale area. This could prove to be a conservative assumption as Cuadrilla is ideally located in the heart of the Bowland Basin which contains a thick upper and lower Bowland shale section – i.e. a thicker than average shale.
■
At this stage, we do not include any value for Cuadrilla’s Weald Basin licences (a further 24,600 acres). The company’s current focus is on shale activity in the North-west England/UK. We see upside here in the event that the Kimmeridge Limestone play at Horse Hill, Broadford Bridge and Holmwood proves to be commercial. Cuadrilla has planning permission to conduct a seven-day flow test at Balcombe. Cuadrilla and AJL recently announced a farm-in agreement with Angus Energy whereby Angus will pay a consideration of £4m in respect of a 25% working interest in PEDL 224 (Balcombe) licence, and will also pay for and operate the seven-day flow test, which could take place later this year. UK Oil & Gas (UKOG) estimates that the Kimmeridge Limestone play should demonstrate robust economics (un-quantified) at 50$/bbl Brent.
AJ Lucas group valuation
In addition to AJ Lucas’s net shale acreage the company has two 100% owned subsidiaries: Lucas Engineering and Construction (LEC) and Lucas Drilling Services (LDS). Whilst we use a risked based valuation for UK shale exposure (the key focus of our research), we employ a conventional valuation approach for the company’s industrial business units.
Whilst the focus of our note has been on the valuation of the group’s UK shale asset base, in this section we look at the group’s valuation incorporating Lucas Drilling and Lucas Engineering, which is classified as an asset for sale. We note that both operating business units have incurred significant volatility in earnings and EBITDA over the past five years. Our valuation takes into account the following assumptions:
■
LDS – H217 revenues saw a recovery driven by strengthening demand from the coal mining industry on the back of rising coal prices; this was reflected in H118 (to December 2017) with a 65.7% y-o-y increase in revenues and increase in EBITDA margin from 4.5% to 9.7%. Within LDS, business unit visibility is typically 6 months based on firm work with management having c.75% visibility on 12 month forward revenues. Contracts typically roll over within LDS reducing revenue and margin volatility. Leading indicators, including shipped coal tonnage from ports in New South Wales and Queensland and mining exploration metres drilled, all suggest an increase in activity levels that supports our view of sustained higher divisional margins in the medium term.
■
LEC – AJL has announced that it is assessing several non-binding proposals for the purchase of LEC and the division is reported as a discontinued operation from an accounting perspective. Given the intention to sell LEC, we value this business based on the book value of assets (A$3.5m) and also assume the unwinding of divisional receivables (we estimate c A$6m).
|
Exhibit 16: Lucas Engineering and Construction (LEC) underlying EBITDA and EBITDA margin* |
Exhibit 17: Lucas Drilling Services (LDS) underlying EBITDA margins |
|
|
|
Source: Edison Investment Research, Company data. Note: *Assumes LEC sold at end FY18. |
Source: Edison Investment Research, Company data |
|
Exhibit 16: Lucas Engineering and Construction (LEC) underlying EBITDA and EBITDA margin* |
|
|
Source: Edison Investment Research, Company data. Note: *Assumes LEC sold at end FY18. |
|
Exhibit 17: Lucas Drilling Services (LDS) underlying EBITDA margins |
|
|
Source: Edison Investment Research, Company data |
In order to value LDS we looked at suitable Australian based comparators which operate in the same segments and geography. The peer group trades at prospective EV/EBITDA multiples that have historically ranged from 6 times to 20 times depending on company specific growth rates, margins and leverage. It is difficult to pick out a strong relationship between valuation and margins or growth. However, given the current volatility in EBITDA, EBITDA margins and relatively high levels of gearing at AJ Lucas, we would expect it to trade towards the lower end of this multiple range.
|
Exhibit 18: Minimal correlation between EBITDA margins and multiples among Australian listed peers |
Exhibit 19: Minimal correlation between EBITDA multiples and revenue growth among Australian peers |
|
|
|
Source: Edison Investment Research. Note: Peer group includes MND, CDD, CIM, WOR, NWH, WTP, RCR, MAH, DCG, GNG, APA. |
Source: Edison Investment Research. Note: Peer group includes: MND, CDD, CIM, WOR, NWH, WTP, RCR, MAH, DCG, GNG, APA. |
|
Exhibit 18: Minimal correlation between EBITDA margins and multiples among Australian listed peers |
|
|
Source: Edison Investment Research. Note: Peer group includes MND, CDD, CIM, WOR, NWH, WTP, RCR, MAH, DCG, GNG, APA. |
|
Exhibit 19: Minimal correlation between EBITDA multiples and revenue growth among Australian peers |
|
|
Source: Edison Investment Research. Note: Peer group includes: MND, CDD, CIM, WOR, NWH, WTP, RCR, MAH, DCG, GNG, APA. |
The focus of this note is on UK shale valuation, and given the margin and revenue volatility in LDS and LEC we use a relatively simplistic but conservative approach to valuation of these operating business units. We apply a 6x multiple to three-year average underlying EBITDA for LDS (FY18-20) after overheads equating to an EV of A$34m (c 5% of our group valuation). We expect to revise this valuation once there is further revenue visibility and stability in margins. We see potential for a higher valuation in the event of a trade sale as potential buyers could strip out corporate overheads and listing costs when deriving LDS underlying EBITDA.
P50 (mid-case) group valuation
Our sum of the parts (SOTP) group valuation incorporates a risked P50 commercial success case UK shale valuation, a deduction for UK shale overheads, balance sheet adjustments and valuation of LEC and LDS as described above. This equates to a group valuation of A$0.86/share, as described in Exhibit 20 below.
Exhibit 20: AJL SOTP valuation
Recoverable reserves |
|
Net risked |
Value per share |
|||||
Asset |
Country |
Diluted WI |
CoS |
Gross |
Net |
NPV/mcf |
value |
Risked |
|
|
% |
% |
bcf |
bcf |
A$/mcf |
A$m |
A$/share |
Net (debt) at end 2018e pre fund-raise and asset sale |
100% |
(114) |
(0.15) |
|||||
A$51.2m net fund-raise proceeds |
100% |
51 |
0.07 |
|||||
UK SG&A - NPV10 of 2yrs |
UK |
100% |
(4) |
(0.01) |
||||
Lucas E&C Book value and receivable unwind |
Australia |
100% |
10 |
0.01 |
||||
Lucas Drilling Services 4x 3yr avg EBITDA |
Australia |
100% |
34 |
0.05 |
||||
Lucas net UK shale appraisal costs after Centrica carry |
UK |
100% |
(20) |
(0.03) |
||||
Net UK shale valuation P50* |
UK |
50% |
67% |
10,446 |
2,279 |
0.45 |
690 |
0.92 |
Valuation |
|
|
|
|
|
|
647 |
0.86 |
Source: Edison Investment Research. Note: *Based on risked P50 NPV output from probabilistic model.
Funding of ongoing shale gas commitments and interest expense
Funding of AJL’s ongoing UK shale capex commitments and associated interest expense is a key investment consideration. We expect net cash flow from Lucas’s operating businesses to make a small contribution towards cash outflows to fund shale activity. However we expect the bulk of this funding to be driven by a combination of equity and debt. The cost of this equity and or debt will likely be driven by the success of AJL’s exploration activity at Preston New Road. In our model we assume that debt maturing in 2019, and short-term cash calls will be financed through debt bearing interest at 18% reducing to 15% in the medium term. We note that current subordinated debt facilities do not have traditional debt covenants, however, there is an 8x leverage test and 1x interest coverage test, calculated on the 12-month trailing financial performance of the group’s Australian operations – the next test is on 30 September 2018. Lending terms are likely to be more onerous if results at Preston New Road prove to be inconclusive or negative.
|
Exhibit 21: AJL operating cash flows, cash interest, UK shale net capex and cash burn |
|
|
Source: Edison Investment Research |
Financials
AJL financials include consolidated accounts for LEC (discontinued operations) and LDS (continuing operations) and those of Cuadrilla (47.4% owned) as an equity accounted investee. The bulk of revenues and operating profit is driven by LDS over the forecast period to 2020. The financials below include minimal input from our UK shale model which only assumes commencement of commercial production from 2020, however we do include AJL net spend (post carry) on UK shale exploratory/appraisal activity or shale-related overheads.
Earnings – driven by LDS in short term
Financials are largely driven by AJ Lucas’s Australian operating business units in the short-term (through to 2020). However group earnings are dragged down by the impact of UK related overheads and financial expense related to UK shale operations. We do not see shale operations having a materially positive impact on earnings until 2020 at the earliest.
Cash flow – further funding likely required
We note that AJL remains free cash flow negative (post capex) over the short term forecast period hence repayment of debt from cash flow prior to current maturity is unlikely. We assume that either debt is extended or converted in to equity. As shown in Exhibit 21, we expect further capital to be required to continue to fund shale gas appraisal activity beyond 2019. Once shale commercialisation is underway, the company’s cash flow profile will depend on a number of factors including the pace of drilling and well pad economics. Once the market has greater certainty over well pad economics we would expect AJ Lucas to consider farm-down or sale of its shale gas assets in order to fund commercialisation. We note that historic transactions have been conducted at and above our P50 risked diluted shale unit value of US$2,142/acre.
Balance sheet – strong support from shareholders
AJ Lucas currently has in place several debt facilities including subordinated debt from its largest shareholder, Kerogen, and a senior loan note. These facilities come at a price with interest charges ranging from 16% to 18%. If AJ Lucas is able to demonstrate attractive and repeatable well economics at PNR, we would expect the group’s cost of capital to come down materially. As it stands, shareholders need to be aware of interest charges and the potential for equity dilution if loan holders convert to equity. Historically, debt has only been converted to equity by Kerogen to take up its rights under an entitlement offer. As such, this would not lead to dilution providing that an investor also participates for its pro rata entitlement in such a capital raise.
Exhibit 22: Debt instruments
Debt instrument |
Amount outstanding* |
Maturity |
Rate |
|
Kerogen Tranche 2 Subordinated (US$) |
US$28.2m |
Dec-19 |
16% initially increasing to 18% from June 2018 |
|
Senior Loan note Senior Secured (US$) |
US$31.4m |
Jun-19 |
18% paid 12% quarterly and 6% accruing until termination |
Source: Edison Investment Research. Note: Kerogen is AJL’s largest shareholder. *Carrying amount including interest bearing liability.
In February 2018, AJ Lucas placed a total of 70.5m shares to new and existing shareholders, raising a total of A$21.6m of net proceeds as well as a one-for-six entitlement offer, which raised A$29.6m after costs. Proceeds were used to reduce senior loan notes and outstanding Kerogen debt, and will be used to fund ongoing UK shale investment commitments, as well as working capital.
An amendment to the senior loan note includes a commitment to reduce the principal to US$20m by 30 September 2018, with the balance to be repaid by 22 July 2019. This repayment schedule is to be met through entitlement offer cash proceeds, the potential sale of AJ operating business units and/or other initiatives.
Exhibit 23: Financial summary
|
|
A$m |
2015 |
2016 |
2017 |
2018e |
2019e |
2020e |
June |
|
|
IFRS |
IFRS |
IFRS |
IFRS |
IFRS |
IFRS |
PROFIT & LOSS |
||||||||
Revenue |
|
|
148 |
126 |
123 |
122 |
97 |
99 |
Cost of Sales |
(127) |
(105) |
(121) |
(118) |
(88) |
(90) |
||
Gross Profit |
21 |
21 |
1 |
4 |
9 |
9 |
||
EBITDA before equity accounted investees |
(2) |
4 |
(6) |
(3) |
3 |
5 |
||
Underlying EBITDA* |
|
9 |
15 |
(4) |
0 |
6 |
6 |
|
Operating Profit (before amort. and except.) |
(22) |
(11) |
(12) |
(9) |
2 |
4 |
||
Intangible Amortisation |
0 |
0 |
0 |
0 |
0 |
0 |
||
Exceptionals |
0 |
0 |
0 |
0 |
0 |
0 |
||
Other / P&L equity accounted investees |
1 |
(7) |
(3) |
(2) |
(2) |
56 |
||
Operating Profit |
(21) |
(17) |
(15) |
(12) |
(0) |
60 |
||
Net Interest |
(24) |
(2) |
(24) |
(14) |
(14) |
(14) |
||
Profit Before Tax (norm) |
(47) |
(13) |
(36) |
(24) |
(12) |
(10) |
||
Profit Before Tax (FRS 3) |
(45) |
(19) |
(39) |
(26) |
(14) |
45 |
||
Tax |
0 |
0 |
0 |
0 |
0 |
0 |
||
Profit After Tax (norm) |
(45) |
(19) |
(39) |
(26) |
(14) |
45 |
||
Profit After Tax (FRS 3) |
(45) |
(19) |
(39) |
(26) |
(14) |
45 |
||
Average Number of Shares Outstanding (m) |
267.4 |
395.0 |
585.0 |
749.9 |
749.9 |
749.9 |
||
EPS - normalised (A$/share) |
(0.17) |
(0.05) |
(0.07) |
(0.03) |
(0.02) |
0.06 |
||
EPS - normalised and fully diluted (A$/share) |
(0.17) |
(0.05) |
(0.07) |
(0.03) |
(0.02) |
0.06 |
||
EPS - (IFRS) (A$/share) |
|
(0.02) |
(0.00) |
(0.01) |
(0.00) |
(0.00) |
0.01 |
|
Dividend per share (p) |
0.0 |
0.0 |
0.0 |
0.0 |
0.0 |
0.0 |
||
Gross Margin (%) |
14.2 |
16.9 |
1.1 |
3.4 |
9.5 |
9.5 |
||
EBITDA Margin (%) |
-1.3 |
3.4 |
-4.8 |
-2.7 |
3.3 |
5.5 |
||
Operating Margin (before GW and except.) (%) |
-15.0 |
-8.4 |
-9.9 |
-7.7 |
1.9 |
4.1 |
||
BALANCE SHEET |
||||||||
Fixed Assets |
|
174 |
164 |
164 |
164 |
167 |
223 |
|
Intangible Assets |
17 |
18 |
21 |
21 |
21 |
21 |
||
Tangible Assets |
53 |
39 |
38 |
40 |
46 |
46 |
||
Investments |
104 |
106 |
105 |
103 |
100 |
156 |
||
Current Assets |
|
58 |
66 |
77 |
71 |
55 |
48 |
|
Stocks |
13 |
16 |
31 |
31 |
31 |
31 |
||
Debtors |
27 |
26 |
22 |
16 |
16 |
16 |
||
Cash |
16 |
23 |
22 |
22 |
7 |
0 |
||
Other |
1 |
1 |
1 |
1 |
1 |
1 |
||
Current Liabilities |
|
(54) |
(70) |
(35) |
(35) |
(35) |
(35) |
|
Creditors |
(50) |
(36) |
(34) |
(34) |
(34) |
(34) |
||
Short term borrowings |
(4) |
(35) |
(1) |
(1)** |
(1) |
(1) |
||
Long Term Liabilities |
|
(98) |
(72) |
(107) |
(78) |
(80) |
(84) |
|
Long term borrowings |
(75) |
(71) |
(106) |
(77)** |
(79) |
(83) |
||
Other long term liabilities |
(23) |
(1) |
(1) |
(1) |
(1) |
(1) |
||
Net Assets |
|
|
79 |
87 |
98 |
121 |
107 |
153 |
CASH FLOW |
||||||||
Operating Cash Flow |
|
(13) |
(25) |
(27) |
(9) |
(8) |
(9) |
|
Net Interest |
0 |
0 |
0 |
0 |
0 |
0 |
||
Tax |
0 |
0 |
0 |
0 |
0 |
0 |
||
Capex |
0 |
(7) |
(13) |
(9) |
(7) |
(2) |
||
Acquisitions/disposals |
0 |
0 |
0 |
0 |
0 |
0 |
||
Financing |
(0) |
5 |
15 |
49 |
0 |
0 |
||
Dividends |
0 |
0 |
0 |
0 |
0 |
0 |
||
Net Cash Flow |
(13) |
(26) |
(25) |
31 |
(15) |
(11) |
||
Opening net debt/(cash) |
34 |
63 |
83 |
85 |
56 |
73 |
||
HP finance leases initiated |
0 |
0 |
0 |
0 |
0 |
0 |
||
Other |
(16) |
6 |
23 |
(2) |
(2) |
0 |
||
Closing net debt/(cash) |
|
63 |
83 |
85 |
56 |
73 |
84 |
|
Source: Company accounts, Edison Investment Research. Note: *Underlying EBITDA includes LEC to end FY18 and is before UK shale overheads, one-off costs and impact of asset sales. **Assumes maturing debt is refinanced using new debt instruments.
Management
Phil Arnall – non-executive director and chairman
Mr Arnall has had a distinguished 30-year career in the mining and steel industries including senior executive responsibility at Smorgon Steel Group, Tubemakers and ANI Limited. Mr Arnall is currently a non-executive director of Bradken. Directorships of other listed companies over the past three years: Ludowici and Macquarie Generation. Mr Arnall is a member of the company’s Audit and Risk and Remuneration committees.
Austen Perrin – CFO
Austen Perrin was appointed as the company’s chief financial officer in December 2014. Prior to joining AJ Lucas, Austen was the chief financial officer for Whitehaven Coal for over five years. He also previously held the group CFO roles with Asciano and Pacific National and was an executive director and divisional CFO of the listed Toll NZ as well as holding various senior finance roles within the Toll Holdings group and TNT. Mr Perrin has considerable knowledge of transport, infrastructure and the mining industries and has in depth experience across commercial, accounting and the finance spectrums. Prior to that he started his career with KPMG.
Francis Egan – Cuadrilla CEO
Francis has extensive experience in exploration & production, most recently as president of the Global Production division of BHP Billiton Petroleum. At BHP he has also held numerous leadership roles in the UK, US, Australia, Pakistan and Algeria.
Brett Tredinnick – Chief Operating Officer
Mr Tredinnick has been with company for 18 years. Prior to joining AJ Lucas Brett held various leadership and Project Management roles with Rio Tinto Coal and BHP Steel. Brett has lead the growth of the Drilling Division since its inception.
Appendices
Appendix 1: UK shale overview
Thick organic rich Carboniferous shales extend across Europe from Poland in the east and through The Netherlands and the Southern North Sea to the Irish Sea in the west. This Namurian basin is present onshore in the UK in several basins in Northern England and Southern Scotland. Many conventional fields have produced gas across Europe with these Carboniferous shales as source rock, but shale drilling in the UK has been concentrated in the western portion of the Bowland sub-basin in Lancashire, one of a number of rift basins formed by crustal extension in the UK between late Devonian/Dinantian times.
BGS estimates suggest material gas in place
The Bowland Basin is one of the largest basins in the area and continues westwards beneath the East Irish Sea, where conventional gas fields Hamilton, Douglas and Lennox have produced c 4-5 TCF to date. The key stratigraphic interval within the basin is the Bowland-Hodder shale, which extends across a large area of central Britain and is of Visean to early Namurian age. The gas bearing shale section is in excess of 6,000ft and is intensely naturally fractured. BGS/DECC estimated in 2013 that the Bowland –Hodder unit contains P50 gas in place of 1329 TCF.
|
Exhibit 24: Regional setting of Bowland basin, PEDL 165 (Cuadrilla operated) shaded red |
|
|
Source: Cuadrilla, modified from Fraser and Gawthorpe (2003) |
The Bowland-Hodder is made up of the Upper Bowland, Lower Bowland and Hodder Mudstone. The Upper Bowland consists of laterally continuous, organic rich zones dominated by clastic deposits with occasional thin sandstones and dolomitized limestones. The Lower Bowland is much thicker and is a highly variable formation comprising a wide range of lithologies, with calcareous mudstones, siltstones and sandstones being relatively abundant. Fewer wells have been drilled into the Lower Bowland, so that its regional continuity is unclear. In its 2013 Carboniferous Bowland Shale Gas Study, BGS/DECC assigned 264 TCF to the Upper Bowland and the remaining 1065 TCF to the lower unit.
|
Exhibit 25: Schematic cross-section of northern Bowland Basin |
|
|
Source: Cuadrilla, modified from Waters and Davies, 2006 |
Regional faulting and aquifers
The Carboniferous rocks are overlain by Permo-Triassic sediments. The Manchester Marl in the Permian is effectively a Zechstein sequence that forms a regional seal between the Carboniferous and the shallow water aquifers in the Sherwood Sandstone Group (SSG). Within Cuadrilla’s PEDL 165 licence, the UK Environment Agency has assessed the water in the SSG to the west of the Woodsfold Fault to be highly saline and therefore undrinkable, based on water samples from the Kirkham geothermal test hole. To the east of the Woodsfold Fault, the water in the SSG is fresh and considered to be the second most important groundwater aquifer in England after the Chalk. Cuadrilla views the risk of aquifer contamination as low - the depth of the interval to be fracked is several thousand feet below existing aquifers.
Faulting in the basin tends to a follow NE –SW trend. Within Cuadrilla’s PEDL 165 licence area the key faults are the Woodsfold fault and the Thistleton Fault. The Woodsfold fault is a major N-S fault with displacements up to 6,000ft in the Permian and Sherwood Sandstone and was the eastern boundary of the Elswick Graben in Permian times. The western boundary of the Elswick Graben is formed by the smaller Thistleton fault, which stops at the Permian anhydrite. The Thistleton fault sits around 3.5km to the east of Cuadrilla’s 2010 well, Preese Hall-1, while the Woodsfold fault is 9.4km from Preese Hall-1. A second type of faulting exists within the Bowland Shale, which is known to be heavily fractured and faulted, however these faults are relatively small and are contained within the Bowland (Exhibit 24).
|
Exhibit 26: Reprocessed seismic showing the location of the Thistleton fault in relation to Preese Hall-1 |
|
|
Source: de Pater and Baisch, Geomechanical Study of Bowland Shale Seismicity 2011 |
Comparison of US and UK shale basins
Shale basins in the UK are significantly smaller in area relative to their North American counterparts, but tend to be much thicker. In addition, North American shale regions are simple continuous structures, while the UK basins are structurally more complex, consisting of small fault bounded basins that can be significantly faulted. The entire prospective area of the Bowland – Hodder shale was assessed by BGS/DECC to cover c 14,000km2, athlough this area also includes the Blacon, Gainsborough, Widmerpool, Edale and Cleveland basins in addition to the Bowland. Although shale thickness is greater in the UK basins, this can vary over relatively short distances, in contrast to US shale play thickness which is uniform over large distances. The Bowland Basin is considered to be most analogous to the Barnett, Marcellus and Fayetteville shales in the US.
Exhibit 27: UK versus US analogues
Play |
Depth (ft) |
Thickness (ft) |
Area (mi2) |
Bowland –Hodder play |
5,200 – 10,700 |
Up to 6,000 |
5,405 |
Barnett |
4,000 – 8,000 |
50-1,000 |
9,000 |
Marcellus |
2,000 – 10,000 |
Up to 660 |
75,000 |
Fayetteville |
1,500 – 6,500 |
50-550 |
5.853 |
Source: Edison Investment Research
Techniques for successfully drilling and stimulating shale gas wells have evolved across the US largely on a trial and error basis. While the UK shale plays will benefit from these advances in technology, operators will still need to go through a learning curve of their own to optimise results. Under the terms of its licence to drill in the Bowland, Cuadrilla has had to specify the chemicals and the volumes to be used prior to drilling the wells and this cannot be changed during the current drilling programme. By contrast, in the US, companies can alter these parameters once the well has been drilled and data has been gathered, allowing the flexibility to be reactive to well results in designing optimal fracking programmes.
The US experience also highlights that there can be a substantial difference between high and low producing wells within a play. Exhibit 28 shows observed production curves from the Barnett shale, where the top 20% of field production is driven by 7% of the wells. High producing wells are thought to be those where the fracture stimulation successfully connects to a pre-existing fracture network. In the UK it may take some time and experience to be able to tap into these higher producing sweet spots.
|
Exhibit 28: Barnett shale observed production curves, 2006-15 |
|
|
Source: The shale gas revolution: Barriers, sustainability and emerging opportunities by Middleton, Gupta, Hyman, Viswanathan |
Criteria for shale gas commercial success
The criteria required to define a successful shale gas play have been developed by the USGS in relation to the analogous shale gas plays in the US. These criteria are divided into those that are considered essential, and those that are desirable.
Exhibit 29: Successful shale gas play criteria
Minimum requirements |
Desirable characteristics |
Total organic content (TOC) > 2% |
High gamma-ray values in shale |
Kerogen Type Type I,II or IIS |
Hydrogen index > 250mg/g |
Vitrinite reflectance (Ro) > 1.1% (thermal maturity) |
Depth > 5000ft |
Net thickness > 50ft |
Not intensely structured |
Gas must be thermogenic |
Overpressured |
Minimum requirements |
Total organic content (TOC) > 2% |
Kerogen Type Type I,II or IIS |
Vitrinite reflectance (Ro) > 1.1% (thermal maturity) |
Net thickness > 50ft |
Gas must be thermogenic |
Desirable characteristics |
High gamma-ray values in shale |
Hydrogen index > 250mg/g |
Depth > 5000ft |
Not intensely structured |
Overpressured |
Source: USGS
On this basis, initial indications are promising for a successful shale gas play in the Bowland Shale. As seen in Exhibit 8, the Bowland shale is of a thickness and depth to satisfy the criteria, while results from the first shale gas well in the Bowland Basin, Preese Hall-1, have demonstrated that the Bowland Shale is thermally mature for gas. The total organic content (TOC) has been found to vary through the stratigraphy, with the highest values found within the Bowland Shale. The average TOC was 2.65% with a range of 1% to 7% in the cored intervals. The data on kerogen type is less clear. The presence of humic material indicates Type III, however Type I/II is implied at the top of the sampled section. The Bowland is more intensely structured than the shale plays in North America, however the presence of 3D seismic over 100km2 of PEDL 165 will allow wells to be drilled away from existing faults. A key desirable characteristic that is not currently known is the level of overpressure, if any, that exists in the Bowland. The minerology of the Lancashire Bowland shale has been analysed using x-ray diffraction of shale core samples from the Preese Hall well, and has confirmed that both the Upper and Lower Bowland shales are well suited to hydraulic fracturing. This is due to the highly siliceous matrix and low overall clay content. Cuadrilla recently retained consultancy Anderson Thompson to produce a probabilistic-type curve for the Bowland shale based on available data and the consultancy’s specialist knowledge of the Permian, Eagle Ford, Bakken, Marcellus and Montney shale in North America. The result of this analysis is shown in Exhibit 30, with the predicted P50-type curve for a 2.5km horizontal well. We use this type curve as well as the P10 and P90 range associated with this curve in our probabilistic UK shale valuation.
|
Exhibit 30: Anderson Thompson modelled potential gas recovery from 2.5km Bowland horizontal well |
Exhibit 31: Minerology of Lancashire Bowland shale |
|
|
|
Source: Cuadrilla |
Source: Cuadrilla |
|
Exhibit 30: Anderson Thompson modelled potential gas recovery from 2.5km Bowland horizontal well |
|
|
Source: Cuadrilla |
|
Exhibit 31: Minerology of Lancashire Bowland shale |
|
|
Source: Cuadrilla |
Licences and well data
AJ Lucas’s net acreage in the Bowland shale totals 1,043 km2, making the company one of the largest Bowland acreage holders. This figure includes AJ Lucas’s 47.4% of Cuadrilla’s net acreage and AJL’s direct licence interests.
|
Exhibit 32: Operated gross shale acreage (top 10) |
|
|
Source: Edison Investment Research, OGA |
PEDL 165 – historical exploration and appraisal activity
Cuadrilla holds interests in licences covering 2,391km2 (256,000 acres) gross in the Bowland shale, making it a significant operator in the region, together with INEOS and IGas, which each hold operated licence areas over 2,000km2. Cuadrilla’s activity to date has focused on PEDL 165 and the company is currently drilling here at the Preston New Road site. PEDL 165 covers 1200km2 and was acquired by Cuadrilla in 2008. Several wells had previously been drilled within in the licence area: Thistleton-1, Hesketh-1, Banks-1 and Elswick-1. Elswick-1 has been producing gas from a hydraulically fractured sandstone for 20 years, however Thistleton-1 was the only one of these wells to have been drilled into the Lower Bowland shale.
|
Exhibit 33: Bowland licence map |
|
|
Source: UK Oil and Gas Authority (copyright), Cuadrilla |
In 2010 and 2011, Cuadrilla drilled three vertical shale gas exploration wells. The first of these was Preese Hall-1, which was located near Thistleton-1 as this provided good geological control. Preese Hall-1 was the first and only well to produce shale gas in the UK and provided the first proof of concept that the Bowland Shale could be fractured and produce gas. The remaining two wells, Grange Hill-1Z and Becconsall-1 were drilled and cored in 2011. Becconsall-1, to the south of Preese Hall-1, drilled the fullest shale section. A further well, Anna’s Road-1 was abandoned at 2000ft due to drilling problems. The thickest shale section encountered was of 3,500ft in Grange Hill-1, however the thickness varies across the wells with around a 20% - 30% difference seen in Upper and Lower Bowland shale thicknesses over distances of three to four miles. In comparison, shale thicknesses in the US are uniform over large distances.
|
Exhibit 34: Historical wells neighbouring PNR |
Exhibit 35: PEDL 165 3D seismic coverage |
|
|
|
Source: UK Oil and Gas Authority (copyright) |
|
Exhibit 34: Historical wells neighbouring PNR |
|
|
Source: UK Oil and Gas Authority (copyright) |
|
Exhibit 35: PEDL 165 3D seismic coverage |
|
|
Source: UK Oil and Gas Authority (copyright) |
Preese Hall-1: demonstrated gas flow to surface
Preese Hall-1 was drilled to 9,100ft and completed between August and December 2010. A total net thickness of 2411ft of shale was encountered and twelve zones were selected for fracking. Five shale zones were fracked individually with a sand/water slurry, each separated by bridge plugs. The water volumes used ranged between 4780bbls and 14,120bbls with proppant masses of between 52 and 117 metric tons. Initial flow rates from the first three fracture stimulations were reported to be 400-500mcf/day comingled, it is worth noting that this rate was achieved from relatively small fracs over just three zones in the Preese Hall-1 vertical well. During the fracture stimulation programme, two seismic events were observed after treatment stages 2 and 4, and as a result of this the programme was curtailed. With limited flow data, it was not possible to establish commerciality from Preese Hall-1, however the well did prove that gas can be produced to surface from the Bowland Shale. An 18 month suspension was put in place while the cause of the tremors was investigated and rules for future mitigation were developed. The events were of a magnitude of 2.3ML and 1.5ML, with 48 much weaker events also detected. In US shale plays, fracture treatments of a similar size have yielded events of lower magnitudes, up to 0.8 ML, and there are only two documented cases of stronger events, of magnitude 1.9 ML and 2.8 ML, from massive hydrofrac treatments in South Central Oklahoma, so that the events experienced in Preese Hall-1 are considered to be unusual.
Cuadrilla commissioned an independent study to examine the causes of the events. The report concluded that the most likely cause of the seismicity was the direct injection of fluid into the same fault zone. The study estimated that the worst case maximum seismic event magnitude would be 3 ML, a level that is considered too small to cause structural damage at surface level and comparable to the passing of a truck (note that seismicity in the UK induced by coal mining is up to a magnitude of 4 ML). In addition the study found that fracture fluid would not leak into the shallow aquifer system, due to the presence of the thick impermeable Bowland Shale and overlying Permian anhydrites.
In December 2012, a new regulatory regime was implemented by DECC incorporating the results and recommendations of a government-commissioned report from The Royal Society and the Royal Academy of Engineering together with the Cuadrilla study. The new regime includes the requirement for seismic monitoring of each well site area and a system under which operations are halted if seismicity reaches a level greater than 1.7 ML (Operation has to stop if 1.7 is exceeded, the well bled off and then the seismicity monitored until zero events for at least 10 days, then the operation can recommence, otherwise the operation has to be aborted and the seismic risk re-evaluated)
Preston New Road: first lateral wells to be fracked in the UK
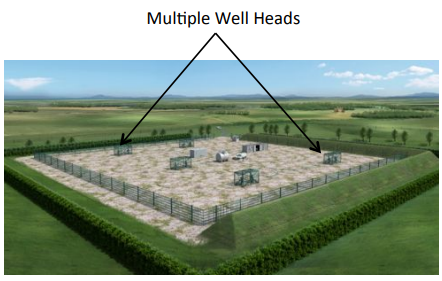
To progress the concept of shale gas production in the UK, Cuadrilla plans to demonstrate that lateral wells can be drilled and fracked in the Bowland Shale. If successful, this would allow development of the Bowland from a resource hub, ie a multiwell pad from which several horizontal wellbores can be drilled into the target formation while minimising the surface impact and costs. Development wells would be stacked lateral wells with length and spacing dependant on rock properties, although the well length is expected to be between 3,000ft – 6,000ft. The ability to drill horizontal wells into different stratigraphic intervals from a single pad is made possible by the presence of much thicker shale intervals in the Bowland compared to those encountered in the US.
|
Exhibit 36: 3D Visualisation of multiple wells drilled in one orientation |
Exhibit 37: Illustration of surface impact (Site approx. 2 football pitches) |
|
|
|
Source: Cuadrilla |
Source: Cuadrilla Note: Site roughly equivalent to two football pitches |
|
Exhibit 36: 3D Visualisation of multiple wells drilled in one orientation |
|
|
Source: Cuadrilla |
|
Exhibit 37: Illustration of surface impact (Site approx. 2 football pitches) |
|
|
Source: Cuadrilla Note: Site roughly equivalent to two football pitches |
Cuadrilla has planning permission to drill up to four horizontal wells from its Preston New Road (PNR) location in the Fylde, Lancashire. The location has been chosen in an area with the best well control and where there is a high confidence of the subsurface stratigraphy and structure from the 100km2 3D seismic survey acquired in 2012.
The company commenced drilling a vertical well at PNR in August 2017. The well will drill through the Upper and Lower Bowland and into the Hodder Mudstone and will be cored and logged. The drilling is expected to take around two months. Based on the data gathered from the well, Cuadrilla will then choose where to position two horizontal wells. The horizontal laterals may target the same or different levels within the Bowland and will be 1000m long. Once both horizontal wells have been drilled, they will be hydraulically stimulated with 45 stages per well.
|
Exhibit 38: Indicative timeline for PNR appraisal |
|
|
Source: AJ Lucas |
The operation will be monitored by eight surface seismic stations and 4 water monitoring wells to allow effective monitoring of any seismicity, in line with the new regulatory regime. Downhole monitoring will be carried out to monitor the location, orientation and extent of the induced fractures. Each well will then be flow tested for up to 90 days. This initial test may be followed by an Extended Well Test (EWT) which would likely last for 18 to 24 months and would allow Cuadrilla to gather longer term production data, particularly decline rates, so that future well performance can be predicted. The drilling of two further horizontal wells would depend on the results of the data gathered from the initial two horizontals.
Drilling will continue for 24 hours per day as in normal drilling operations, however fracking will be limited to daytime only, ie 7am to 7pm. Cuadrilla expects drilling to be completed during the first half of 2018 and initial flow test results to be available during Q418.
In June 2013, Cuadrilla sold a 25% interest in the Bowland and Elswick prospects to Centrica. Consideration included a farm-in arrangement, with a financial ‘carry’ on future appraisal and development expenditure.
Centrica is currently obligated to fund a further £46.7m for appraisal and development in the Bowland tenement, subject to certain milestones being met. The contingent carry was recently amended such that the milestone for commencement is the flow testing of gas for six months, and AJL expects this contingent carry to be exercised by Centrica on successful flow of gas from the first two wells.
Appendix 2: Key input distributions for Edison’s probabilistic UK shale model
As with all probabilistic models it is important to ensure that uncertainty distributions for model inputs are robust. This can involve the fitting of distributions to historical data sets, use of analogues or industry best practice. In our analysis, we have material strong data support for our chosen distributions for most inputs. These inputs and our chosen distributions are outlines below:
Distributions and data support for analysis
|
Exhibit 39: Probabilistic type curve |
|
|
■ Distribution support: Our probabilistic type curve is supported by a study conducted consultancy Anderson Thompson in 2017. The consultancy’s specialist knowledge of the Permian, Eagle Ford, Bakken, Marcelles and Montney shale in North America are used to predict a P50 type curve for a 2.5km horizontal in the Bowland. ■ Distribution parameters: IP rate and EUR P10 to P90 ranges and probabilistic type curve definition |
|
Source: Edison Investment Research |
|
|
Exhibit 40: GIIP |
|
|
■ Distribution support: Our distribution for Bowland shale GIIP is driven by BGS’s 2013 study “The Carboniferous Bowland Shale gas study: geology and resource estimation”. This study defines GIIP distributions for the Upper and Lower Bowland Hodder units. ■ Distribution parameters: P10, P50 and P90 values and distribution based on BGS data. |
|
Source: Edison Investment Research |
|
|
Exhibit 41: Recovery factor |
|
|
■ Distribution support: We use minimum , maximum and mean value for recovery factors based on extensive data available from both the Marcelles and Barnett shales. ■ Distribution parameters: Pert distribution with maximum value of 13% and minimum of 3% as per US dry gas shale analogues. (Barnett c 6%, Fayetteville c 11%, Haynesville c 3% and Marcelles c 10%). |
|
Source: Edison Investment Research |
|
|
Exhibit 42: Well cost distribution |
|
|
■ Distribution support: For well cost we use US data for individual cost components including rig, casing, proppant and wages and adjust accordingly to reflect scarcity of supply in the UK and UK wages. Our estimate range is our best estimate of through cycle well costs, however we recognise that these may vary over time as the service sector adapts to activity levels. ■ Distribution parameters: Triangular distribution based on US minimum and maximum well cost data adjusted for UK rig and service availability. Regeneris Consulting estimated a well cost of £11m in 2011. Edison estimates median well cost of US$17.4m over field life for a 2.5km lateral but incorporate a wide uncertainty range at this stage. |
|
Source: Edison Investment Research |
|
|
Exhibit 43: Long term gas price distribution |
|
|
■ Distribution support: We use a Black’s model to derive a gas price distribution for 1 year forward summer low and winter high gas prices using the implied volatility of forward contracts. An average of these values drives our average long term gas price. This is then inflated by 2% for future estimates of gas price. P50 45.8p/therm; Mean value 46.4p/therm. ■ Distribution parameters: Our gas price distribution is based on traded forward contracts for 2018 and 2019. Detailed UK gas supply / demand analysis was beyond the scope of this report. |
|
Source: Edison Investment Research |
|
Additional outputs
|
Exhibit 44: Gross production scenarios modelled |
|
|
■ The modelled production profile for gross acreage field model is shown here including P50, P10, P90 high and low scenarios. ■ Production tails off in the final year as we assume no wells are drilled in 2050 the final year of our cash flow model. Wells drilled vary by scenario, and include approximately 60-70 per annum on average in the P50 case. |
|
Source: Edison Investment Research |
|
|
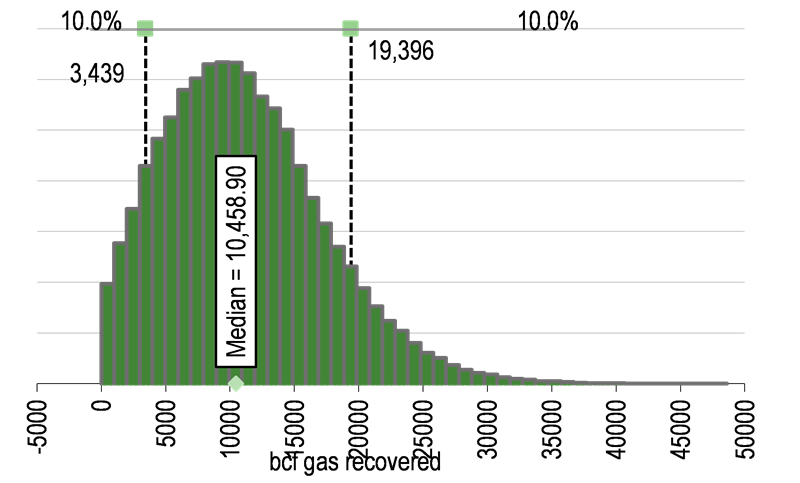
Exhibit 45: Gross Bowland gas recovery modelled |
|
|
■ The amount of gas recovered in our model has a mean of 11,069bcf and a P50 of 10,458bcf through to end 2050. ■ The P90 to P10 range is 3,439bcf to 19,396bcf. ■ At the top end gas recovery is limited by rig / service access whilst the bottom is driven by low GIIP, Rf and pessimistic type curve assumptions. |
|
Source: Edison Investment Research |
|
Service sector model inputs
|
Exhibit 46: Maximum available drilling rigs and pressure pumping skids - UK wide |
|
|
■ Distribution support: Rig availability is a significant uncertainty that is difficult to model accurately given the lack of historical data. We assume that the maximum number of rigs will vary from 10-30 rigs in the UK for the purpose of this analysis. We note that this is not a key driver of NPV assuming rig availability is more than zero and the time taken to drill and complete and shale well is in-line with industry forecasts at less than 45 days. ■ Distribution parameters: We assume a discrete, integer, uniform distribution with rig availability varying from 10 to 30 rigs. |
|
Source: Edison Investment Research |
|
|
Exhibit 47: No. of drilling rigs and pressure pumping skids added per year - UK wide |
|
|
■ Distribution support: Rig additions are a significant uncertainty that is difficult to model accurately given the lack of historical data. Limitations include the construction time for new rigs and/or the time taken to ship existing rigs in to country. Whilst a more important factor than the maximum number of available rigs, again this not a key driver of NPV assuming rig additions are more than zero. ■ Distribution parameters: We assume a discrete, integer, uniform distribution with rig additions varying from 1 to 5 a year. |
|
Source: Edison Investment Research |
|
|
|||||||||||||||||||||||||||||||||||||||||||||||
|
|
Research: Consumer
Rank’s trading update (13 weeks to 1 April) showed 17% growth in Digital, but the core Venues disappointed, with Mecca down 2% and Grosvenor down 9% on a like-for-like basis. The shortfall was largely due to fewer customer visits, as well as a lower gross win margin from VIPs. The company expects the weaker consumer environment to continue and has now guided to FY18 clean EBIT of £76-78m vs previous consensus of £83m. We have adjusted our forecasts to the lower end of guidance. The stock has dropped sharply on the news and trades at 5.7x EV/EBITDA and 11.8x P/E for CY18e, which is a meaningful discount to peers.
