Last close As at 05/08/2026
—
— 0.00 (0.00%)
Market capitalisation
—
Research: Investment Companies
Witan Investment Trust (WTAN) can be considered as a ‘one-stop shop’ for investment in global equities. Since 2004, it has employed a multi-manager strategy; there are currently 10 third-party managers, while around 10% of the trust is invested directly in specialist funds. WTAN outperformed its composite benchmark in FY19 and has now increased its annual dividend in each of the last 45 consecutive years. While global stock markets are currently under significant pressure due to the coronavirus outbreak, WTAN’s CEO and investment director are ‘optimistic’ on the prospects for equities with a medium to long-term view, while acknowledging short-term challenges. They believe that given the announced fiscal and monetary stimuli across the globe, the economic recovery, when it happens, could be quite dramatic.
Witan Investment Trust |
Diversified exposure to global equities |
Investment trusts |
16 April 2020 |
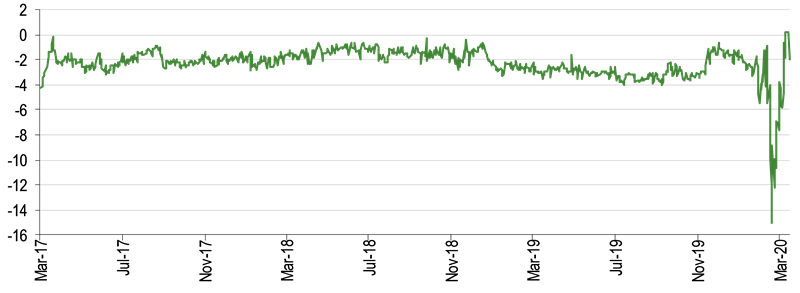
Share price/discount performance
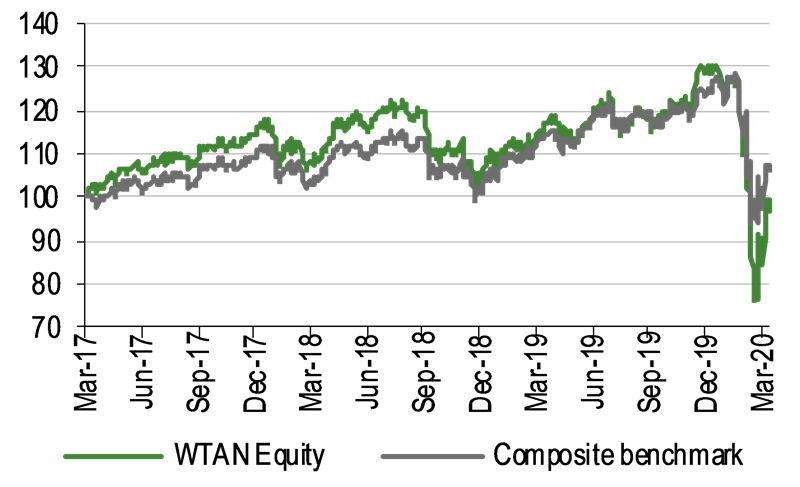
Three-year performance vs index
Gearing
Analysts
|
|||||||||||||||||||||||||||||||||||||||||||||||||||||||||||||||||||||||||||||||||||||||||||
Witan Investment Trust (WTAN) can be considered as a ‘one-stop shop’ for investment in global equities. Since 2004, it has employed a multi-manager strategy; there are currently 10 third-party managers, while around 10% of the trust is invested directly in specialist funds. WTAN outperformed its composite benchmark in FY19 and has now increased its annual dividend in each of the last 45 consecutive years. While global stock markets are currently under significant pressure due to the coronavirus outbreak, WTAN’s CEO and investment director are ‘optimistic’ on the prospects for equities with a medium to long-term view, while acknowledging short-term challenges. They believe that given the announced fiscal and monetary stimuli across the globe, the economic recovery, when it happens, could be quite dramatic.
|
Recent hit to long-term record of NAV outperformance vs the benchmark |
|
|
Source: Refinitiv, Edison Investment Research |
The market opportunity
Global stock markets have given back their gains of recent years due to the coronavirus pandemic. However, if history is a guide, significant pullbacks have provided attractive entry points for investors with a longer-term view. Examples in recent decades include the dotcom bust in 2001–02 and the global financial crisis in 2007–09.
Why consider investing in Witan Investment Trust?
■
Broad exposure to global equities, with a focus on companies with above-average growth prospects and/or attractive valuations.
■
Clearly defined investment strategy with a multi-manager approach.
■
Access to strategies that are generally unavailable to the retail investor.
■
Around 10% of the portfolio is invested directly in niche opportunities.
■
WTAN’s dividend has increased for the last 45 consecutive years.
Active share repurchase programme
WTAN is currently trading at a 2.0% discount to cum-income NAV. This compares with the 2.3% to 3.1% range of average discounts over the last one, three and five years. The board aims to ensure that the trust trades close to NAV and actively repurchases shares; in FY19, 2.8% of the share base was bought back. WTAN has a progressive dividend policy and currently offers a 3.1% yield.
Exhibit 1: Trust at a glance
Investment objective and fund background |
Recent developments |
||||||||||||||||||||||||||||||||||||||||||||||||||||||||||||||||||||||
WTAN aims to deliver long-term growth in income and capital through active multi-manager investment in global equities. Funds are currently allocated to 10 external managers, and up to 12.5% is directly invested in specialist funds and smaller, niche managers. WTAN seeks external managers with the conviction to take views that may diverge from benchmark weightings. |
■ 25 March 2020: Announcement of the early redemption of 6.125% 2025 secured bonds (see page 8). ■ 12 March 2020: Annual report ended 31 December 2019. NAV TR 21.3% versus benchmark TR 20.3%. Share price TR 22.1%. ■ 12 February 2020: Declaration of fourth interim dividend of 1.825p per share (+17.7% year-on-year). |
||||||||||||||||||||||||||||||||||||||||||||||||||||||||||||||||||||||
Forthcoming |
Capital structure |
Fund details |
|||||||||||||||||||||||||||||||||||||||||||||||||||||||||||||||||||||
AGM |
April 2020 |
Ongoing charges |
0.79% (0.87% incl. perf. fees) |
Group |
Self-managed (Witan Inv. Services) |
||||||||||||||||||||||||||||||||||||||||||||||||||||||||||||||||||
Interim results |
August 2020 |
Net gearing |
4% |
Manager |
Andrew Bell (CEO), James Hart (investment director) |
||||||||||||||||||||||||||||||||||||||||||||||||||||||||||||||||||
Year end |
31 December |
Annual mgmt fee |
See page 9 |
Address |
14 Queen Anne’s Gate, |
||||||||||||||||||||||||||||||||||||||||||||||||||||||||||||||||||
Dividend paid |
Mar, Jun, Sep, Dec |
Performance fee |
Yes (see page 9) |
||||||||||||||||||||||||||||||||||||||||||||||||||||||||||||||||||||
Launch date |
February 1909 |
Trust life |
Indefinite |
Phone |
+44 (0)20 7227 9770 |
||||||||||||||||||||||||||||||||||||||||||||||||||||||||||||||||||
Continuation vote |
No |
Loan facilities |
See pages 8 & 9 |
Website |
|||||||||||||||||||||||||||||||||||||||||||||||||||||||||||||||||||
Dividend policy and history (financial years) |
Share buyback policy and history (financial years) |
||||||||||||||||||||||||||||||||||||||||||||||||||||||||||||||||||||||
There have been 45 years of consecutive annual dividend increases. Chart adjusted for May 2019 5:1 share split. |
Renewed annually, the board has authority both to repurchase at a discount (14.99%) and allot at a premium (10%) ordinary shares. FY16 includes repurchase from Aviva. |
||||||||||||||||||||||||||||||||||||||||||||||||||||||||||||||||||||||
|
|
||||||||||||||||||||||||||||||||||||||||||||||||||||||||||||||||||||||
Shareholder base (as at 10 March 2020) |
Portfolio exposure by market cap (as at end-FY19) |
||||||||||||||||||||||||||||||||||||||||||||||||||||||||||||||||||||||
|
|
||||||||||||||||||||||||||||||||||||||||||||||||||||||||||||||||||||||
Top 10 holdings (as at 31 March 2020) |
|||||||||||||||||||||||||||||||||||||||||||||||||||||||||||||||||||||||
|
|||||||||||||||||||||||||||||||||||||||||||||||||||||||||||||||||||||||
Source: WTAN, Edison Investment Research, Bloomberg, Morningstar. Note: *N/A where not in end-March 2019 top 10. **Direct fund investments.
Market outlook: A lot of lost ground to make up
As illustrated in Exhibit 2 (LHS), the economic and emotional uncertainty wrought by the coronavirus pandemic has had a significant negative impact on the performance of both UK and global stocks; so much so, that the strong gains in recent years have been completely given back. While this is undoubtedly a very uncomfortable time for investors, those with a longer-term perspective may consider the sell-off as providing a good opportunity to add to their equity exposure. Stock market history shows that, over time, share prices have recovered from setbacks and have subsequently set new highs, as witnessed in recent decades by the 2001–02 dotcom bust and the global financial crisis in 2007–09.
In the table below, we highlight the valuation of the Datastream World index; however, we caution that these metrics may not be reflecting economic reality as corporate earnings are essentially immeasurable due to the coronavirus pandemic.
|
Exhibit 2: Market performance and valuation |
|||||||||||||||||||||||||||||||
Performance of indices in £ (last 10 years) |
Valuation metrics of DS World index (last 10 years, as at 14 April 2020) |
||||||||||||||||||||||||||||||
|
|
||||||||||||||||||||||||||||||
|
Source: Refinitiv, Edison Investment Research |
|||||||||||||||||||||||||||||||
Fund profile: Primarily a multi-manager approach
WTAN is one of the oldest UK investment trusts. It was launched in 1909 to manage the investments of Alexander Henderson (the first Lord Faringdon) and has been listed on the London Stock Exchange since 1924. While the trust was initially used to manage the assets of a single family, it now offers many thousands of investors a ‘one-stop shop’ for global investment. WTAN is managed by the executive team of Witan Investment Services (WIS), which acts as its Alternative Investment Fund Manager (AIFM). In 2004, the trust became self-managed, appointed its first chief executive and adopted a multi-manager strategy, aiming to maximise returns while reducing the performance volatility risk arising from dependence on a single manager. WTAN aims to generate long-term capital growth, while growing its dividend at a rate ahead of UK inflation. The annual dividend has increased for the last 45 consecutive years. The portfolio is diversified by geography, sector and the individual company level, thus reducing risk. Gearing of up to 20% of net assets is permitted (typically in a range of 5% to 15%, while a small cash position may be held when deemed appropriate); at 31 March 2020, net gearing was 4% (down from 12% at end-February).
The trust’s performance is measured against a composite of indices; the benchmark has evolved over time to reflect where the trust’s board and executive team believe the best opportunities lie. From 1 September 2004 to 30 September 2007 – 50% UK and 50% World (ex-UK); from 1 October 2007 to 31 December 2016 – 40% UK, 20% North America, 20% Asia Pacific and 20% Europe (ex-UK); from 1 January 2017 to 31 December 2019 – 30% UK, 25% North America, 20% Asia Pacific, 20% Europe (ex-UK) and 5% Emerging Markets; and since 1 January 2020 – 15% UK and 85% World (including UK). The effective UK benchmark weight will be approximately 19%. WTAN’s CEO Andrew Bell explains that global trusts traditionally had a high domestic weighting as the UK market offered a higher dividend yield than overseas markets, provided access to global revenues from a UK corporate structure, and investors were happy to have a high UK exposure. However, the UK market is now more structurally challenged in some sectors, in terms of technological disruption, climate change, regulation and risks of higher taxation. The latest change in the trust’s benchmark recognises the wider opportunity set in overseas markets.
WTAN has outperformed its composite benchmark in seven out of the last 10 years. It seeks to outpace the benchmark’s total return performance by at least 2.0% pa over the long term in both NAV and share price terms.
CEO and investment director: Andrew Bell, James Hart
CEO and investment directors’ view: Significant uncertainty
At the beginning of 2020, Bell and Hart expected an upturn in economic growth, a broadening of stock market leadership and something of a catch-up by the UK market following the decisive Conservative victory in the December 2019 general election. However, any pro-cyclical trend has reversed, firstly due to disturbances in the Middle East earlier in 2020, and now from the effects of the coronavirus, which is wreaking havoc across the globe. The managers do not know how much economic disruption the virus will cause nor how long its effects will last, and in the meantime, value stocks are being the most heavily affected by the delay in economic recovery. Bell and Hart explain that a prolonged recession is normally caused by central banks squeezing inflation out of the system or by a financial crisis. However, this time is different, and they suggest that conditions will only improve when there is evidence that the dramatic policy measures that have been put in place can be safely relaxed. The managers also note that stock markets are forward-looking and should pre-empt hard evidence of economic normalisation. In an optimistic scenario, Bell and Hart would expect another three to four tough months, with economic disruption peaking in the summer. Fiscal and monetary policy boosts could mean that once the economic recovery does take hold, the advancement could be quite rapid; as a result, the managers are ‘optimistic’ on the outlook for global equities once signs of containment of the COVID-19 virus emerge.
Asset allocation
Investment process: External managers plus direct holdings
While short-term effects such as investor sentiment can influence share prices over days, weeks and sometimes years, over the long term, prices tend to reflect a company’s fundamentals – those firms that can grow their cash flows and dividends should perform relatively better. Around 90% of WTAN’s portfolio is allocated to third-party managers, while up to 12.5% is directly invested by WIS’s executive team (up to 10.0% in specialist funds such as biotechnology and private equity and up to 2.5% in newly established or highly specialised investment firms). The external portfolios typically hold between 15 and 70 stocks, with the total portfolio typically having between 350 and 400 holdings. At the end of FY19, the active share of the third-party managers ranged between 75% and 98%, equating to 77% for WTAN’s combined portfolio. Active share is a measure of how a fund differs from its benchmark, with 0% representing full index replication and 100% no commonality. Exchange-traded index futures are used to make inexpensive tactical adjustments to regional exposure without interfering with the strategies of the third-party managers, who are not permitted to use derivatives or employ gearing, but who may hold cash when deemed appropriate.
WTAN’s board selects external managers after a formal selection process. They use a variety of networks and databases to identify managers with a long-term approach, good performance track records, high standards of corporate governance, clear and disciplined investment processes, concentrated portfolios and reasonable fees. An initial longer list is subjected to further due diligence, before the board interviews a final shortlist and makes an appointment.
WTAN views its multi-manager approach as having several potential benefits:
■
Specialist managers may generate higher total returns.
■
Multiple managers help to smooth investment performance.
■
High-conviction portfolios avoid over-diversification.
■
Retail investors can gain access to high-conviction strategies that are not generally available.
■
WIS’s executive team can adjust manager allocations and portfolio exposure.
■
WTAN’s direct investments offer exposure to higher-growth or value opportunities.
The board regularly reviews WTAN’s multi-manager line-up in terms of performance and adherence to their respective investment processes. It also considers the investment backdrop, which may call for changes in the third-party managers.
Bell explains that WTAN has increased its focus on sustainability and has signed up to the United Nations-supported Principles for Responsible Investment (PRI), which is seen as a code of best practice on environmental, social and governance (ESG) issues. He says that good governance has for a long time been recognised as an important element of successful investing, as badly managed companies are generally poor investments. WTAN engages with its external managers to understand their ESG policies and how these are integrated into their decision-making processes, and to identify any potential issues with their portfolio companies or disruptive influences that could affect their funds, such as climate change, technological disruption or poor corporate governance. Nine of the 10 third-party managers have also signed up to the PRI and they are increasingly holding their portfolio companies to account. WTAN’s focus on ESG has also affected its decision-making process in the portfolio of direct investments. For example, Bell and Hart engaged with BlackRock World Mining Trust to determine whether its investee companies are employing best practices, while they sold a small, short-term position in Riverstone Energy given the company’s relatively weak attitude to corporate governance and discount management, and its higher-than-anticipated level of debt.
Current portfolio positioning
Exhibit 3: Witan portfolio analysis and performance by investment manager
Equity mandate |
Benchmark |
Investment style |
% of AUM at |
Inception |
Performance (% pa, inception to end-Dec 19) |
|||
Witan |
B’mark |
Diff. |
||||||
Global |
Lansdowne Partners |
All-World |
Concentrated, benchmark-independent investment in developed markets |
17 |
14-Dec-12 |
17.4 |
13.5 |
3.9 |
Global |
Pzena |
All-World |
Systematic value |
13 |
02-Dec-13 |
10.4 |
12.4 |
(2.0) |
Global |
Veritas |
All-World |
Fundamental value, real return objective |
19 |
11-Nov-10 |
13.9 |
11.5 |
2.4 |
UK |
Artemis |
All-Share |
Recovery/special situations |
7 |
06-May-08 |
9.4 |
6.3 |
3.1 |
UK |
Heronbridge |
All-Share |
Intrinsic value growth |
5 |
17-Jun-13 |
10.0 |
7.4 |
2.6 |
UK |
Lindsell Train** |
All-Share |
Long-term growth from undervalued brands |
9 |
01-Sep-10 |
15.6 |
8.7 |
6.9 |
Europe |
CRUX |
Europe ex-UK |
Sound businesses with quality management and attractive valuations |
2 |
27-Oct-17 |
2.7 |
3.4 |
(0.7) |
Europe |
S W Mitchell |
Europe ex-UK |
High-conviction portfolio of companies which offer unrecognised value |
3 |
27-Oct-17 |
1.3 |
3.4 |
(2.1) |
Asia Pacific (incl. Japan) |
Matthews Int'l |
MSCI Asia Pacific Free |
Quality companies with dividend growth |
8 |
20-Feb-13 |
8.9 |
8.6 |
0.3 |
Emerging Markets |
GQG Partners |
MSCI Emerging Markets |
High-quality companies with attractively priced growth prospects |
5 |
16-Feb-17 |
8.4 |
6.8 |
1.6 |
Directly held investments |
Witan's executive team |
Witan’s composite benchmark |
Undervalued specialist collective funds and smaller manager mandates |
12 |
19-Mar-10 |
11.2 |
9.2 |
2.0 |
Source: Witan Investment Trust. Note: *Percentage of Witan’s assets managed, numbers subject to rounding. **Lindsell Train has changed from a UK to a global mandate.
As shown in Exhibit 3, WTAN currently has 10 external managers. Lindsell Train’s mandate has recently changed from UK to global equities, in line with WTAN’s more global focus; the transition was implemented during December 2019. Lindsell Train’s UK strategy has a long-term record of outperformance versus the UK market and the global fund is managed with the same philosophy of focusing on the long-term growth of global brands.
Hart explains the breakdown of WTAN’s direct fund holdings, as at end-FY19: 8% was a new holding in Schroder UK Real Estate to gain exposure to UK commercial property; 42% was in private equity (mostly international); 24% in life sciences and biotechnology; 14% in global mining, 8% in emerging markets smaller companies and 4% in distressed debt. There are also holdings in the specialist GMO Climate Change Fund and Latitude Investment Management, a smaller manager, which received an additional allocation from WTAN in November 2019.
|
Exhibit 4: Portfolio distribution by geography (left) and sector (right) as at 31 March 2020 |
|
|
|
|
Source: Witan Investment Trust, Edison Investment Research. Note: Numbers subject to rounding. |
|
|
Exhibit 4: Portfolio distribution by geography (left) and sector (right) as at 31 March 2020 |
|
|
|
|
|
|
Source: Witan Investment Trust, Edison Investment Research. Note: Numbers subject to rounding. |
WTAN’s geographic and sector exposure is shown in Exhibit 4. While the exposure to North America has increased meaningfully in recent months, the trust remains underweight versus the composite benchmark on valuation grounds. Since our last report was published in October 2019, there have been only modest changes in WTAN’s sector weightings.
Performance: Ahead of the benchmark in FY19
Exhibit 5: Five-year discrete performance data
12 months ending |
Share price |
NAV |
Composite benchmark* (%) |
MSCI World |
CBOE UK All |
31/03/16 |
(6.7) |
0.4 |
(2.9) |
0.3 |
(4.1) |
31/03/17 |
32.2 |
29.0 |
28.8 |
32.7 |
22.6 |
31/03/18 |
8.4 |
5.3 |
3.9 |
1.8 |
1.2 |
31/03/19 |
3.9 |
5.0 |
7.2 |
12.6 |
6.2 |
31/03/20 |
(19.3) |
(18.4) |
(8.7) |
(5.3) |
(19.1) |
Source: Refinitiv. Note: All % on a total return basis in pounds sterling.. *See fund profile section on page 3. From 1 January 2017 to 31 December 2019, 30% UK, 25% North America, 20% Asia Pacific, 20% Europe (ex-UK) and 5% Emerging Markets and from 1 January 2020, 15% UK and 85% world (including UK).
In FY19 (ending 31 December), WTAN’s NAV and share price total returns, of 21.3% and 22.1% respectively, were modestly ahead of the benchmark’s 20.3% total return. Gearing was a positive contributor to the trust’s relative returns in FY19 (+2.0pp including interest costs). For much of 2019, WTAN’s performance trailed that of its benchmark, due to its relatively high UK exposure and holdings in reasonably valued, but out-of-favour stocks. However, this portfolio structure was beneficial for relative performance in Q419, as market leadership broadened out from technology stocks and companies seen as offering predictable results regardless of the economic cycle. There was less concern about the US-China trade dispute, downward forecasts to economic growth looked to be bottoming, and the UK risk premium declined as political paralysis dissipated. In FY19, seven of the 10 external managers outperformed their respective benchmarks, led by Artemis (UK, +11.0pp), S W Mitchell (Europe, +9.6pp) and Heronbridge (+8.8pp), while three underperformed: Matthews (Asia Pacific, -8.5pp), Lansdowne Partners (global value, -5.7pp) and Pzena (global structural value, -3.9pp). WTAN’s direct holdings also underperformed by 8.6pp following three years of relatively strong performance. Healthcare specialist fund Syncona suffered a share price de-rating towards the end of 2019, despite successfully realising two major investments, Blue Earth Diagnostics and Nightstar Therapeutics, over the course of the year. There was also a lack of news flow from WTAN’s private equity funds. Bell and Hart say they are very self-critical about WTAN’s direct holdings portfolio; they stress that it needs to add value over time and is not viewed as a ‘vanity project’.
|
Exhibit 6: Investment trust performance to 31 March 2020 |
|
Price, NAV and benchmark total return performance, one-year rebased |
Price, NAV and benchmark total return performance (%) |
|
|
|
Source: Refinitiv, Edison Investment Research. Note: Three, five and 10-year performance figures annualised. |
|
WTAN’s relative returns to end-March 2020 are shown in Exhibit 7. Its share price has outperformed its composite benchmark over the last 10 years, while its NAV is broadly in line, although performance over shorter periods has been trickier. The trust has also outperformed the broad UK market over the last three, five and 10 years in both NAV and share price terms.
Commenting on WTAN’s underperformance so far this year, Bell says that it is largely due to portfolio moves and partly because of the trust’s gearing in a declining market. The coronavirus outbreak and the economic disruption it has brought have had a significant negative effect on global stock markets, many of which fell by more than 30% between mid-February and mid-March, while any subsequent recovery has so far been modest. WTAN’s performance has been negatively affected in recent months, as the external managers’ portfolios were positioned for an improving economy in 2020, and the trust had net gearing of 12% at the beginning of February, reflecting more optimistic growth expectations both in the UK and overseas. WTAN’s gearing has subsequently been reduced, and at 31 March 2020 net gearing was 4%. While global markets now appear more attractively valued, WIS believes the economic uncertainty wrought by the pandemic warrants a more cautious view. The trust’s level of gearing will be changed in response to increased clarity around corporate earnings and economic growth once lockdowns are lifted. WIS has carefully reviewed WTAN’s exposures in consultation with its external managers. In light of recent events, some of their portfolios have been changed, while other positions have been maintained. Bell and Hart believe that the trust’s diversified portfolio of more than 350 underlying holdings can continue to deliver shareholder value over the longer term.
|
Exhibit 7: Share price and NAV total return performance, relative to indices (%) |
||||||||
|
One month |
Three months |
Six months |
One year |
Three years |
Five years |
10 years |
|
Price relative to composite benchmark |
(6.7) |
(14.6) |
(10.5) |
(11.6) |
(10.6) |
(11.9) |
10.1 |
|
NAV relative to composite benchmark |
(7.6) |
(11.9) |
(9.9) |
(10.6) |
(11.3) |
(8.1) |
(0.8) |
|
Price relative to MSCI World |
(7.6) |
(16.4) |
(11.1) |
(14.8) |
(16.4) |
(22.5) |
(12.1) |
|
NAV relative to MSCI World |
(8.5) |
(13.7) |
(10.5) |
(13.9) |
(17.0) |
(19.2) |
(20.8) |
|
Price relative to CBOE UK All Companies |
(2.6) |
(5.1) |
(1.8) |
(0.3) |
4.4 |
9.5 |
39.9 |
|
NAV relative to CBOE UK All Companies |
(3.5) |
(2.0) |
(1.0) |
0.8 |
3.6 |
14.2 |
26.1 |
|
|
Source: Refinitiv, Edison Investment Research. Note: Data to end-March 2020. Geometric calculation. |
||||||||
|
Exhibit 8: NAV total return performance relative to benchmark over three years |
||||||||
|
||||||||
|
Source: Refinitiv, Edison Investment Research |
||||||||
Discount: Aiming to trade close to NAV
WTAN’s board aims to achieve a sustainably low discount or a small premium to NAV in normal market conditions, to ensure ongoing liquidity in the trust’s shares. It has the authority, renewed annually, to repurchase up to 14.99% and allot up to 10% of shares in issue. In FY19, 25.1m shares (2.8% of the base) were bought back at a cost of £53.6m and an average discount of 3.2%, which added £1.5m to NAV.
The trust is currently trading at a 2.0% share price discount to cum-income NAV, which compares with the range of a 0.2% premium to a 15.0% (decade high) discount over the last 12 months. Over the last one, three, five and 10 years, WTAN’s discount has averaged 3.1%, 2.3%, 2.7% and 5.8% respectively.
|
Exhibit 9: Share price premium/discount to NAV (including income) over three years (%) |
|
|
Source: Refinitiv, Edison Investment Research |
Capital structure and fees
WTAN is a conventional investment trust with one class of share; there are currently 863.2m ordinary shares in issue. In October 2019, a £50m 2.39% fixed-rate, 32-year secured private placement note was issued, which at the time was the lowest rate for long-dated funding by an investment trust. In total, at end-FY19 WTAN had c £220m of fixed-rate borrowings at an average rate of 3.8%, compared with 7.0% in 2015: £64m 6.125% secured bonds maturing in 2025; £21m 3.29% secured notes 2035; £54m 3.47% secured notes 2045; £50m 2.39% secured notes 2051; and £30m 2.74% secured notes 2054. The trust also has a £125m one-year, multi-currency borrowing facility providing additional flexibility.
On 25 March 2020, WTAN announced the early redemption of the 6.125% 2025 secured bonds. Repayment proceeds of c £85m will be funded from existing cash resources and short-term borrowing facilities. The early redemption will enable the trust to make greater use of low-cost short-term borrowings that are repayable at will. At current interest rates, there would be an estimated £3.0m pa interest saving if the £65m secured bonds were replaced with short-term borrowings, or up to £3.9m pa if part or all of the borrowings were not drawn. It will also increase WTAN's flexibility, if desired, to take advantage of current low interest rates to extend the term of the borrowings rather than waiting until 2025.
WIS actively manages WTAN’s level of gearing, increasing leverage when markets are attractively valued and reducing it when the outlook for investment returns look poorer; at end-March 2020, net gearing was 4%, compared with 12% at end-February 2020.
WTAN’s external managers are paid base fees in a range from 0.30% to 0.65% pa; the FY19 weighted average was 0.53%, just 1bp higher than 0.52% in FY18. Only one manager, accounting for c 7% of the portfolio, is eligible for a performance fee, which is capped, and they receive the lowest base fee. Another manager historically had a performance fee structure but moved to a straight base fee at the end of 2019. The majority of the manager’s fee structures taper, with lower rates paid on a higher level of assets under management. In FY19, WTAN’s ongoing charges (excluding performance fees) were 0.79% (+4bp vs FY18), while including performance fees they were 0.87% (+4bp vs FY18).
Dividend policy and record
WTAN pays quarterly dividends; in the absence of unforeseen circumstances, the first three interim payments are equal to one quarter of the prior year’s annual dividend, while the final payment is a balancing amount. The trust has increased its dividend for the last 45 consecutive years and currently offers a 3.1% yield.
In FY19, WTAN’s 6.01p earnings per share were 16.0% higher than 5.18p in FY18; the increase was due to a larger amount of dividend income and a favourable currency impact due to sterling weakness. The board has announced an FY19 annual dividend of 5.35p per share (1.12x covered), which is 13.8% higher year-on-year and well ahead of the year-end 2019 1.3% UK inflation rate. Over the last five years WTAN’s dividend growth has compounded at an annual rate of 11.7%.
As well as paying a higher dividend, the board once again added to reserves in FY19, which after allowing for the fourth interim payment totalled £71.1m. One of the benefits of investment trusts is the ability to use revenue reserves to fund dividends and dividend growth during lean periods. At end-FY19, WTAN’s represented more than 1.5x the annual dividend, which is a valuable source of flexibility in the current environment. The last time the board had to dip into reserves to support the trust’s dividend was in 2010.
Peer group comparison
WTAN is the fifth-largest fund in the 16-strong AIC Global sector. Its NAV total returns are below average over the periods shown, ranking 14th over the last 12 months, 13th over three years, 13th over five years and 10th over the last decade. WTAN’s discount is broadly in line with the group average, but is narrower than that of its closest peer, Alliance Trust, which also employs a multi-manager strategy. The trust’s ongoing charge is modestly above average and one of its external managers is eligible for a performance fee. WTAN has an average level of gearing in the peer group and an above-average dividend yield (c 80bp higher than the mean).
Exhibit 10: AIC Global sector as at 14 April 2020*
% unless stated |
Market |
NAV TR |
NAV TR |
NAV TR |
NAV TR |
Discount |
Ongoing |
Perf. |
Net |
Dividend |
Witan |
1,491.6 |
(14.9) |
(3.3) |
20.4 |
104.6 |
(2.0) |
0.8 |
Yes |
104 |
3.1 |
Alliance Trust |
2,290.3 |
(9.2) |
6.4 |
33.3 |
108.4 |
(5.1) |
0.6 |
No |
106 |
2.0 |
AVI Global Trust |
653.1 |
(15.9) |
(7.2) |
19.5 |
64.7 |
(9.6) |
0.9 |
No |
110 |
2.7 |
Bankers |
1,132.7 |
(1.9) |
17.4 |
43.3 |
145.6 |
1.0 |
0.5 |
No |
100 |
2.4 |
Brunner |
333.0 |
(6.0) |
6.3 |
26.6 |
103.2 |
(1.9) |
0.7 |
No |
108 |
2.6 |
EP Global Opportunities |
104.1 |
(13.6) |
(4.7) |
12.3 |
66.7 |
(8.5) |
0.9 |
No |
100 |
2.3 |
F&C Investment Trust |
3,378.2 |
(6.9) |
9.9 |
38.1 |
133.7 |
(4.4) |
0.5 |
No |
111 |
1.9 |
JPMorgan Elect Managed Growth |
211.2 |
(9.6) |
5.6 |
24.7 |
119.4 |
(6.0) |
0.6 |
No |
100 |
2.2 |
Lindsell Train |
237.5 |
9.0 |
71.5 |
151.3 |
468.2 |
22.0 |
0.9 |
Yes |
100 |
2.5 |
Majedie Investments |
111.9 |
(22.4) |
(17.1) |
(1.5) |
35.7 |
(10.5) |
1.0 |
No |
107 |
5.4 |
Manchester & London |
190.0 |
9.1 |
54.6 |
109.3 |
99.1 |
(1.7) |
0.8 |
No |
100 |
2.7 |
Martin Currie Global Portfolio |
236.7 |
4.2 |
27.5 |
58.2 |
163.6 |
(0.8) |
0.6 |
Yes |
100 |
1.5 |
Mid Wynd International |
262.2 |
3.1 |
28.0 |
58.4 |
169.6 |
2.6 |
0.5 |
No |
101 |
1.1 |
Monks |
1,939.7 |
(2.4) |
27.8 |
66.0 |
133.7 |
4.0 |
0.5 |
No |
107 |
0.2 |
Scottish Investment Trust |
517.4 |
(8.7) |
(2.4) |
21.7 |
91.4 |
(15.8) |
0.6 |
No |
94 |
3.3 |
Scottish Mortgage |
9,104.7 |
15.9 |
67.7 |
120.9 |
365.7 |
2.7 |
0.4 |
No |
109 |
0.5 |
Average |
1,387.1 |
(4.4) |
18.0 |
50.1 |
148.3 |
(2.1) |
0.7 |
104 |
2.3 |
|
WTAN rank in group (16 trusts) |
5 |
14 |
13 |
13 |
10 |
9 |
6 |
8 |
3 |
Source: Morningstar, Edison Investment Research. Note: *Performance data to 9 April 2020 based on ex-par NAV. TR = total return. Net gearing is total assets less cash and equivalents as a percentage of net assets. **One of WTAN’s managers is eligible for a performance fee.
The board
WTAN’s board is currently made up of 10 directors, nine of whom are independent of the manager. It has four primary responsibilities: governance, risk management, selecting the third-party managers and assessing the trust’s performance. The chairman is Harry Henderson, who was appointed as a director is January 1988, and assumed his current role in March 2003; he is due to retire at the April 2020 AGM. Tony Watson joined the board in February 2006 and assumed the role of senior independent director in February 2008. The other seven independent directors and their dates of appointment are: Richard Oldfield (May 2011; he too will retire at the 2020 AGM), Suzy Neubert (April 2012), Ben Rogoff (October 2016), Jack Perry (January 2017), Paul Yates (May 2018), Andrew Ross (chairman-elect, May 2019) and Gabrielle Boyle (August 2019). The non-independent director is WTAN’s CEO, Andrew Bell, who joined the board in February 2010. A search for another director is currently underway, and an announcement will be made in due course.
|
|
Research: Healthcare
The year 2019 was transformational for CASI Pharmaceuticals. The company shifted its focus from in-licensing mature assets to investing in early-stage programs such as its CD19 CAR-T program CNCT19 and its anti-CD38 mAb CID-103. The company is focused on becoming a major provider of hematologic drugs for China. To this end, it plans to initiate four clinical trials in 2020 and two more in 2021. In this note we provide a comprehensive clinical and business outlook on the company.