MOD Resources (MOD) is a copper-silver exploration and development company with a substantial ground holding in the Kalahari Copper Belt, Botswana. The company has been very successful with its regional exploration concept, which has led to the discovery and drill-out of the significant T3 copper-silver deposit and the delineation of a preliminary resource at the T1 copper-silver deposit. Regional drilling in the T3 Expansion Project has led to two additional discoveries, A1 and A4, while regional drilling at the T20 Exploration Project has also returned interesting results at T4 and T23. MOD is completing a feasibility study at T3, which will benefit from a coarser grind size and an increased base case plant size, and a scoping study at T3 underground, both due for completion in Q119, while continuing its regional exploration programme.
Written by
MOD Resources |
Discoveries made, exploration concept validated |
Initiation of coverage |
Metals & mining |
18 December 2018 |
Share price performance
Business description
Next events
Analyst
MOD Resources is a research client of Edison Investment Research Limited |
|||||||||||||||||||||||||||||||||||||||||||||||
MOD Resources (MOD) is a copper-silver exploration and development company with a substantial ground holding in the Kalahari Copper Belt, Botswana. The company has been very successful with its regional exploration concept, which has led to the discovery and drill-out of the significant T3 copper-silver deposit and the delineation of a preliminary resource at the T1 copper-silver deposit. Regional drilling in the T3 Expansion Project has led to two additional discoveries, A1 and A4, while regional drilling at the T20 Exploration Project has also returned interesting results at T4 and T23. MOD is completing a feasibility study at T3, which will benefit from a coarser grind size and an increased base case plant size, and a scoping study at T3 underground, both due for completion in Q119, while continuing its regional exploration programme.
Year end |
Revenue (A$m) |
PBT* |
EPS* |
DPS |
P/E |
Yield |
12/16 |
0.0 |
(1.2) |
(0.01) |
0.00 |
N/A |
N/A |
12/17 |
0.0 |
(2.3) |
(0.01) |
0.00 |
N/A |
N/A |
12/18e |
0.0 |
(5.0) |
(0.02) |
0.00 |
N/A |
N/A |
12/19e |
0.0 |
(4.2) |
(0.01) |
0.00 |
N/A |
N/A |
Note: *PBT and EPS are normalised, excluding amortisation of acquired intangibles, exceptional items and share-based payments.
Discoveries made
MOD has made four significant discoveries at its Kalahari Copper Belt Project. The most advanced is the T3 copper-silver deposit, which has a pre-feasibility study (PFS) established with a feasibility study (FS) underway and due for completion in Q119. The T3 PFS established a total JORC 2012 compliant mineral reserve estimate of 21.4Mt at a grade of 1.02% Cu and 10.3g/t Ag but the larger resource estimate of 60mt at a grade of 0.98% Cu and 13.9g/t Ag will be used in the FS. At the T1 copper-silver deposit, where there is a resource estimate of 2.5Mt at a grade of 1.8% Cu and 45g/t Ag, an airborne electromagnetic survey has been completed that will be used to define additional drill targets in 2019.
Exploration concept validated
To date, the company has defined 23 additional drill targets that have the potential to be supplementary deposits. Initial drilling at four of these targets tested to date – A4, A1, T4 and T23 – returned intersections of copper mineralisation, validating the company’s exploration concept for the region. The company now has the potential to discover additional deposits, making it an attractive regional exploration play.
Valuation: Undervalued even at our base case
We value MOD at a price of £0.39 (A$0.64) per share using a SOTP valuation for the T3 deposit and other early-stage projects. This provides an upside of 117% on the current share price. T3 has a very low capital intensity compared to other projects and an all-in sustaining cost in the bottom 35% of global copper projects. We believe MOD offers attractive exposure to a commodity with attractive supply-demand fundamentals over the mid to long term.
Investment summary
Company description: Botswanan copper-silver explorer
MOD is a copper-silver exploration and development company focused in the Kalahari Copper Belt, Botswana. The company has demonstrated the success of its regional exploration concept by discovering and proving up the significant T3 copper-silver deposit and has established a preliminary resource estimate at the T1 copper-silver deposit. Further drilling in the T3 Expansion Project has made two additional discoveries at the A1 and A4 targets. At T3, a JORC 2012 mineral reserve estimate of 21.4Mt at a grade of 1.02% Cu has been established and a PFS for an open pit operation was completed in January 2018, highlighting robust economics. An FS for T3 and a SS for T3 underground is due for completion in Q119. At T1, a JORC 2012 compliant mineral resource estimate of 2.5Mt at a grade of 1.8% Cu has been established and an airborne EM survey has been completed and this will be used for further drill target definition in 2019. In addition to the exploration potential of the T3 Expansion Project, early results at the T20 Exploration Project from the T4 and T23 targets have returned interesting results. The company is pursuing a dual strategy to advance its T3 deposit into production and prove up potential supplementary sources of mineralisation for the T3 plant in the mid-term, while continuing to test and advance the numerous targets for additional discoveries in the near term.
Valuation: 39p per share
Compared to the enterprise value per attributable tonnage of contained copper of MOD’s London-listed, copper-focused peer group at a similar stage of development, of £99/t, MOD looks undervalued at £55/t. Using a sum-of-the-parts valuation (SOTP), which includes using a discounted dividend valuation for the T3 deposit, a peer group multiple for the T1 deposit and a relative valuation for the early-stage exploration targets, we arrive at a valuation of 39p per share for MOD, an upside of 17% on the current share price.
Financials: LOM EBITDA of A$928m over nine years
We forecast that during 2020 as the T3 mine ramps up production levels, MOD will generate revenue of A$73.6m. Once at full production, expected 2021, we forecast this to increase to A$224.2m. Over the initial nine-year mine life, we forecast MOD to generate revenue of A$1.9bn and EBITDA of A$936m. To develop T3 into a mine that produces 23,000t of copper pa, using the base case PFS numbers, and to continue to advance its earlier-stage projects, we forecast that MOD will require additional funding of c A$165m over the next two years, which we envisage will be funded through a mixture of debt and equity. We forecast that the company will finish FY18 with a net cash position of A$9.9m.
Sensitivities: Working to an ambitious timeline
Two key general sensitivities for the project’s development are that the company needs to apply for a mining licence and will require an Environmental and Social Impact Assessment (ESIA). The timing of these approvals, combined with the time required for funding, means that the 2020 target for production is ambitious and there remains a risk that timing for initial production may slip. The biggest sensitivity to the T3 project’s metrics is the metals prices used. In our valuation and forecasts we used a life-of-mine (LOM) copper price of US$6,400/t and a silver price of US$24/oz Ag. To test how robust the project was, we ran upside and downside scenarios at different metals prices. The scenarios demonstrated that T3 was a robust project even at low metals prices and that a positive movement in metals prices would have a large impact on our valuation.
Company description: Consolidating the copper belt
Company and regional exploration history
MOD was originally a healthcare-focused business called Medical Corporation Australia. The company changed its focus to mining following the acquisition of GMR Resources (announced on 1 September 2011). GMR Resources held 100% of 14 prospecting licences, located in the Kalahari Copper Belt, Botswana. Mineralisation was initially discovered by MOD at T1 (announced on 9 July 2012), but at the time the company’s main focus was on a gold project in New Zealand (now held for sale). Julian Hanna joined the board as MD (announced on 19 March 2013) and the company’s focus soon shifted to Botswana.
MOD cemented its position in the area with the acquisition of 70% of Discovery Mines (announced on 10 November 2015), which held 100% of 14 prospecting licences, located adjacent to MOD Resource’s existing ground holding. The acquisition was completed in conjunction with joint venture partner, Metal Tiger (MTR).
Discovery Mines was previously owned by Discovery Metals (DML), which was placed in voluntary administration in February 2015 and wound up in June 2015. Discovery Metals’ other subsidiary, Discovery Copper Botswana, which held the Boseto processing plant and other assets, was acquired by Cupric Canyon Capital in July 2015 for c US$33.7m. Cupric had previously acquired the Kalahari Copper Belt assets of Hana Mining (HMG) in 2013 for C$82m and planned to leverage the Boseto plant for its own copper projects.
Discovery Metals got into financial difficulty because it was mining lower-grade oxide and transition ores from two large open pits, and the Boseto plant was poor at recovering the copper from this material. As a result, the cash being generated by the company was not enough to service the debt used to finance the project. The type of ore mined by Discovery Metals is different to the sulphide dominated ore that MOD plans to extract, which has high recoveries, 93.1% for copper and 86.2% for silver, using conventional processing techniques.
Following Cupric Canyon Capital’s acquisition of Discovery Metals, it had remarkable success, proving up a JORC 2012 compliant mineral resource estimate of 100.3Mt at a grade of 1.95% copper and 20g/t silver at the Zone 5 deposit and an additional 60Mt at a grade of 2% copper and 38g/t silver from three regional targets. Cupric Canyon Capital plans to modify the existing plant at Boseto to treat sulphide ore from an underground mine at Zone 5, and is targeting production of 50,000t of copper and 1.4Moz of silver pa over a 25-year mine life from 2019.
Currently, MOD holds 100% of nine prospecting licences and 70% of 17 prospecting licences, located in the Kalahari Copper Belt, Botswana (Exhibit 1). MOD recently acquired the outstanding 30% interest in the T3 deposit (announced on 16 November 2018), the most advanced of MOD’s projects, at what we believe is an attractive valuation of US$13.9m, payable in 17m shares and 40.7m options with no exercise price, from joint venture partner, Metal Tiger. MOD expects T3 to begin production before the end of 2020.
|
Exhibit 1: Map of southern Africa with MOD’s tenement area |
|
|
Source: MOD – Africa Down Under conference presentation, August 2018 |
Reserves and resources
MOD’s licences contain the T3 copper-silver deposit, which has a total JORC 2012 compliant mineral reserve estimate based on the PFS of 21.4Mt at a grade of 1.02% Cu and 10.3g/t Ag (Exhibit 2). The deposit has a total JORC 2012 compliant mineral resource estimate of 60.2Mt at a grade of 0.98% copper (Cu) and 13.9g/t silver (Ag). The T1 copper-silver deposit has a total JORC 2012 compliant mineral resource estimate of 2.5Mt at a grade of 1.80% Cu and 45g/t Ag.
Exhibit 2: Reserves and resources
T3 reserve category† |
Tonnes (t) |
Cu grade (%) |
Ag grade (g/t) |
Contained Cu (t) |
Contained Ag (Moz) |
CuE grade (%)‡ |
Contained CuE (t)‡ |
Proved |
8,780,000 |
1.13 |
11.1 |
98,950 |
3.1 |
1.22 |
106,732 |
Probable |
12,650,000 |
0.94 |
9.7 |
118,640 |
3.9 |
1.01 |
128,375 |
Total |
21,430,000 |
1.02 |
10.3 |
217,590 |
7.1 |
1.10 |
235,612 |
T3 resource category* |
|||||||
Indicated |
36,631,000 |
1.14 |
16.0 |
417,000 |
18.6 |
1.26 |
462,803 |
Inferred |
23,524,000 |
0.74 |
11.0 |
173,300 |
8.3 |
0.82 |
194,038 |
Total |
60,155,000 |
0.98 |
13.9 |
590,400 |
26.9 |
1.09 |
654,017 |
T1 resource category* |
|||||||
Indicated |
1,750,000 |
1.76 |
46.0 |
30,950 |
2.6 |
2.11 |
37,009 |
Inferred |
750,000 |
1.90 |
42.6 |
14,250 |
0.7 |
2.23 |
16,715 |
Total |
2,500,000 |
1.80 |
45.00 |
45,200 |
3.3 |
2.15 |
53,678 |
Source: †MOD T3 PFS, 31 January 2018, *SRK Consulting (UK) Competent Person's Report on the Mineral Assets of MOD, Republic Of Botswana, ‡Edison estimates
Relative scale to London-listed peers
Compared to the deposits held by MOD’s London-listed peer group, the T3 deposit is a medium-sized and medium-grade deposit, while the T1 deposit is a small but high-grade deposit (Exhibit 3).
|
Exhibit 3: Tonnage, grade and contained CuE for London-listed peer group |
|
|
Source: Edison Investment Research. Note: Size of bubble is in proportion to contained CuE. *Announced plans to list in London. |
Work completed to date
It is important to put the T3 and T1 deposits into a regional exploration context, to give a clearer understanding of the potential value of MOD Resources. Two additional discoveries (A4 and A1) have already been made and initial results on two targets (T23 and T4) demonstrate the presence of a copper mineralising system. The company’s ground holding also contains more than 140km of copper-in-soil anomalies and airborne electromagnetic (EM) anomalies, with numerous defined targets that have yet to be tested (Exhibit 4).
|
Exhibit 4: Map of anomalies in the T3 and T20 Dome complexes |
|
|
|
Source: MOD – Africa Down Under conference presentation, August 2018 |
Initial drilling on the A4 target, a 4km-long EM anomaly located just 8km to the west of the T3 deposit, returned 52m at a grade of 1.5% Cu and 14g/t Ag from 232.2m and 31.2m at 1.1% Cu and 11g/t Au from 560m (MO-A4-003D); 19.3m at a grade of 1% Cu and 10g/t Ag from 485m (MO-A4-004D); and 42.9m at 1% Cu and 19g/t Ag from 257.5m (MO-A4-008D).
Initial drilling on the A1 target, a 12km-long EM anomaly located 22km north-east of the T3 deposit, also produced impressive results, including 130m at a grade of 0.52% Cu and 3.5g/t Ag from 590m (MO-A1-005D); 52m at a grade of 0.61% Cu and 4.6g/t Ag from 624m, including 1.4m at a grade of 3.8% Cu and 26g/t Ag from 673m (MO-A1-006D); and 19m at a grade of 0.8% Cu and 6g/t Ag from 660m, including 3m at a grade of 2.0% Cu and 15g/t Ag from 676m (MO-A1-003D).
Assay results from recent drilling (announced on 10 December 2018) on the T23 target, a large magnetic anomaly, include 25m at a grade of 0.36% Cu and 4g/t Ag from 65m, including 3m at a grade of 0.7% Cu and 10g/t Ag from 65m, and 1m at a grade of 1% Cu and 13g/t Ag from 80m (MO-T23-001D).
Previous drilling by Discovery Metals (announced on 6 February 2013) at the T4 target, a 400m-long copper-in-soil anomaly, returned 19m at a grade of 1.0% Cu and 13g/t Ag from 73m, including 4m at a grade of 2.6% Cu and 40g/t Ag (APRC 2790) and 17.5m at a grade of 0.9% Cu and 13g/t Ag from 59m depth, including 7m at a grade of 1.5% Cu and 23g/t Ag (APDD 3301). Drilling by MOD (announced on 1 April 2016) returned 2m at a grade of 6.12% Cu and 111g/t Ag from 101m (MO-A-04R). MOD has yet to undertake a follow-up drill programme at T4, as its focus has been on advancing the T3 deposit.
The A4 and A1 targets are just two targets in the T3 Expansion Project where there could be other discoveries, and to the south-west of the T3 Expansion Project is the larger T20 Exploration Project, which contains the T4 and T23 targets and more copper-in-soil anomalies than can be found in the T3 Expansion Project (as shown by red dots in Exhibit 4).
T3 copper-silver deposit
The T3 deposit is the most advanced of MOD’s discoveries. The company is targeting first production at the deposit by the end of 2020.
Geology
The T3 deposit is located within the Neoproterozoic Era (1,000Ma to 541Ma) Ghanzi-Chobe Supergroup sedimentary rocks, which were formed in an intracratonic rift basin, and host the majority of the known copper deposits in the Kalahari Copper Belt.
The T3 deposit comprises two types of copper-silver mineralisation, vein-hosted mineralisation and sediment-hosted strata bound mineralisation, which occurs along the contact between the Ngwako Pan Formation and the overlying D’Kar Formation.
The Ngwako Pan Formation is predominantly composed of red arkose, sandstones, with less interbedded siltstone and shales. The younger D’Kar Formation is predominantly composed of grey-green siltstone, with lesser shales, arkose sandstones and limestones.
The copper-silver mineralisation is predominantly found in the chemically reduced shales and siltstones of the D’Kar Formation that overlie the oxidised sandstones of the Ngwako Pan Formation, with the distribution of mineralisation being structurally related to folding (Exhibit 5). The mineralisation is predominately made up of the sulphide copper minerals bornite, chalcocite, and chalcopyrite.
|
Exhibit 5: Generalised section (not to scale) of Kalahari Copper Belt deposits |
|
|
Source: MOD Resources – A4 Dome potential to support T3 expansion strategy, 4 October 2018 |
PFS
MOD completed a PFS on the T3 deposit (announced on 31 January 2018), for a base case 2.5Mtpa plant. This defined pre-tax NPV8 of US$281m and a pre-tax IRR of 39%, assuming a nine-year life of mine and an average copper price of US$6,614/t. This was based on the proved and probable JORC 2012 compliant mineral reserve estimate at the time of 21.4Mt at a grade of 1.02% Cu and 10.3g/t Ag.
An expansion case to 4Mtpa, which included both the JORC 2012 compliant mineral reserve estimate of 21.4Mt at a grade of 1.02% Cu and 10.3g/t Ag, and a portion of the total JORC 2012 compliant mineral resource estimate of 50Mt at a grade of 0.91% Cu and 10.6g/t Ag at the time of the January 2018 PFS (now outdated), defined a pre-tax NPV8 of US$402m and a pre-tax IRR of 38% assuming a 12-year life of mine (LOM) and an average copper price of US$6,614/t.
The base case estimated the all-in sustaining cost (AISC) to be US$1.36/lb, which is in the lowest 35% of global copper projects (Exhibit 6).
|
Exhibit 6: AISC of global copper projects |
|
|
Source: Company data |
The base case also had a total development capex of US$155m and would produce an average of 23,000t of copper and 690,000oz of silver in concentrate per year, which is c 24,600t CuE based on current prices. This would put T3’s annual average copper production equal to 0.12% of global copper production, making T3 a relatively small copper operation. Despite its small scale the forecast base case capital intensity is US$6,300/t CuE pa, which is remarkably low compared to other copper development projects (Exhibit 7).
|
Exhibit 7: Capex intensity of copper development projects |
|
|
Source: Company data |
The expansion case in the January 2018 PFS increases the size of the plant to 4Mtpa and defines a pre-tax NPV8 of US$402m and a pre-tax IRR of 38%, assuming a 12-year LOM and the same average copper price.
The AISC of the expansion case was US$1.46/lb, which would still be in the bottom 40% of global copper projects (Exhibit 6) with capex forecast to be US$192m. This would see production increase to 28,000t of copper and 903,000oz of silver in concentrate per year, which is c 30,000t of CuE and would be equal to 0.15% of global copper production. The capital intensity would remain at a similar level to the base case level at US$6,379/t CuE pa (Exhibit 7).
FS
The T3 deposit FS is due for completion in Q119. MOD has announced that metallurgical results from the deposit indicate it can use a coarser grind size than was used in the PFS, which could potentially result in lower capex and opex due to the reduced comminution requirement and power demand (announced on 16 October 2018). Alongside this improvement there has been a 20% increase in the base case size of the plant from 2.5Mtpa to 3Mtpa (announced on 10 October 2018). This will likely increase the capex as the plant will be larger, but could potentially reduce the unit opex, by spreading the fixed costs over a large amount of product.
Underground SS
An SS to assess the potential of underground mining at the T3 deposit below the open pit is due for completion in Q119.
Mining and processing
MOD expects mining at the T3 deposit to be through conventional drill and blast methods. The processing plant is likely to consist of a crush, semi-autogenous grinding mill and ball mill circuit followed by flotation and the production of a concentrate with an average grade of 30–35% copper. The metallurgical studies to date indicate the concentrate will have varying levels of arsenic, bismuth and lead, which may incur smelter penalties. MOD will examine how to reduce penalty elements during its next round of metallurgical studies.
Infrastructure
The Botswana Power Corporation has started installing the infrastructure for a grid power transmission line to be extended to within 12km of the T3 deposit. A long-term lease agreement has also been executed for a 100m-wide strip of farmland to be used for the mine access road joining the A3 highway and the T3 deposit, and to accommodate the planned grid power spur line into the site. Access to the project is via a farm track 12km south-east from the turn off of the sealed A3 highway.
Development timeline
The Environmental and Social Impact Assessment (ESIA) for the project is expected to be submitted to the Department of Environmental Affairs in Botswana in Q418. It will then be the subject of a public review period. Once the ESIA is approved and the FS is completed, MOD will be able to apply for a mining licence at the project, which is targeted for Q219. Assuming the company secures the development finance soon after this milestone, its target for first production by end 2020 is feasible.
Funding
MOD is working with debt advisers and states it has already received significant interest from several global financial institutions regarding the development funding. It is also considering alternative funding options, such as alternative debt providers, trading houses and smelters. We assess how the project could be funded in more detail later.
T3 Expansion Project
The T3 Expansion Project covers an area of 700km2 (Exhibit 8) and is located along the Central Structural Corridor, the same structural setting as Cupric’s Banana Zone deposit, which has a JORC 2012-compliant mineral resource estimate of 155Mt at a grade of 0.85% Cu and 11g/t Ag.
|
Exhibit 8: Map of discoveries in the T3 Expansion Project and T20 Exploration Project |
|
|
Source: MOD – Exploration unlocks copper potential at T23 Dome, 10 December 2018 |
T1 copper-silver deposit
The T1 deposit is a small but high-grade deposit in the north-west part of the T3 Expansion Project (Exhibit 8). T1 has a JORC 2012-compliant mineral resources estimate of 2.5Mt at a grade of 1.8% Cu and 45g/t Ag. This deposit could provide an additional feed to extend the life of the T3 plant or increase production rates.
Other regional targets
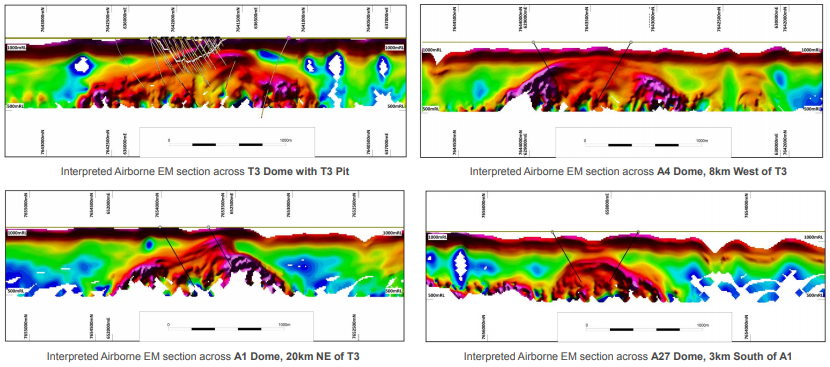
MOD has identified seven other high-priority conductive electromagnetic anomalies (shown as white circles in Exhibit 9) associated with what appear to be large dome structures, similar to those that host the T3 deposit (Exhibit 10). These targets are close enough to the T3 deposit to be used for a supplementary feed for the plant if significant discoveries are made.
|
Exhibit 9: Map of EM anomalies associated with T3 deposit, A1 and A4 targets |
|
|
Source: MOD – Africa Down Under conference presentation, August 2018 |
|
Exhibit 10: Cross-section of EM anomalies related to T3 deposit, A1, A4 and A27 targets |
|
|
Source: MOD – Africa Down Under Conference Presentation, August 2018 |
A4 target
The A4 target is 8km to the west of the T3 deposit (Exhibit 9). It is a 4km long EM anomaly that is interpreted to be a dome structure (Exhibit 10). Drilling on the A4 target returned assay results including 52m at a grade of 1.5% Cu and 14g/t Ag from 232.2m, and 31.2m at 1.1% Cu and 11g/t Au from 560m (MO-A4-003D); 19.3m at a grade of 1% Cu and 10g/t Ag from 485m (MO-A4-004D); and 42.9m at 1% Cu and 19g/t Ag from 257.5m (MO-A4-008D) (Exhibit 11).
|
Exhibit 11: Drill hole location on the A4 target |
|
|
Source: MOD – A4 Dome potential to support T3 Expansion Strategy, 4 October 2018 |
These high grades over large intercepts indicate that MOD has made another significant discovery. Additional assay results from the recently completed 20 diamond drill hole programme are expected soon.
A1 target
The A1 target is located 22km north-east of the T3 deposit (Exhibit 9). It is a 12km-long EM anomaly, also interpreted to be a dome structure (Exhibit 10). Initial assay results include 130m at a grade of 0.52% Cu and 3.5g/t Ag from 590m (MO-A1-005D); 52m at a grade of 0.61% Cu and 4.6g/t Ag from 624m, including 1.4m at grade of 3.8% Cu and 26g/t Ag from 673m, located on the D’Kar-Ngwako Pan contact (MO-A1-006D); and 19m at a grade of 0.8% Cu and 6g/t Ag from 660m, including 3m at 2.0% Cu and 15g/t Ag from 676m, also located on the D’Kar-Ngwako Pan contact (MO-A1-003D) (Exhibit 12).
|
Exhibit 12: Drill hole location on the A1 target |
|
|
Source: MOD – A1 Dome delivers significant copper in initial drilling, 15 November 2018 |
While the large intersections of disseminated mineralisation are exciting from a proof of exploration concept view, given the significant depth of the mineralisation and moderate-grade, they are unlikely to be of economic interest to MOD in the near term. MOD is planning to put drilling on hold at the A1 target, while the assay results undergo further interpretation and it completes a high-level conceptual underground mining study on the potential of narrower but higher-grade mineralisation at the D’Kar-Ngwako Pan contact.
T20 Exploration Project
The T20 Exploration Project is located to the south-west of the T3 Expansion project in the same Central Structural Corridor (Exhibit 8). The copper and zinc anomalies within the complex extend over an area of c 60km in strike and around 20km in width (Exhibit 13, top image).
|
Exhibit 13: Zinc-in-soil anomalies in the T20 Exploration Project (top) and zoom in on T4 and T23 (bottom) |
|
|
|
Source: Top: MOD – Africa Down Under conference presentation, August 2018; bottom: MOD – Exploration unlocks copper potential at T23 Dome, 10 December 2018 |
T4 target
MOD’s initial reverse circulation drilling on the T4 target (announced on 1 April 2016) returned 2m at a grade of 6.1% Cu and 111g/t Ag from 101m (MO-A-04R) and historic drilling by Discovery Metals returned 19m at a grade of 1.0% Cu and 13g/t Ag from 73m, including 4m at a grade of 2.6% Cu and 40g/t Ag (APRC 2790) and 17.5m at a grade of 0.9% Cu and 13g/t Ag from 59m depth, including 7m at a grade of 1.5% Cu and 23g/t Ag (APDD 3301). These results were not followed by additional drilling because in March 2016 MOD discovered the T3 deposit, which it then focused on advancing.
T23 target
The T23 target is interpreted to be another large, structurally complex dome (Exhibit 13, bottom image). Assay results from the recent drill programme at T23 (announced on 10 December 2018), included 25m at a grade of 0.36% Cu and 4g/t Ag from 65m, including 3m at a grade of 0.7% Cu and 10g/t Ag from 65m and 1m at a grade of 1% Cu and 13g/t Ag from 80m (MO-T23-001D).
Visual observations from two other holes, where assay results are pending, confirmed the presence of disseminated copper mineralisation. MO-T23-002D (Exhibit 14) identified malachite and chrysocolla in fractures and narrow veins in the near-surface and disseminated chalcocite, chalcopyrite and bornite deeper in the hole. MO-T23-003D intersected zones of visible, finely disseminated copper sulphides in a wide interval from approximately 85m to 385m (Exhibit 15).
Based on the visual descriptions of the core to date, we believe it is unlikely the first three follow-up holes on T23 have found anything of economic significance. However, it is important to note that none of the holes drilled to date have intersected the D’Kar and Ngwako Pan Formation contact, which is a regional contact associated with large intersections of higher-grade mineralisation. A fourth drill hole, MO-T23-004D, located 250m north of MO-T23-003D (Exhibit 15), is underway and has been designed to test the D’Kar and Ngwako Pan Formation contact.
|
Exhibit 14:MO-T23-001D and MO-T23-002D collar locations and visual observations |
|
|
Source: MOD – Africa Down Under conference presentation, August 2018 |
|
Exhibit 15:MO-T23-003D and MO-T23-004D collar locations and visual observations |
|
|
Source: MOD – Exploration unlocks copper potential at T23 Dome, 10 December 2018 |
MOD is planning a substantial drilling campaign in early 2019 to target some of the most compelling domes and structural targets in the T23 target area.
Copper market fundamentals
Industry observers point to global copper metal supply from mining operations contracting from its current level of 20Mt per annum to around 16Mt to 18Mt per annum by 2027, as mines are exhausted, grades fall lower and expansions become deeper. However, demand for copper metal is forecast to continue to increase over the next decade, reaching between 24Mt and 30Mt per annum. While recycling of scrap will fill some of the supply vacuum, c 4Mt per annum, new projects will be required for supply to keep pace with demand.
Demand
The key factors expected to drive demand include continued global population growth from seven billion to eight billion by 2025, the continued industrialisation of China and India and the potential increased usage of electric vehicles (EVs).
Battery-powered EVs are estimated to contain around 83kg of copper, compared to 23kg of copper in cars powered by an internal combustion engine (source: Global Mega Trends and Key Markets for Copper, The International Copper Association (ICA), March 2018). The number of EVs in use globally is expected to grow from 3.1m in 2017 to between 125m and 220m by 2030 (Exhibit 16) according to the International Energy Agency (IEA). In total, the ICA forecasts copper demand from passenger EVs alone will be nearly 1.9Mt of copper per year by 2035.
|
Exhibit 16: Forecast growth of EVs until 2030 |
|
|
Source: OECD/IEA 2018 Global EV Outlook, IEA Publishing. Licence: www.iea.org/t&c |
Added to the ICA’s forecasts for copper demand from EVs will be the increased demand for copper from charging ports. There are currently an estimated 4m public and private EV charging ports globally; the IEA predicts that between 137m and 277m will be needed by 2030 (Exhibit 17). With the average direct current charging port requiring nearly 20kg of copper per unit, according to the ICA, this will also have a significant effect on global copper demand.
|
Exhibit 17: Forecast growth of electric vehicle charging ports until 2030 |
|
|
Source: OECD/IEA 2018 Global EV Outlook, IEA Publishing. Licence: www.iea.org/t&c |
According to the ICA, global copper demand will increase between 3Mt and 5Mt over the next decade, although it notes that if the use of EVs becomes widespread demand could reach 11Mt, with other green technologies adding further upside potential.
Supply
Disruptions to existing producers have had a big impact on supply in recent years (Exhibit 18). Geopolitical uncertainty has played a big part in this and we expect it to continue in the near to medium term. Increased industrial action by mine employees from countries such as Chile (-4%
y-o-y in 2017) combined with geopolitical issues in other large producing countries such as Indonesia (-11% y-o-y in 2017) reduced global production levels to 19.7Mt in 2017, from 20.1Mt in 2016 (Exhibit 19).
|
Exhibit 18: Percentage of global copper supply affect by disruptions 2005 to 2017 |
|
|
Source: Industry data |
|
Exhibit 19: Global copper supply and LME average prices per tonne 1994 to 2017 |
|
|
Source: USGS – Minerals Information Copper Statistics and Information, 1995–2018 |
Added to the squeeze on supply is a lack of new large-scale discoveries being advanced to production and a lack of expansion at existing mines. Meanwhile, older large-scale operations need to go deeper and consequently become more expensive to operate and less productive as they approach the end of their lives. As a result, a tightening of the copper market could be expected between 2020 and 2024. In our view, this deficit should underpin global copper prices, which are currently around US$6,162/t. We outline our pricing assumptions and sensitivities in the valuation sensitivities section below.
Assumptions
Metal price assumptions
We forecast the copper price using a regression between the historic copper and oil prices since 2006. We then use our long-term oil price forecast of US$70/bbl to forecast the future copper price. This analysis has an R2 value of 0.78. The regression results in a base case long-term copper price forecast of US$6,400/t, with a standard error of US$720/t (or +/-11%).
To ensure the standard error is reflected in our analysis of MOD, we also ran upside and downside scenarios that add or subtract the standard error to or from our base case copper price, giving us an upside copper price forecast of US$7,120/t and a downside of US$5,680/t.
Our silver price forecasts are derived from those for our gold price and the long-term relationship between the silver and the gold prices since 1971 (when the link between the gold price and the dollar was broken by President Nixon). This analysis has an R2 value of 0.90, which is statistically significant at the 5% level. The regression results in a base case silver price forecast that averages at US$24/oz over the LOM, with a standard error of US$3.4/oz.
We have also run upside and downside scenarios that add and subtract the standard error to and from our base case silver price forecasts, giving us an upside average LOM silver price of US$28/oz and a downside of US$21/oz.
Pre-feasibility study assumptions
We base our forecasts and valuation of MOD on the base case of the PFS completed in January 2018 and any improvements expected in the FS, such as coarser grind size and larger plant capacity have not been included. The key operational variables used in our discounted dividend model are outlined in Exhibit 20. We note that the throughput and coarser grind size announced in July 2018, which is expected to be incorporated into the FS.
Exhibit 20: Variables used in T3 valuation
T3 |
2019 |
2020 |
2021 |
2022 |
2023 |
2024 |
2025 |
2026 |
2027 |
Total/ |
Year to 31 December |
0 |
1 |
2 |
3 |
4 |
5 |
6 |
7 |
8 |
|
Copper price (US$/t) |
6,400 |
6,400 |
6,400 |
6,400 |
6,400 |
6,400 |
6,400 |
6,400 |
6,400 |
6,400 |
Silver price (US$/oz) |
22 |
26 |
25 |
23 |
23 |
22 |
22 |
23 |
25 |
24 |
Ore mined (t) |
- |
997,542 |
2,460,825 |
2,510,269 |
2,502,040 |
2,519,427 |
2,501,599 |
2,496,152 |
2,503,704 |
21,428,061 |
Waste mined (t) |
5,867,999 |
15,274,056 |
11,829,174 |
12,651,062 |
12,585,292 |
12,513,904 |
12,490,733 |
10,902,907 |
5,782,833 |
102,088,018 |
Copper grade (%) |
- |
0.9 |
1.0 |
1.0 |
1.1 |
1.1 |
1.0 |
1.0 |
1.0 |
1.0 |
Silver grade (g/t) |
- |
6.3 |
9.4 |
8.3 |
11.7 |
10.8 |
10.2 |
10.2 |
10.9 |
10.1 |
Concentrate produced (t) |
- |
24,410 |
80,782 |
76,543 |
77,075 |
72,171 |
68,233 |
65,577 |
61,461 |
593,563 |
Copper recovery (%) |
- |
93 |
93 |
93 |
93 |
93 |
93 |
93 |
93 |
93.00 |
Silver recovery (%) |
- |
86 |
86 |
86 |
86 |
86 |
86 |
86 |
86 |
86.00 |
Contained copper (t) |
- |
7,939 |
23,839 |
22,275 |
26,614 |
25,263 |
23,201 |
23,065 |
23,902 |
202,334 |
Contained silver (oz) |
- |
173,835 |
637,524 |
579,342 |
808,460 |
750,019 |
706,863 |
702,082 |
756,300 |
6,080,456 |
Copper payablitiy (%) |
- |
96.5 |
96.5 |
96.5 |
96.5 |
96.5 |
96.5 |
96.5 |
96.5 |
96.5 |
Silver payability (%) |
- |
90.0 |
90.0 |
90.0 |
90.0 |
90.0 |
90.0 |
90.0 |
90.0 |
90.0 |
Opex per tonne (US$/t) |
- |
(36.3) |
(35.3) |
(31.6) |
(32.2) |
(31.5) |
(31.4) |
(29.9) |
(25.3) |
(300.0) |
Sustaining capex (US$m) |
- |
- |
(6.8) |
(2.7) |
(2.8) |
(2.9) |
(3.3) |
(3.3) |
(2.8) |
(30.5) |
AISC (US$m) |
- |
(36.2) |
(93.7) |
(82.2) |
(83.4) |
(82.4) |
(81.8) |
(78.0) |
(66.1) |
(675.6) |
Development capex (US$m) |
(9) |
(101) |
(45) |
(13) |
- |
- |
- |
- |
- |
(168) |
Source: Edison Investment Research. Note: 2028 and 2029 not shown.
Capex
We use the PFS base case to forecast that MOD will require US$131.8m in mine development capex and US$35.8m in capitalised operating costs to build and construct the plant and mine and move from developer to producer. This totals c US$168m, which is higher than the US$155m quoted in MOD’s base case PFS. This is because we include the mine development capex from 2022 in our estimate (US$13m; MOD includes the pre-commercial production capex in its estimate). We also forecast that MOD will require an additional A$28m to fund ongoing exploration and working capital over the next three years, which we factor into our valuation.
Funding
We estimate that MOD will finish FY18 with a net cash position of A$9.8m. Based on our estimates of the capex scheduling, exploration budgeting and cash flow from the mine for 2019 and 2020, we believe MOD will have a peak funding requirement of c A$165m (c US$120m), which includes exploration, development and working capital costs. We note that the discrepancy between the funding requirement and the development capex and costs is due to the modelled cash flow generation by the project in 2020/21. If the company fails to generate sufficient cash flow (for example, due to project development delays) it may need to raise additional funds.
For the purposes of our model, we envisage the project will be funded from a mixture of 60% debt and 40% equity. We assume the equity component of the funding is raised at the current share price (0.18p per share). For the debt we assume an interest rate of 10% payable annually in arrears.
Operational metrics
We forecast that production from T3 will start in H220; during the ramp-up phase, we forecast the production of 24,000t of copper-silver bearing concentrate in 2020, increasing to 81,000t in 2021 and declining to 77,000t in 2022 (Exhibit 21). We forecast that the deposit will generate revenue of A$73m in 2020, increasing to A$223m in 2021, the first year of full production (Exhibit 22). Over the initial nine-year mine life, we expect total revenue to be A$1.9bn. We forecast MOD will generate an average EBITDA per year of A$93m (Exhibit 23), totalling A$931m over LOM.
|
Exhibit 21: Forecast production from T3 |
|
|
Source: Edison Investment Research |
|
Exhibit 22: Forecast revenue from T3 |
|
|
Source: Edison Investment Research |
|
Exhibit 23: Forecast EBITDA from T3 |
|
|
Source: Edison Investment Research |
Valuation
MOD trades on an enterprise value per attributable copper equivalent tonne of £56/t. This compares to an average of £99/t for its copper-focused and London-listed peer group that has projects at a similar development stage (Exhibit 24).
Exhibit 24: Copper-focused and London-listed peer group
Company |
EV (£m) |
Project |
Location |
Ownership (%) |
Total (M, I & I) mineral resource estimate |
Attributable CuE tonnage (t) |
EV/ attributable CuE tonnage (£/t) |
||||
Tonnage (Mt) |
CuE grade (%) |
Contained CuE tonnage (t) |
|||||||||
Georgian Mining |
5.9 |
Kvemo Bolnisi |
Georgia |
50 |
3.2 |
0.9 |
28,759 |
14,380 |
408.9 |
||
Phoenix Global Mining |
6.8 |
Empire |
US |
80 |
21.4 |
0.8 |
162,278 |
129,823 |
52.7 |
||
Anglesey Mining |
6.4 |
Paris Mountain |
Wales |
100 |
6.2 |
3.4 |
209,019 |
209,019 |
30.4 |
||
SolGold |
625.4 |
Alpala |
Ecuador |
85 |
2,950.0 |
0.5 |
15,501,889 |
13,176,606 |
47.5 |
||
Cradle Arc |
63.9 |
Mowana |
Botswana |
60 |
75.0 |
1.1 |
860,235 |
516,141 |
123.8 |
||
Great Western Mining |
0.3 |
M2 |
US |
100 |
4.3 |
0.5 |
19,260 |
19,260 |
17.1 |
||
Asiamet Resources |
38.0 |
KSK |
Indonesia |
100 |
66.9 |
0.6 |
421,900 |
421,900 |
10.9 |
||
0.8 |
5.0 |
37,776 |
37,776 |
||||||||
1.1 |
1.2 |
13,203 |
13,203 |
||||||||
KSK - Total |
68.8 |
0.7 |
472,879 |
472,879 |
|||||||
Beutong |
80 |
511.0 |
0.6 |
3,181,474 |
2,545,179 |
||||||
Total |
N/A |
579.8 |
0.6 |
3,654,353 |
3,490,938 |
||||||
|
|
|
|
|
|
|
Peer group average (£/t) |
98.8 |
|||
MOD |
39.5 |
T3 |
Botswana |
100 |
60.2 |
1.1 |
654,481 |
654,481 |
55.8 |
||
T1 |
2.5 |
2.1 |
53,678 |
53,678 |
|||||||
Total |
62.9 |
1.1 |
708,159 |
708,159 |
|||||||
|
Source: Edison Investment Research |
|||||||||||
We value MOD using a SOTP method. Different valuation techniques have been used for projects at different stages. For the T3 deposit we used a discounted dividend analysis (DDM) and value the project at £0.32 per share (Exhibit 25). For the T1 deposit, we use the contained CuE and the peer group multiple to arrive at a valuation of £0.02 per share.
We valued the other earlier-stage exploration targets on a relative DDM and peer group basis taking into account the likelihood of another T3 (60%) and/or T1 (60%) discovery and applying discounts that reflect the stage of exploration (75%). As a result, we arrive at a valuation of £0.05 per share for the exploration projects. Our total valuation of MOD is £0.39 per share and upside of 117%.
|
Exhibit 25: Valuation summary |
|||||||||||||||||||||
|
|||||||||||||||||||||
|
Source: Edison Investment Research |
|||||||||||||||||||||
Valuation sensitivities
Given its stage of development, the metrics and valuation of the T3 deposit will be affected by variables such as changes in metal recovery, stripping ratio or production volumes, capital and operation costs and funding mechanisms, and associated interest rates or dilution. As MOD continues its work to move the project from the PFS to FS stage, we would expect these variables to change.
We stress-tested our valuation of MOD for variations of ±10% and ±20% for capex, opex, price of shares issued for the purpose of the modelled equity raise, interest rate on debt and metals prices (Exhibit 26 and 27).
The biggest influence on the T3 deposit economics and our valuation of MOD is the metal price used in the assumptions (Exhibit 26 and 27). Changes in capex and opex overall have a relatively moderate impact on our valuation whereas changes in MOD’s share price and potential interest rate on debt have a relatively minor effect.
Importantly, even with a 20% reduction in the copper and silver prices used for T3, our valuation of MOD, £0.19 per share, is still above its current share price, £0.18. This demonstrates the robust nature of the T3 project and the undervalued nature of MOD. Downside changes in all the other variables ranged between £0.29 and £0.38 per share, which is well above that of MOD’s current share price, demonstrating relatively limited downside risk to our valuation. Upside changes in all other variables ranged between £0.39 and £0.53 per share, demonstrating significant potential upside to our valuation (Exhibit 26 and 27).
|
Exhibit 26: Changes in valuation caused by changes in each key variable |
|
|
Source: Edison Investment Research |
Exhibit 27: Table of changes in valuation (£) caused by changes in each key variables
Variable |
Capex |
Opex |
Share price |
Interest rate |
Metal price |
20% |
0.34 |
0.28 |
0.42 |
0.38 |
0.69 |
10% |
0.36 |
0.33 |
0.40 |
0.39 |
0.52 |
Base case |
0.39 |
0.39 |
0.39 |
0.39 |
0.39 |
-10% |
0.44 |
0.45 |
0.37 |
0.39 |
0.27 |
-20% |
0.49 |
0.53 |
0.35 |
0.39 |
0.19 |
Source: Edison Investment Research
Financials
MOD had net cash of A$17.2m at 30 June 2018 and A$12.8m at 30 September 2018. During H218 a small number of options were exercised and no equity fundraisings were completed. There has been a non-cash issue of shares (17m) and options (40.7m) associated with the acquisition of the outstanding 30% interest in T3 from Metal Tiger. We forecast that administrative expenses in FY18 will be higher than previous years, A$5m vs A$2.5m in FY17. This is due to additional costs relating to the acquisition of the 30% interest in T3 and the listing on the LSE. We expect these to reduce in FY19. In our forecasts we assume MOD raises around A$20m in equity and A$10m in debt in 2019 to fund initial development costs, exploration costs and working capital. Funding requirements increase to A$45m in equity and A$90m in debt in 2020. These estimates are based on the assumption that the project starts generating positive cash flow in 2020. If this does not materialise, MOD may need to raise more funds for development and operational activity. It should also be noted that this is not based on any guidance from MOD and the company is looking at all options available to fund the development costs associated with T3.
Exhibit 28: Financial summary
A$'000s |
2016 |
2017 |
2018e |
2019e |
2020e |
2021e |
||
31 December |
IFRS |
IFRS |
IFRS |
IFRS |
IFRS |
IFRS |
||
INCOME STATEMENT |
||||||||
Revenue |
|
|
0.0 |
0.0 |
0.0 |
0.0 |
73,795.9 |
224,735.3 |
Cost of Sales |
0.0 |
0.0 |
0.0 |
0.0 |
(50,324.0) |
(120,852.8) |
||
Gross Profit |
0.0 |
0.0 |
0.0 |
0.0 |
23,471.9 |
103,882.5 |
||
EBITDA |
|
|
(1,069.3) |
(2,511.1) |
(5,000.0) |
(3,150.0) |
20,164.4 |
100,409.7 |
Normalised operating profit |
|
|
(1,080.6) |
(2,551.2) |
(5,000.0) |
(3,150.0) |
9,164.4 |
60,409.7 |
Amortisation of acquired intangibles |
0.0 |
0.0 |
0.0 |
0.0 |
0.0 |
0.0 |
||
Exceptionals |
(402.3) |
(66.1) |
0.0 |
0.0 |
0.0 |
0.0 |
||
Share-based payments |
(319.2) |
(1,074.0) |
(5,639.7) |
0.0 |
0.0 |
(13,422.3) |
||
Reported operating profit |
(1,802.1) |
(3,691.3) |
(10,639.7) |
(3,150.0) |
9,164.4 |
46,987.4 |
||
Net Interest |
(103.7) |
222.6 |
0.0 |
(1,000.0) |
(8,740.9) |
(8,821.4) |
||
Joint ventures & associates (post tax) |
0.0 |
0.0 |
0.0 |
0.0 |
0.0 |
0.0 |
||
Exceptionals |
0.0 |
0.0 |
0.0 |
0.0 |
0.0 |
0.0 |
||
Profit before tax (norm) |
|
|
(1,184.3) |
(2,328.5) |
(5,000.0) |
(4,150.0) |
423.5 |
51,588.3 |
Profit before tax (reported) |
|
|
(1,905.8) |
(3,468.6) |
(10,639.7) |
(4,150.0) |
423.5 |
38,166.0 |
Reported tax |
0.0 |
0.0 |
0.0 |
0.0 |
0.0 |
(8,396.5) |
||
Profit after tax (norm) |
(1,184.3) |
(2,328.5) |
(5,000.0) |
(4,150.0) |
423.5 |
43,191.8 |
||
Profit after tax (reported) |
(1,905.8) |
(3,468.6) |
(10,639.7) |
(4,150.0) |
423.5 |
29,769.5 |
||
Minority interests |
(30.5) |
(2.7) |
0.0 |
0.0 |
0.0 |
0.0 |
||
Discontinued operations |
(15.0) |
(57.2) |
0.0 |
0.0 |
0.0 |
0.0 |
||
Net income (normalised) |
(1,214.8) |
(2,331.2) |
(5,000.0) |
(4,150.0) |
423.5 |
43,191.8 |
||
Net income (reported) |
(1,951.2) |
(3,528.6) |
(10,639.7) |
(4,150.0) |
423.5 |
29,769.5 |
||
Basic average number of shares outstanding (m) |
131 |
131 |
182 |
224 |
302 |
395 |
||
EPS – basic normalised (c) |
|
|
(0.01) |
(0.01) |
(0.02) |
(0.01) |
0.00 |
0.09 |
EPS – diluted normalised (c) |
|
|
(0.01) |
(0.01) |
(0.02) |
(0.01) |
0.00 |
0.08 |
EPS – basic reported (c) |
|
|
(0.01) |
(0.02) |
(0.05) |
(0.01) |
0.00 |
0.06 |
Dividend (c) |
0.00 |
0.00 |
0.00 |
0.00 |
0.00 |
0.00 |
||
Revenue growth (%) |
0.0 |
0.0 |
0.0 |
0.0 |
100.0 |
204.5 |
||
Gross margin (%) |
0.0 |
0.0 |
0.0 |
0.0 |
31.8 |
46.2 |
||
EBITDA margin (%) |
0.0 |
0.0 |
0.0 |
0.0 |
27.3 |
44.7 |
||
Normalised operating margin (%) |
0.0 |
0.0 |
0.0 |
0.0 |
12.4 |
26.9 |
||
BALANCE SHEET |
||||||||
Fixed assets |
|
|
15,806.9 |
22,205.0 |
37,205.0 |
61,359.2 |
198,871.3 |
238,946.8 |
Intangible assets |
15,735.5 |
21,431.2 |
36,431.2 |
48,431.2 |
56,431.2 |
64,431.2 |
||
Tangible assets |
71.4 |
773.8 |
773.8 |
12,928.0 |
142,440.1 |
174,515.6 |
||
Investments & other |
0.0 |
0.0 |
0.0 |
0.0 |
0.0 |
0.0 |
||
Current assets |
|
|
5,840.7 |
14,190.8 |
14,256.5 |
17,011.2 |
27,830.2 |
51,009.9 |
Stocks |
0.0 |
0.0 |
0.0 |
0.0 |
2,830.5 |
8,620.0 |
||
Debtors |
245.3 |
644.5 |
800.0 |
1,000.0 |
6,065.4 |
18,471.4 |
||
Cash & cash equivalents |
5,546.1 |
9,997.5 |
9,907.7 |
12,498.9 |
12,591.5 |
11,786.2 |
||
Other |
49.3 |
3,548.8 |
3,548.8 |
3,512.3 |
6,342.8 |
12,132.2 |
||
Current liabilities |
|
|
(2,133.7) |
(2,580.0) |
(7,444.8) |
(7,144.8) |
(14,821.8) |
(29,095.8) |
Creditors |
(603.2) |
(1,935.3) |
(2,000.0) |
(1,800.0) |
(4,136.2) |
(9,933.1) |
||
Tax and social security |
0.0 |
0.0 |
0.0 |
0.0 |
0.0 |
(8,396.5) |
||
Short-term borrowings |
(1,500.0) |
(565.2) |
(65.2) |
(65.2) |
(65.2) |
(65.2) |
||
Other |
(30.5) |
(79.6) |
(5,379.6) |
(5,279.6) |
(10,620.4) |
(10,700.9) |
||
Long-term liabilities |
|
|
0.0 |
(44.4) |
0.0 |
(10,000.0) |
(100,000.0) |
(100,000.0) |
Long-term borrowings |
0.0 |
0.0 |
0.0 |
(10,000.0) |
(100,000.0) |
(100,000.0) |
||
Other long-term liabilities |
0.0 |
(44.4) |
0.0 |
0.0 |
0.0 |
0.0 |
||
Net assets |
|
|
19,513.9 |
33,771.3 |
44,016.7 |
61,225.6 |
111,879.7 |
160,860.9 |
Minority interests |
(1,106.5) |
(3,124.0) |
0.0 |
0.0 |
0.0 |
0.0 |
||
Shareholders' equity |
|
|
18,407.4 |
30,647.3 |
44,016.7 |
61,225.6 |
111,879.7 |
160,860.9 |
CASH FLOW |
||||||||
Operating cash flow before WC and tax |
(1,069.3) |
(2,511.1) |
(5,000.0) |
(3,150.0) |
20,164.4 |
100,409.7 |
||
Working capital |
(373.8) |
237.9 |
(135.2) |
(400.0) |
(5,559.7) |
(12,398.6) |
||
Exceptional & other |
0.0 |
0.0 |
0.0 |
0.0 |
0.0 |
0.0 |
||
Tax |
0.0 |
0.0 |
0.0 |
0.0 |
0.0 |
0.0 |
||
Net operating cash flow |
|
|
(1,443.1) |
(2,273.2) |
(5,135.2) |
(3,550.0) |
14,604.7 |
88,011.1 |
Capex |
(32.4) |
(651.4) |
0.0 |
(12,154.2) |
(140,512.1) |
(72,075.5) |
||
Acquisitions/disposals |
26.2 |
0.0 |
0.0 |
0.0 |
0.0 |
0.0 |
||
Net interest |
(237.1) |
212.5 |
0.0 |
0.0 |
(1,000.0) |
(8,740.9) |
||
Equity financing |
10,272.4 |
14,409.4 |
17,545.4 |
20,295.4 |
45,000.0 |
0.0 |
||
Exploration and Evaluation |
(4,311.4) |
(8,296.7) |
(15,000.0) |
(12,000.0) |
(8,000.0) |
(8,000.0) |
||
Other |
1,106.5 |
2,120.4 |
3,000.0 |
0.0 |
0.0 |
0.0 |
||
Net cash flow |
5,381.1 |
5,521.0 |
410.2 |
(7,408.8) |
(89,907.4) |
(805.3) |
||
Opening net debt/(cash) |
|
|
1,547.4 |
(4,046.1) |
(9,432.3) |
(9,842.5) |
(2,433.7) |
87,473.7 |
FX |
94.0 |
(44.1) |
0.0 |
0.0 |
0.0 |
0.0 |
||
Other non-cash movements |
118.4 |
(90.7) |
0.0 |
0.0 |
0.0 |
0.0 |
||
Closing net debt/(cash) |
|
|
(4,046.1) |
(9,432.3) |
(9,842.5) |
(2,433.7) |
87,473.7 |
88,279.0 |
Source: Company accounts, Edison Investment Research
|
|||||||||||||||||||||||||||||||||||||||
|
|
Research: Industrials
Norcros continues to deliver a progressive trading performance ahead of local market conditions and in line with management guidance. Its share price has risen this year, significantly outperforming the FTSE All Share Index, but the company’s rating remains in single-digit P/E territory. It seems that re-rating will be a gradual process but there is plenty of evidence to suggest that this can continue.