Martin Currie Asia Unconstrained Trust (MCP) aims to deliver growth in line with nominal Asia ex-Japan GDP on a rolling three-year basis. It follows a detailed, bottom-up approach to investing in a concentrated portfolio of 20–30 of Asia’s highest-quality and most sustainable businesses, unconstrained by a benchmark. Although market conditions have become more challenging for Asian equities, MCP’s manager Andrew Graham believes the portfolio’s high-quality companies are poised to do well in this environment. He also notes the trust’s performance is less volatile than the MSCI AC Asia ex-Japan index. A dividend policy change in 2017 allowing payment from capital reserves, in addition to revenue income, has materially increased MCP’s yield. Unlike one-off special dividends, it is the board’s intention for this higher overall payout to endure. At 4.9%, MCP’s dividend yield is one of the highest among peers.
Written by
Martin Currie Asia Unconstrained Trust |
Deep discount and attractive yield |
Investment trusts |
9 November 2018 |
Share price/discount performance
Three-year performance vs index
Gearing
Analysts
|
|||||||||||||||||||||||||||||||||||||||||||||||||||||||||||||||||||||||||||||||||||||||||||||
Martin Currie Asia Unconstrained Trust (MCP) aims to deliver growth in line with nominal Asia ex-Japan GDP on a rolling three-year basis. It follows a detailed, bottom-up approach to investing in a concentrated portfolio of 20–30 of Asia’s highest-quality and most sustainable businesses, unconstrained by a benchmark. Although market conditions have become more challenging for Asian equities, MCP’s manager Andrew Graham believes the portfolio’s high-quality companies are poised to do well in this environment. He also notes the trust’s performance is less volatile than the MSCI AC Asia ex-Japan index. A dividend policy change in 2017 allowing payment from capital reserves, in addition to revenue income, has materially increased MCP’s yield. Unlike one-off special dividends, it is the board’s intention for this higher overall payout to endure. At 4.9%, MCP’s dividend yield is one of the highest among peers.
12 months ending |
Share price |
NAV |
Benchmark* (%) |
MSCI AC Asia ex-Japan (%) |
3Y GDP growth Asia ex-Japan (%) |
31/10/14 |
(1.5) |
0.0 |
1.6 |
6.4 |
10.1 |
31/10/15 |
(6.9) |
(8.4) |
7.7 |
(3.6) |
7.7 |
31/10/16 |
32.9 |
34.9 |
8.6 |
35.2 |
8.6 |
31/10/17 |
19.0 |
16.3 |
10.8 |
20.3 |
10.8 |
31/10/18 |
(8.6) |
(9.6) |
12.8 |
(10.0) |
12.8 |
Source: Thomson Datastream, IMF, Edison Investment Research. Note: All % on a total return basis in GBP. *Three-year rolling nominal GDP.
Investment strategy: Thorough bottom-up approach
MCP follows a detailed bottom-up investment process to find companies with sustainable growth, strong management and a strategic market position. Graham is supported by a well-resourced team of six other portfolio managers/analysts who undertake detailed evaluation of a company’s fundamentals and governance structure to build high conviction in its potential investments. The result is a diversified portfolio of 20–30 companies with high returns on equity and strong balance sheets.
Market outlook: Good long-term growth prospects
Market conditions are challenging for Asian equities in an environment of rising interest rates, slowing economic growth and higher oil prices (as the region is a net importer of oil). The MSCI AC Asia ex-Japan index has fallen c 26% since its peak in January 2018, bringing valuations back to slightly below 10-year averages. Meanwhile, longer-term prospects for the region’s economic growth remain stronger than for the world and advanced economies.
Valuation: Discount of 12.7% to cum-income NAV
MCP is trading on a discount of 12.7% to its cum-income NAV, which is narrower than the three-year average of 13.9%. The weakness in Asian equities has affected all funds in the sector and discounts have widened across the board. The trust’s 4.9% dividend yield is comparable to income-focused funds.
Exhibit 1: Trust at a glance
Investment objective and fund background |
Recent developments |
||||||||||||||||||||||||||||||||||||||||||||||||||||||||||||||||||||||
Martin Currie Asia Unconstrained Trust aims to achieve returns commensurate with Asia ex-Japan nominal GDP growth, unconstrained by an equity benchmark, over a long-term time horizon from a concentrated portfolio of 20–30 stocks. Before its change of investment objective in August 2014, it invested in a pan-Asian portfolio with a benchmark of MSCI AC Asia Pacific (Japan fixed at 25%). |
■ 11 July 2018: AGM - shareholders voted in favour of continuation of the trust. ■ 7 June 2018: annual report for 12 months ending 31 March 2018. NAV TR +6.3% versus benchmark TR+12.0%. Share price TR +9.8%. ■ 7 June 2018: declaration of final dividend of 14.0p per share. ■ 16 November 2017: interim report for six months ending 30 September 2017. NAV TR +3.6% versus benchmark TR+7.8%. Share price TR +6.8%. |
||||||||||||||||||||||||||||||||||||||||||||||||||||||||||||||||||||||
Forthcoming |
Capital structure |
Fund details |
|||||||||||||||||||||||||||||||||||||||||||||||||||||||||||||||||||||
AGM |
July 2019 |
Ongoing charges |
FY18 1.08% (see page 7) |
Group |
Martin Currie Investment Management |
||||||||||||||||||||||||||||||||||||||||||||||||||||||||||||||||||
Interim results |
November 2018 |
Net gearing |
2.3% end-September 2018 |
Manager |
Andrew Graham |
||||||||||||||||||||||||||||||||||||||||||||||||||||||||||||||||||
Year end |
31 March |
Annual mgmt fee |
Tiered, 0.60–0.75% of net assets |
Address |
Saltire Court, 20 Castle Terrace, Edinburgh EH1 2ES |
||||||||||||||||||||||||||||||||||||||||||||||||||||||||||||||||||
Dividend paid |
December and August |
Performance fee |
None |
||||||||||||||||||||||||||||||||||||||||||||||||||||||||||||||||||||
Launch date |
1985 |
Trust life |
Indefinite |
Phone |
0131 229 5252 |
||||||||||||||||||||||||||||||||||||||||||||||||||||||||||||||||||
Continuation vote |
Three yearly, next in July 2021 |
Loan facilities |
£15m (see page 7) |
Website |
|||||||||||||||||||||||||||||||||||||||||||||||||||||||||||||||||||
Dividend policy and history (financial years) |
Share buy-back policy and history (financial years) |
||||||||||||||||||||||||||||||||||||||||||||||||||||||||||||||||||||||
MCP pays dividends twice a year in December and August. It has recently changed its dividend policy (see details on page 7). |
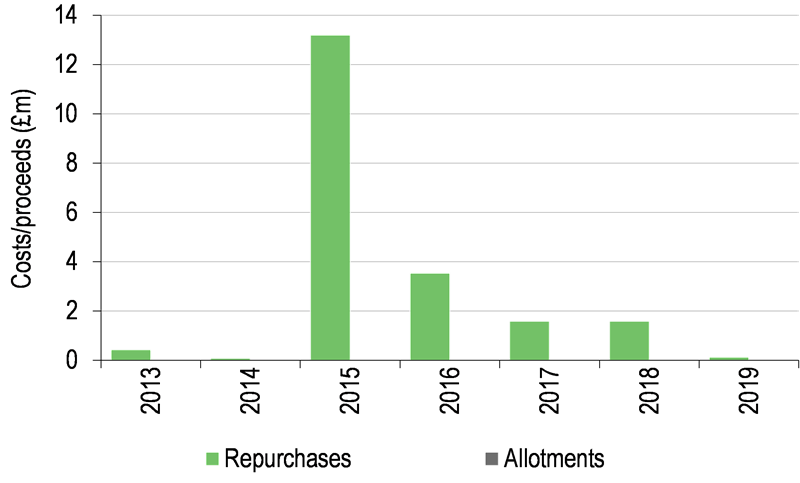
MCP is authorised to repurchase up to 14.99% and allot up to 5% of its ordinary shares. A tender offer for 10% of the issued shares was made in August 2014. |
||||||||||||||||||||||||||||||||||||||||||||||||||||||||||||||||||||||
|
|
||||||||||||||||||||||||||||||||||||||||||||||||||||||||||||||||||||||
Shareholder base (as at 30 September 2018) |
Portfolio exposure by sector (as at 30 September 2018) |
||||||||||||||||||||||||||||||||||||||||||||||||||||||||||||||||||||||
|
|
||||||||||||||||||||||||||||||||||||||||||||||||||||||||||||||||||||||
Top 10 holdings (as at 30 September 2018) |
|||||||||||||||||||||||||||||||||||||||||||||||||||||||||||||||||||||||
|
|||||||||||||||||||||||||||||||||||||||||||||||||||||||||||||||||||||||
Source: Martin Currie Asia Unconstrained Trust, Edison Investment Research, Bloomberg. Note: *N/A where not in September 2017 top 10.
Market outlook: Asia better value after sharp correction
The MSCI Asia ex-Japan index performed strongly between early 2016 and early 2018, fuelled by synchronous global growth, exceptionally accommodative monetary conditions and positive earnings momentum. Many of these factors are now reversing as interest rates rise, while global leading economic indicators have started to roll over (although they remain strong in the US, underpinned by the impact of recent tax reforms). Expectations for Asian earnings growth have also moderated considerably, following an exceptionally strong 2017. Consensus forecasts for the MSCI AC Asia ex-Japan index earnings in 2018 started the year at around 14%, and are around 5%. Headwinds for the region include higher oil prices (Asia is a net importer of oil) and escalating trade tensions between China and the US. These challenges have been reflected in a correction in the MSCI Asia ex-Japan index of around 26% since late-January 2018. This is significantly sharper than that experienced by global equities, which have been bolstered by the strength of US equities. As shown in Exhibit 2 (RHS), Asian valuations, in forward P/E multiple terms, have fallen meaningfully this year, are at a significant c 16% discount to world equities, and are towards the lowest levels seen over the past 10 years. Meanwhile, as shown in Exhibit 2 (LHS), prospects for economic growth in Asia ex-Japan remain higher than for the world and advanced economies. According to the International Monetary Fund’s World Economic Outlook report in October 2018, the Asian region is expected to grow at 5.7% per year between 2018 and 2023. Over the same period, it expects world growth of 3.6% per year and 1.8% per year for advanced economies.
|
Exhibit 2: Asia ex-Japan vs advanced and world markets – GDP growth and valuation metrics |
|
GDP growth rates – emerging Asia vs advanced economies and world |
DS Asia ex-Japan vs DS World valuation comparison |
|
|
|
Source: IMF WEO October 2018, Thomson Datastream, Edison Investment Research. Note: Valuation date as at 8 November 2018. |
|
Fund profile: High quality, lower volatility
MCP adopted Martin Currie’s Asia Long-Term Unconstrained (ALTU) strategy in August 2014. It aims to achieve returns in line with Asia ex-Japan’s nominal GDP growth over a rolling three-year period, which conventional indices have failed to deliver over the past 10 years. The manager follows a rigorous bottom-up approach, unconstrained by a benchmark, seeking to invest in Asia’s highest quality and most sustainable businesses with a long-term view. The portfolio is relatively concentrated with 20–30 stocks; companies have conservative balance sheets and average dividend pay-out ratios of c 35%. The ALTU strategy has delivered less volatile returns than the MSCI AC Asia ex-Japan index. The team is well resourced and manager, Andrew Graham, is supported by six other portfolio managers/analysts based in Edinburgh and Singapore. A new dividend policy, in place since 2017, makes annual payments from capital reserves, in addition to revenue income. This has raised the trust’s dividend materially without altering its capital growth objective, and the current yield of 4.9% is one of the highest among peers.
The fund manager: Andrew Graham
The manager’s view: Outlook challenging but not pessimistic
Graham believes the environment for Asian equities is challenging given rising interest rates, decelerating economic growth and increasing oil prices (made more painful because many Asian currencies have weakened considerably this year). An escalating trade dispute between the US and China is also unwelcome. However, the manager thinks some of the pessimistic sentiment towards the region is unwarranted; for example, the US-China trade dispute is not as damaging as headlines may suggest. The team have analysed the implications of all announced and proposed tariffs, and find the probable impact to China’s GDP growth to be relatively modest. China’s economy has rebalanced over time and net exports are no longer a major contributor to its GDP growth, now around 10%. The team expects the tariffs could reduce China’s annual GDP growth by around 0.5%, which while unwelcome, is not disastrous in the context of expected growth of around 6–6.5% pa.
The manager also believes many governments have policy levers available to help stabilise their economies, should the environment get considerably worse. Most countries have had a tightening bias over the past year and have the scope to reverse this stance (although with currencies generally weaker, he senses a reluctance to ease monetary policy). More fiscal and targeted policies can be deployed, including changes in banks’ reserve requirements, or large infrastructure spending programmes. Graham cites China as an example, where income tax cuts were announced recently to come into effect later this year, and there are expectations for tariff cuts on purchases of smaller-sized cars.
Graham notes that corporate balance sheets in Asia are in relatively good shape, with aggregate cash of around $2tn. There has been modest buyback activity, and should equity valuations continue to fall, the manager would expect to see an increase in mergers and acquisitions, which could be very value accretive. Asian equity valuations are now slightly below their 10-year averages, a level that has historically proved rewarding to longer-term investors.
Asset allocation
Investment process: Bottom-up, detailed and disciplined
The trust follows Martin Currie’s ALTU strategy, which has combined assets of c £2bn under management (including MCP). The bottom-up investment process is unconstrained by a benchmark and has an absolute-return approach with a long-term horizon. It looks for companies with three key characteristics: sustainable growth, strong management and a strategic market position. Graham and the team use screens to help generate ideas, focusing on multiple criteria including cash flow returns on investment, returns on capital, earnings yield, valuation and relative performance. All companies are valued on their long-term cash flow potential, applying a 10% cost of equity – the minimum required rate of return on investment. Investment ideas are subject to several stages of analysis, progressively going into greater detail to build an operational and strategic understanding of the business. As a long-term investor, the manager needs to build high conviction in potential investee companies. These undergo a detailed third-party accounting diagnostic report, scrutinising financial data for at least the last five years. The reports also help guide the agenda for meetings with company management. Evaluation of a company’s governance structure and decision-making processes are also a key contributor to the manager’s level of conviction.
The concentrated portfolio of 20–30 holdings allows for each position to make a meaningful contribution to performance, while also allowing for a reasonable degree of diversification. Risk management is integrated into the investment process and, at the stock level, is mitigated through selecting high quality companies. At the portfolio level, MCP is diversified by sector and country. The manager monitors the correlations of the stocks held to ensure appropriate diversification, reducing vulnerability to external events or style biases.
Current portfolio positioning
Exhibit 3 shows the end-September 2018 portfolio is diversified across nine countries in Asia. Relative to the MSCI AC Asia ex-Japan index, India (20.5%) is MCP’s most overweight position by 10.8pp. Around half of this exposure is in two stocks, Infosys and Tata Consultancy Services, which are both global leaders in information technology and outsourcing services. While listed in India, they derive the majority of revenues and earnings from developed markets. The other half of the India exposure is focused on the domestic economy, in particular, opportunities arising from the long-term secular trend for rising incomes. Investments include HDFC Bank, which is well placed to gain market share from public sector banks and capture the growth in financial penetration from urbanisation and a rapidly growing middle class. MCP also holds motorcycle manufacturer Hero Motocorp and automobile manufacturer Maruti Suzuki India. The manager believes these two companies have secular multi-year growth potential supported by very low passenger vehicle penetration rates in India, which are well below those in Indonesia and China, let alone those in more developed markets.
|
Exhibit 3: Geographical exposure at 30 September 2018 |
Exhibit 4: Portfolio characteristics |
||||||||||||||||||||||||
|
|
||||||||||||||||||||||||
|
Source: Martin Currie Asia Unconstrained Trust, Edison Investment Research. Note: Net of gearing. |
Source: Martin Currie and UBS PAS at 30 September 2018. Note: *Indicates consensus. |
|
Exhibit 3: Geographical exposure at 30 September 2018 |
||||||||||||||||||||||||
|
||||||||||||||||||||||||
|
Source: Martin Currie Asia Unconstrained Trust, Edison Investment Research. Note: Net of gearing. |
||||||||||||||||||||||||
|
Exhibit 4: Portfolio characteristics |
||||||||||||||||||||||||
|
||||||||||||||||||||||||
|
Source: Martin Currie and UBS PAS at 30 September 2018. Note: *Indicates consensus. |
Recent purchases include Hong Kong-listed Minth, an auto parts manufacturer based in China. It started out as a manufacturer of relatively simple plastic decorative car parts for the domestic market, but the company has expanded over the years to become a leading global supplier of a broad range of higher value auto parts products. Its customers now include most of the world’s well-known global luxury brands, and the manager believes the firm can grow through challenging market conditions, by gaining share and increasing sales of higher value products. The China auto sector has been depressed by the tariffs recently imposed by the US, and a de-rating of Minth’s valuation gave the manager an opportunity to start building a position in the company.
MCP also recently purchased a position in ST Engineering, an integrated engineering group based in Singapore. The company has de-rated over the past few years as top-line growth stagnated at a time when investors favoured growth and momentum stocks. However, Graham believes the firm’s investments in recent years could start to bear fruit, which the market appears to underappreciate. He cites a number of developments that may support growth, including a strong aircraft maintenance and repair franchise, which is well placed to benefit from a proliferation in Asian air travel over many years.
Exhibit 4 shows MCP’s profile compared to the MSCI AC Asia ex Japan index. The portfolio’s companies generate higher returns on equity and are reasonably priced (on EV/EBIT terms). Most notable is underlying net cash of 8.4% compared to the index’s 27.3% net debt to equity position, reflecting the manager’s discipline to in investing in companies with sound balance sheets, which are often able to self-fund their own growth.
Performance: Outperformance over three years
MCP adopted the ALTU strategy in August 2014, measuring its performance against Asia ex-Japan’s nominal GDP growth on a three-year rolling basis. Therefore, the most relevant performance periods in Exhibits 5 and 6 are the since change and shorter periods. The trust has significantly performed its benchmark over three years; however, it has lagged the benchmark since change. It has also lagged the benchmark over one, three, six and 12 months, reflecting a recent sharp correction in Asian equities. Over these periods, MCP has performed broadly in line with the MSCI AC Asia ex-Japan index, which has fallen c 26% since its late-January 2018 peak.
|
Exhibit 5: Investment trust performance to 31 October 2018 |
||||||||
Price, NAV and blended benchmark TR performance, three years rebased |
Price, NAV and blended benchmark TR performance (%) |
|||||||
|
|
|||||||
|
Source: Thomson Datastream, Edison Investment Research. Note: Three and five-year performance figures annualised. |
||||||||
|
Exhibit 6: Share price and NAV total return performance, relative to indices (%) |
||||||||
|
One month |
Three months |
Six months |
One year |
Three years |
SC |
Five years |
|
Price relative to blended benchmark* |
(9.3) |
(15.8) |
(14.7) |
(19.0) |
6.5 |
(7.0) |
(10.8) |
|
NAV relative to blended benchmark* |
(10.3) |
(14.6) |
(15.5) |
(19.9) |
4.4 |
(9.2) |
(12.6) |
|
Price relative to MSCI AC Asia ex-Japan |
0.7 |
(2.9) |
1.7 |
1.6 |
(1.2) |
(4.3) |
(11.7) |
|
NAV relative to MSCI AC Asia ex-Japan |
(0.3) |
(1.6) |
0.8 |
0.4 |
(3.2) |
(6.5) |
(13.5) |
|
Price relative to MSCI World |
(3.1) |
(10.5) |
(14.4) |
(13.5) |
(6.3) |
(20.0) |
(26.2) |
|
NAV relative to MSCI World |
(4.1) |
(9.3) |
(15.1) |
(14.5) |
(8.2) |
(21.8) |
(27.7) |
|
|
Source: Thomson Datastream, Edison Investment Research. Note: Data to 30 September 2018. Geometric calculation. SC = since change of investment objective on 1 August 2014. *MSCI AC Asia Pacific Index (Japan fixed at 25%) from 1 July 2011 to 10 July 2014, and three-year rolling nominal Asian GDP growth from 1 August 2014. |
||||||||
Discount: Wider than the three-year average
MCP trades at a 12.7% discount to its cum-income NAV, which is narrower than the three-year average of 13.9% and towards the lower end of the range for that period of 9.6% to 20.9%. Asian equities have sold off this year as investors have become more risk averse. This relatively indiscriminate selling has afflicted all Asian equity funds, and discounts have widened across the peer group. The board is committed to managing the trust’s discount to NAV and aims to broaden the shareholder base of MCP. The change in dividend policy (see page 7) and marketing efforts to promote the trust may help towards this goal. MCP’s board also has the ability to repurchase shares (up to 14.99% of shares outstanding, renewable annually).
|
Exhibit 7: Share price discount to NAV (including income) over three years (%) |
|
|
Source: Thomson Datastream, Edison Investment Research |
Capital structure and fees
MCP is a conventional investment trust with one class of share; there are currently 36.1m ordinary shares outstanding and a further 3.4m shares held in treasury. Gearing is permitted, up to 20% of net assets and the trust has a £15m loan facility with RBS. As at end-September 2018, MCP had net gearing of 2.3%. The trust is subject to a continuation vote every three years, the most recent was held at the AGM on 11 July 2018; shareholders voted in favour.
Martin Currie is paid an annual management fee of 0.75% of net assets up to £150m, and 0.60% above £150m. It is allocated one-third to the revenue account and two-thirds to the capital account, reflecting the board’s expected long-term split of returns between income and capital gains. For FY18, MCP’s ongoing charge was 1.08% (1.14% in FY17).
Dividend policy and record
MCP pays dividends semi-annually in December and August. The board adopted a new dividend policy in 2017 to allow payments to be made from the capital account, set at 2% of the trust’s year-end ex-income NAV. The dividend from capital is payable in August, and is in addition to the dividends from revenue income, which are payable in December and August. Since the implementation of this new policy, MCP’s dividends have increased substantially to more than double the levels paid before the change (Exhibit 1). For FY18, MCP paid a total dividend of 16.70p per share (16.28p in FY17), representing a yield of 4.9%. The board intends to maintain the new dividend policy, subject to a review in the event of changes in market conditions or shareholder expectations, or if the trust incurs a financial year capital loss.
Peer group comparison
Exhibit 8 shows the members of the AIC Asia Pacific ex-Japan sector, which consists of 15 trusts. This group has a number of mandates, including those focused on income, smaller companies and the Pacific region (which includes Australasia) therefore direct comparisons may not be meaningful. MCP is the smallest trust in the peer group; despite this, its ongoing charge is broadly in line with the average. As the current strategy was adopted in August 2014, the most relevant periods for MCP’s NAV total return comparisons are one and three years, where MCP ranks 11th and 12th respectively. Following the change in dividend policy in 2017, the trust’s yield is significantly above average and comparable to those of income funds, ranking second. However, the discount to cum-fair NAV, however, is one of the deepest among peers, ranking 12th.
Exhibit 8: AIC Asia Pacific ex-Japan peer group as at 8 November 2018*
% unless stated |
Market cap £m |
NAV TR |
NAV TR |
NAV TR |
NAV TR 10 year |
Discount (cum-fair) |
Ongoing charge |
Perf. |
Net gearing |
Dividend yield (%) |
Martin Currie Asia Unconstrained |
124.1 |
(12.7) |
38.5 |
31.4 |
134.9 |
(13.1) |
1.1 |
No |
102 |
4.9 |
Aberdeen Asian Income |
348.9 |
(6.8) |
41.5 |
27.7 |
250.4 |
(9.6) |
1.1 |
No |
109 |
4.6 |
Aberdeen Asian Smaller |
336.8 |
(7.8) |
33.9 |
25.9 |
405.3 |
(15.3) |
1.2 |
No |
112 |
1.2 |
Aberdeen New Dawn |
236.4 |
(10.8) |
42.8 |
34.4 |
236.5 |
(13.7) |
0.8 |
No |
111 |
2.0 |
Edinburgh Dragon |
649.4 |
(9.8) |
40.1 |
35.6 |
229.6 |
(9.8) |
1.1 |
No |
102 |
1.1 |
Fidelity Asian Values |
269.2 |
(5.5) |
48.8 |
72.9 |
317.8 |
1.4 |
1.2 |
No |
100 |
1.4 |
Henderson Far East Income |
417.6 |
(6.9) |
38.9 |
37.1 |
195.1 |
2.3 |
1.1 |
No |
100 |
6.6 |
Invesco Asia |
182.3 |
(12.6) |
47.6 |
71.8 |
311.7 |
(11.8) |
1.0 |
No |
100 |
2.1 |
JPMorgan Asian |
303.9 |
(9.8) |
59.7 |
74.9 |
249.2 |
(10.6) |
0.7 |
No |
100 |
4.9 |
Pacific Assets |
314.1 |
(2.0) |
41.6 |
70.7 |
317.4 |
(0.5) |
1.3 |
No |
100 |
1.0 |
Pacific Horizon |
177.6 |
(15.8) |
50.1 |
62.0 |
275.0 |
2.6 |
1.0 |
No |
101 |
0.2 |
Schroder Asia Pacific |
670.3 |
(14.2) |
51.0 |
70.2 |
360.0 |
(11.5) |
1.0 |
No |
104 |
1.4 |
Schroder Asian Total Return Inv. Co |
299.7 |
(10.1) |
57.9 |
79.2 |
283.0 |
2.1 |
1.0 |
Yes |
102 |
1.5 |
Schroder Oriental Income |
604.7 |
(7.8) |
41.0 |
52.5 |
401.2 |
0.2 |
0.9 |
Yes |
102 |
4.1 |
Scottish Oriental Smaller Cos |
270.1 |
(12.1) |
27.9 |
36.2 |
429.6 |
(14.8) |
1.0 |
Yes |
100 |
1.3 |
Average |
347.0 |
(9.7) |
44.1 |
52.2 |
293.1 |
(6.8) |
1.0 |
103 |
2.6 |
|
Rank in sector (out of 15 trusts) |
15 |
11 |
12 |
13 |
15 |
12 |
6 |
8 |
2 |
Source: Morningstar, Edison Investment Research. Note: *Performance data to 7 November 2018. TR = total return. Net gearing is total assets less cash and equivalents as a percentage of net assets.
The board
The board has five directors, all of whom are independent and non-executive. Chairman Harry Wells was appointed a director in 2003 and assumed his current role in 2014. The senior independent director is Gregory Shenkman, appointed in 2007. The other members of the board and their years of appointment are Peter Edwards (2007), Anja Balfour (2012), and Martin Shenfield (2015).
|
|
Research: Industrials
Lookers maintained its outlook for the current year, notwithstanding supply-side disruption that created volatility in new car markets in Q318. Used car and aftersales activities remain healthy and Q318 trading was ahead against a strong Q317. There are signs of stabilisation in new car markets in Q418 and Lookers expects to deliver against market expectations for the full year. However, a more cautious view as Brexit looms leads us to reduce our FY19e EPS by 6%. Nevertheless, the undemanding rating remains supported by an attractive yield.