DBV Technologies
Written by
DBV Technologies |
Enlarged Phase III PEPITES study starts |
Pipeline update |
Pharma & biotech |
9 December 2015 |
ADR research
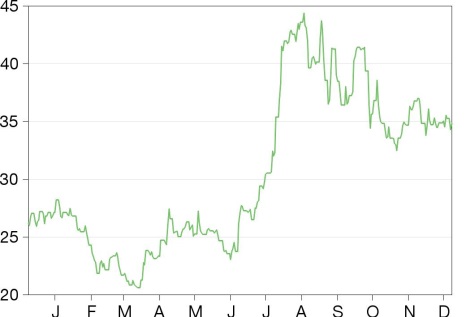
ADR share price performance
Business description
Next events
Analysts
DBV Technologies is a research client of Edison Investment Research Limited |
|||||||||||||||||||||||||||||||||||||||
DBV has now started the Phase III Viaskin Peanut trial (PEPITES), which has been enlarged to meet patient and investigator demand, a positive sign for future potential uptake. The Phase II Viaskin Milk trial (SMILEE) has also started as a potential treatment for EoE, a food-allergy related disease. The EoE trial broadens DBV’s focus beyond traditional food allergy, which includes peanut, cow’s milk and hen’s egg allergy.
Year end |
Revenue ($m) |
PTP* |
EPADS |
DPADS |
P/E |
Gross Yield |
12/13 |
4.2 |
(21.0) |
(0.77) |
0.0 |
N/A |
N/A |
12/14 |
5.2 |
(26.2) |
(0.82) |
0.0 |
N/A |
N/A |
12/15e |
7.0 |
(30.5) |
(0.71) |
0.0 |
N/A |
N/A |
12/16e |
7.4 |
(32.3) |
(0.67) |
0.0 |
N/A |
N/A |
Note: Converted at US$1.09 to €1.Investors should consult their tax advisor regarding the application of any domestic and foreign tax laws.
Viaskin Peanut: Start of enlarged PEPITES study
Recruitment has started in the Phase III PEPITES trial of Viaskin Peanut. Following increased demand and conversations with regulators, PEPITES will now recruit 330 4-11 year-olds (from 265) who react to <300mg of peanut protein (~1 peanut), and will assess 250µg of Viaskin Peanut. The primary endpoint will measure responders at 12 months, stratified according to peanut sensitivity; highly allergic patients who react to ≤10mg of peanut will only be considered a responder if the eliciting dose (the quantity of peanut protein that triggers an objective reaction) at month 12 is ≥300mg. Other patients will be deemed responders if they can consume ≥1,000mg.
Viaskin Milk: SMILEE trial for EoE underway
Recruitment recently commenced in the Phase IIa SMILEE study of Viaskin Milk in eosinophilic esophagitis (EoE). EoE is a food-mediated disease, which results in an inflamed oesophagus, leading to difficulties in swallowing, vomiting, stomach pains and heartburn. Around 70% of EoE is thought to relate to cow’s milk allergy. There is currently limited treatment available (steroids or food avoidance), with more traditional oral immunotherapy likely to induce symptoms. The SMILEE study will recruit 20 children (4-17 years), with 75% of subjects receiving 500µg of Viaskin Milk. The trial is being conducted by Dr Jonathan Spergel, a leading expert in EoE.
OLFUS-VIPES, CoFAR6 and MILES studies ongoing
The OLFUS-VIPES and CoFAR6 studies of Viaskin Peanut remain ongoing, with 24-month data from OLFUS-VIPES suggesting the effect of Viaskin Peanut can be improved with longer treatment duration. The Phase I/II MILES Viaskin Milk study recently progressed to the Phase II portion.
Valuation: rNPV increased to $1.85bn
Our rNPV-based valuation is increased to $1.85bn (from $1.36bn) or $38.4/ADS owing to incorporation of the July US public offering, which raised gross proceeds of $282m, in addition to an increased probability of 65% for Viaskin Peanut to reflect the improved treatment effect observed with longer-term therapy. Our valuation does not include any contribution for Viaskin Milk in EoE.
Pipeline update
DBV’s pipeline continues to broaden and expand beyond the main value driver, Viaskin Peanut. Importantly, DBV has now commenced the pivotal Phase III global PEPITES (Peanut EPIT Efficacy and Safety study) as expected. Further data from the ongoing OLFUS-VIPES trial, the open-label follow-on trial to VIPES, recently reported 24-month data demonstrating that an additional 12 months of treatment with Viaskin Peanut can increase the number of responders to therapy. These data are described in more detail below.
The Phase I/II MILES Viaskin Milk trial has successfully completed Part A (Phase I), the safety portion, investigating three doses of Viaskin Milk (150μg, 300μg and 500μg) in 18 patients (2-17 years), with the data safety monitoring board (DSMB) recommending continuation of the trial as planned. The first patient was recently recruited into Part B (Phase II), which will recruit up to 176 children with cow’s milk allergy. Patients will be equally randomized to receive one of the three doses of Viaskin Milk or placebo. The trial will measure responders at 12 months (defined as a 10-fold increase in consumption of cow’s milk protein during the food challenge, and at least 144mg of protein, equivalent to ~4.5ml of milk).
DBV is also planning to start a Phase I trial in pertussis (whooping cough) combining Viaskin technology with a pertussis toxin as a booster vaccine as part of a collaboration with the University of Geneva (UNIGE). Preclinical development of Viaskin Egg for hen’s egg allergy was also recently commenced.
OLFUS-VIPES shows improved treatment effect over time
83% of peanut allergy patients that completed the Phase II VIPES trial continued in the OLFUS-VIPES trial. Patients that elected to remain in OLFUS-VIPES were all switched to Viaskin Peanut 250µg. Therefore, patients who had previously received Viaskin Peanut during VIPES would be exposed to a further 12 months of treatment (for 24 months of overall treatment duration); patients who had received placebo would therefore be exposed to 12 months of active treatment with the highest dose of Viaskin Peanut.
Importantly, there were no serious adverse events (SAE) in OLFUS-VIPES and there was no drug-related epinephrine use, both of which are consistent with VIPES. Safety is paramount for Viaskin Peanut, which exposes highly allergic patients to a potentially fatal allergen. Compliance with the daily patch application was 96%, also in line with data from VIPES.
The overall responder rate in patients who received active treatment for 24 months increased to 70% (from 50% after 12 months treatment during VIPES). 50% of patients who received 12 months of active treatment through continuation in OLFUS VIPES (placebo patients during VIPES) responded to Viaskin Peanut, consistent with the 12-month treatment effect seen in VIPES. Children who received 24 months of Viaskin Peanut treatment at the highest 250µg dose reported an 80% response, increased from the 53.6% after 12 months of treatment and from 57.1% at the baseline of OLFUS-VIPES (adjusted for patients who continued into OLFUS-VIPES). Furthermore, the amount of peanut that could be consumed increased over time. These data suggest that longer-term treatment can lead to an improved outcome for patients, which is consistent with effects observed for allergy immunotherapy treatment, whereby patients generally receive treatment for around three years. The main VIPES and OLFUS-VIPES data are summarized in Exhibit 1.
As a reminder, the primary endpoint of VIPES defined a responder as either:
■
≥1,000mg peanut protein consumption at 12 months; or
■
≥10x more peanut protein consumption at 12 months compared to baseline.
Exhibit 1: Summary of key VIPES and OLFUS-VIPES data
All subjects |
Children (6-11 years) |
|||||||
n |
Responders |
p-value |
OLFUS-VIPES M24 responders |
n |
Responders |
p-value |
OLFUS-VIPES M24 responders |
|
Placebo |
56 |
25.0% |
31 |
19.4% |
||||
50µg |
53 |
45.3% |
0.0292 |
28 |
57.1% |
0.0035 |
||
100µg |
56 |
41.1% |
0.1074 |
26 |
46.2% |
0.0453 |
||
250µg |
56 |
50.0% |
0.0108 |
70.0% |
28 |
53.6% |
0.0076 |
80.0% |
Source: DBV Technologies
Valuation
We have made no significant changes to our underlying Viaskin Peanut or Viaskin Milk peak sales assumptions. For Viaskin Peanut we continue to only include penetration of the pediatric peanut allergy market and forecast peak sales of €1.9bn ($2.0bn) in the US and Europe assuming 15% penetration. We have slightly increased the probability of success to 65% (from 60%) for Viaskin Peanut, given the 24-month OLFUS-VIPES data that were recently made available, where the Viaskin Peanut treatment effect improved with longer-term therapy. We have also rolled our valuation forward in time, updated FX and net cash, which now incorporates the July US offering, which raised $282m gross proceeds (issuing 4.1m shares as 8.3m ADS at a price of $34.00/ADS). We do not currently include a contribution for EoE within our valuation or financial forecasts. The breakdown of our rNPV valuation, which uses a 12.5% discount rate, is shown in Exhibit 2.
Exhibit 2: DBV rNPV valuation
Product |
Indication |
Launch |
Peak sales ($m) |
NPV ($m) |
Probability (%) |
rNPV ($m) |
NPV/ADS ($/ADS) |
Viaskin Peanut US |
Peanut allergy |
2018 |
1,417 |
1,400.4 |
65% |
910.3 |
18.9 |
Viaskin Peanut EU |
Peanut allergy |
2019 |
621 |
791.1 |
65% |
514.2 |
10.7 |
Viaskin Milk |
Milk allergy |
2020 |
382 |
358.9 |
20% |
71.8 |
1.5 |
Net cash (estimate) at end September 2015e |
356.8 |
100% |
356.8 |
7.4 |
|||
Valuation |
|
|
2,907.1 |
1,853.0 |
38.4 |
||
Source: Edison Investment Research
Financials
Our financial forecasts have been adjusted to reflect H115 trends and the US public offering. Our updated estimates are shown in Exhibit 3.
We have increased 2015 revenues to €6.4m/$7.0m (from €5.7m), with an expectation that H215 revenues will be similar to the €3.2m/$3.5m reported in H115. H115 R&D was €12.5m/$13.6m and we now expect 2015 R&D spend of €25.3m/$27.6m (from €22.9m). H115 G&A was €5.5m/$6.0m and we have also increased our 2015 G&A forecast to €11.0m/$12.0m (from €8.5m), Our R&D and G&A forecasts beyond 2015 are also increased from the higher 2015 base.
DBV reported gross cash of €332.2m/$362.1m at end September 2015, which includes the July US public offering which raised €255m/$282m gross proceeds through the issuance of 4.14m shares in the form of 8.28m ADSs at a price of $34/ADS (equivalent to €61.678/share). Together with last reported debt at end-June 2015 of €4.9m/$5.3m (related to OSEO grants awarded for various projects), we therefore estimate DBV has net cash of approximately €327.3m/$356.8m, which could potentially provide a cash runway all the way through to profitability.
Exhibit 3: Financial summary
$'000s |
2009 |
2010 |
2011 |
2012 |
2013 |
2014 |
2015e |
2016e |
||
December |
IFRS |
IFRS |
IFRS |
IFRS |
IFRS |
IFRS |
IFRS |
IFRS |
||
PROFIT & LOSS |
||||||||||
Revenue |
|
|
1,176 |
1,860 |
2,042 |
3,026 |
4,171 |
5,190 |
7,000 |
7,444 |
Cost of Sales |
(128) |
(90) |
(71) |
(90) |
(112) |
(149) |
(153) |
(157) |
||
Gross Profit |
1,048 |
1,770 |
1,971 |
2,936 |
4,059 |
5,041 |
6,847 |
7,287 |
||
Research and development |
(3,723) |
(5,517) |
(7,277) |
(12,534) |
(18,930) |
(23,046) |
(27,562) |
(32,238) |
||
EBITDA |
|
|
(4,147) |
(5,392) |
(8,100) |
(14,918) |
(22,120) |
(27,415) |
(33,391) |
(38,337) |
Operating Profit (before amort. and except.) |
(4,001) |
(5,223) |
(7,923) |
(14,698) |
(21,745) |
(26,924) |
(32,759) |
(37,562) |
||
Intangible Amortization |
0 |
4 |
8 |
87 |
(3) |
71 |
65 |
33 |
||
Exceptionals |
0 |
0 |
0 |
0 |
0 |
0 |
0 |
0 |
||
Other |
99 |
(15) |
(30) |
0 |
0 |
0 |
0 |
0 |
||
Operating Profit |
(3,902) |
(5,234) |
(7,944) |
(14,611) |
(21,748) |
(26,853) |
(32,694) |
(37,528) |
||
Net Interest |
(3) |
(3) |
51 |
537 |
704 |
680 |
2,252 |
5,212 |
||
Pre-tax Profit (norm) |
|
|
(4,004) |
(5,225) |
(7,872) |
(14,162) |
(21,041) |
(26,244) |
(30,506) |
(32,349) |
Pre-tax Profit (reported) |
|
|
(3,905) |
(5,237) |
(7,893) |
(14,074) |
(21,044) |
(26,173) |
(30,442) |
(32,316) |
Tax |
0 |
0 |
0 |
0 |
0 |
0 |
0 |
0 |
||
Profit After Tax (norm) |
(3,905) |
(5,240) |
(7,901) |
(14,162) |
(21,041) |
(26,244) |
(30,506) |
(32,349) |
||
Profit After Tax (reported) |
(3,905) |
(5,237) |
(7,893) |
(14,074) |
(21,044) |
(26,173) |
(30,442) |
(32,316) |
||
Average Number of Shares Outstanding (m) |
5.0 |
5.1 |
7.1 |
12.3 |
13.6 |
16.1 |
21.6 |
24.1 |
||
Average number of ADS outstanding (m) |
10.0 |
10.3 |
14.1 |
24.7 |
27.2 |
32.2 |
43.3 |
48.2 |
||
Earnings per ADS - normalized ($) |
|
(0.39) |
(0.51) |
(0.56) |
(0.57) |
(0.77) |
(0.82) |
(0.71) |
(0.67) |
|
Earnings per ADS - normalized and fully diluted ($) |
(0.39) |
(0.51) |
(0.56) |
(0.57) |
(0.77) |
(0.82) |
(0.71) |
(0.67) |
||
Earnings per ADS - (reported) ($) |
|
(0.39) |
(0.51) |
(0.56) |
(0.57) |
(0.77) |
(0.81) |
(0.70) |
(0.67) |
|
Dividend per ADS ($) |
0.0 |
0.0 |
0.0 |
0.0 |
0.0 |
0.0 |
0.0 |
0.0 |
||
Gross Margin (%) |
89.1 |
95.1 |
96.5 |
97.0 |
97.3 |
97.1 |
97.8 |
97.9 |
||
EBITDA Margin (%) |
-352.5 |
-289.9 |
-396.6 |
-492.9 |
-530.4 |
-528.2 |
-477.0 |
-515.0 |
||
Operating Margin (before GW and except.) (%) |
-340.1 |
-280.8 |
-388.0 |
-485.7 |
-521.4 |
-518.8 |
-468.0 |
-504.6 |
||
BALANCE SHEET |
||||||||||
Fixed Assets |
|
|
567 |
446 |
1,382 |
1,511 |
2,639 |
4,196 |
4,582 |
4,849 |
Intangible Assets |
3 |
8 |
22 |
15 |
69 |
31 |
0 |
0 |
||
Tangible Assets |
473 |
356 |
926 |
1,077 |
1,890 |
2,425 |
2,843 |
3,110 |
||
Investments |
90 |
82 |
434 |
419 |
680 |
1,739 |
1,739 |
1,739 |
||
Current Assets |
|
|
6,418 |
12,169 |
15,754 |
44,765 |
47,758 |
132,476 |
370,378 |
341,959 |
Stocks |
83 |
115 |
38 |
32 |
7 |
135 |
139 |
143 |
||
Debtors |
29 |
3 |
1 |
101 |
199 |
148 |
575 |
612 |
||
Cash |
4,805 |
9,840 |
12,569 |
41,233 |
42,949 |
124,865 |
362,335 |
333,876 |
||
Other |
1,501 |
2,211 |
3,147 |
3,398 |
4,603 |
7,328 |
7,328 |
7,328 |
||
Current Liabilities |
|
|
(1,520) |
(2,571) |
(3,568) |
(2,889) |
(4,615) |
(6,021) |
(6,511) |
(6,847) |
Creditors |
(1,414) |
(2,277) |
(3,352) |
(2,609) |
(4,478) |
(5,789) |
(6,279) |
(6,615) |
||
Short term borrowings |
(106) |
(294) |
(216) |
(281) |
(138) |
(232) |
(232) |
(232) |
||
Long Term Liabilities |
|
|
(905) |
(706) |
(807) |
(688) |
(1,752) |
(4,817) |
(4,458) |
(4,099) |
Long term borrowings |
(748) |
(608) |
(677) |
(411) |
(1,435) |
(4,238) |
(3,879) |
(3,521) |
||
Other long term liabilities |
(157) |
(98) |
(130) |
(278) |
(317) |
(578) |
(578) |
(578) |
||
Net Assets |
|
|
4,560 |
9,338 |
12,760 |
42,699 |
44,030 |
125,835 |
363,991 |
335,861 |
CASH FLOW |
||||||||||
Operating Cash Flow |
|
|
(3,299) |
(4,861) |
(6,682) |
(11,371) |
(14,446) |
(22,410) |
(27,752) |
(32,237) |
Net Interest |
0 |
(0) |
0 |
(303) |
251 |
432 |
2,252 |
5,212 |
||
Tax |
0 |
0 |
0 |
0 |
0 |
0 |
0 |
0 |
||
Capex |
(256) |
(53) |
(759) |
(371) |
(1,188) |
(1,026) |
(1,050) |
(1,042) |
||
Acquisitions/disposals |
0 |
0 |
0 |
0 |
0 |
0 |
0 |
0 |
||
Financing |
6,417 |
9,901 |
10,551 |
40,943 |
16,564 |
102,192 |
264,412 |
0 |
||
Dividends |
0 |
0 |
0 |
0 |
0 |
0 |
0 |
0 |
||
Net Cash Flow |
2,861 |
4,987 |
3,111 |
28,897 |
1,181 |
79,188 |
237,862 |
(28,067) |
||
Opening net debt/(cash) |
|
|
(1,071) |
(3,951) |
(8,938) |
(11,676) |
(40,542) |
(41,376) |
(120,395) |
(358,224) |
HP finance leases initiated |
0 |
0 |
0 |
0 |
0 |
0 |
0 |
0 |
||
Other |
19 |
(1) |
(373) |
(31) |
(347) |
(169) |
(33) |
(33) |
||
Closing net debt/(cash) |
|
|
(3,951) |
(8,938) |
(11,676) |
(40,542) |
(41,376) |
(120,395) |
(358,224) |
(330,123) |
Source: DBV Technologies, Edison Investment Research. Solely for the convenience of the reader, the financial summary table has been converted at a rate of US$1.09 to €1. DBV Technologies reports statutory accounts in euro. These translations should not be considered representations that any such amounts have been or could be converted into US dollars at the assumed conversion rate.
|