Last close As at 06/08/2026
—
— 0.00 (0.00%)
Market capitalisation
—
Research: Investment Companies
Vietnam Enterprise Investments (VEIL) was launched in 1995 and became a member of the FTSE 250 in July 2017. It is the largest and longest established closed-ended fund focused on investing in Vietnam equities. The fund’s objective is to generate long-term capital growth through applying a rigorous, bottom-up approach to selecting companies that can benefit from the underlying secular drivers of the country’s growth. Unconstrained by benchmark weightings, the portfolio of 35–40 high-conviction stocks often differs meaningfully from the VN Index. VEIL has generated strong absolute gains over the long term, and over 10 years has delivered annualised returns of 14.2%. The VN Index peaked in April 2018, following which it has corrected c 24% to a level that, according to the manager, presents exciting long-term investment opportunities.
Written by
Vietnam Enterprise Investments |
Correction presents long-term opportunities |
Investment companies |
19 November 2018 |
Share price/discount performance
Three-year performance vs index
Gearing
Analysts
|
|||||||||||||||||||||||||||||||||||||||||||||||||||||||||||||||||||||||||||||||||||||
Vietnam Enterprise Investments (VEIL) was launched in 1995 and became a member of the FTSE 250 in July 2017. It is the largest and longest established closed-ended fund focused on investing in Vietnam equities. The fund’s objective is to generate long-term capital growth through applying a rigorous, bottom-up approach to selecting companies that can benefit from the underlying secular drivers of the country’s growth. Unconstrained by benchmark weightings, the portfolio of 35–40 high-conviction stocks often differs meaningfully from the VN Index. VEIL has generated strong absolute gains over the long term, and over 10 years has delivered annualised returns of 14.2%. The VN Index peaked in April 2018, following which it has corrected c 24% to a level that, according to the manager, presents exciting long-term investment opportunities.
12 months ending |
Total share price return (%) |
Total NAV return (%) |
Vietnam VN Index (%) |
Vietnam VN30 Index (%) |
MSCI Emerging Markets (%) |
31/10/14 |
25.6 |
18.9 |
25.0 |
18.9 |
1.4 |
31/10/15 |
7.2 |
8.5 |
3.7 |
(1.4) |
(11.1) |
31/10/16 |
61.1 |
50.3 |
44.3 |
34.7 |
38.7 |
31/10/17 |
28.8 |
26.1 |
16.1 |
19.9 |
16.7 |
31/10/18 |
14.0 |
11.2 |
12.9 |
11.9 |
(8.7) |
Source: VEIL, Thomson Datastream, Bloomberg. Note: All % on a total return basis in GBP.
Investment strategy: Fundamental and in-depth
VEIL follows a bottom-up approach to find companies with sustainable growth that are well-managed, yet reasonably valued. The investment process involves an intensive schedule of meetings with companies, in-depth fundamental analysis, and the assessment of environmental, social and governance (ESG) factors. As one of the longest established investors in Vietnam, VEIL is well-resourced with a highly experienced investment team. The fund manager, Vu Huu Dien, is supported by two deputy portfolio managers and 10 analysts.
Market outlook: Strong economic prospects
The VN Index reached a peak in April 2018, surpassing the previous peak in 2007 (in local currency terms). It has since experienced a sharp correction of c 24% and valuations have moderated considerably as a result. The outlook for Vietnam’s economy, however, appears to remain robust and sustainable, and GDP growth is forecast to be among the highest in Asia, supported by secular, multi-year growth drivers. These should help underpin earnings growth, which continues to look strong. For 2018, the manager expects market earnings per share (EPS) growth of c 20%.
Valuation: Discount to NAV has narrowed
VEIL is currently trading on a discount to NAV of 10.2%, which is narrower than its three-year average of 15.0%. The board is sensitive to the discount and, in June 2018, implemented a small share buyback programme, which appeared effective in restraining the discount to NAV. VEIL’s objective is to generate long-term capital growth and no dividends have been paid since its inception.
Vietnam Enterprise Investments is a research client of Edison Investment Research Limited
|
Exhibit 1: VEIL at a glance |
||||||||||||||||||||||||||||||||||||||||||||||||||||||||||||||||||||||
Investment objective and fund background |
Recent developments |
|||||||||||||||||||||||||||||||||||||||||||||||||||||||||||||||||||||
VEIL’s investment objective is to achieve medium- to long-term capital growth by investing in the equity securities of companies primarily operating in, or with significant exposure to, Vietnam. VEIL adopts a bottom-up approach to investment selection and does not set portfolio allocations with reference to index weightings. The VN Index is used as a performance benchmark, which VEIL seeks to outperform on a rolling three-year basis. |
■ 26 September 2018: interim results to 30 June 2018 – NAV total return -1.1% in sterling terms versus 0.0% for the VN Index. ■ 12 June 2018: announced commencement of a share buyback programme. 24 April 2018: appointment of Ms Vi Le Peterson as independent non-executive director. ■ 17 April 2018: annual results to end-December 2017 – NAV TR +46.2% in sterling terms versus +38.2% for the VN Index. |
|||||||||||||||||||||||||||||||||||||||||||||||||||||||||||||||||||||
Forthcoming |
Capital structure |
Fund details |
||||||||||||||||||||||||||||||||||||||||||||||||||||||||||||||||||||
AGM |
June 2019 |
Ongoing charges |
2.23% (see page 7) |
Group |
Dragon Capital |
|||||||||||||||||||||||||||||||||||||||||||||||||||||||||||||||||
Annual results |
March 2019 |
Net gearing |
1.7% |
Manager |
Vu Huu Dien |
|||||||||||||||||||||||||||||||||||||||||||||||||||||||||||||||||
Year end |
31 December |
Annual mgmt fee |
Tiered: 2.00%;1.75%;1.50% of net assets |
Address |
PO Box 309, Ugland House, Grand Cayman, KY1‐1104 Cayman Islands |
|||||||||||||||||||||||||||||||||||||||||||||||||||||||||||||||||
Dividend paid |
N/A |
Performance fee |
None |
|||||||||||||||||||||||||||||||||||||||||||||||||||||||||||||||||||
Launch date |
11 August 1995 |
Company life |
Indefinite |
Phone |
+84 8 3823 9355 |
|||||||||||||||||||||||||||||||||||||||||||||||||||||||||||||||||
Continuation vote |
None |
Loan facilities |
US$40m outstanding loan |
Website |
||||||||||||||||||||||||||||||||||||||||||||||||||||||||||||||||||
Dividend policy and history (financial years) |
Share buyback policy and history (financial years) |
|||||||||||||||||||||||||||||||||||||||||||||||||||||||||||||||||||||
VEIL’s investment objective is to achieve capital growth and there is currently no intention to pay a regular dividend. |
VEIL has annually renewed authority to repurchase up to 14.99% of its issued capital. The most recent buyback programme was in June 2018. |
|||||||||||||||||||||||||||||||||||||||||||||||||||||||||||||||||||||
|
|
|||||||||||||||||||||||||||||||||||||||||||||||||||||||||||||||||||||
Shareholder base (as at 5 November 2018) |
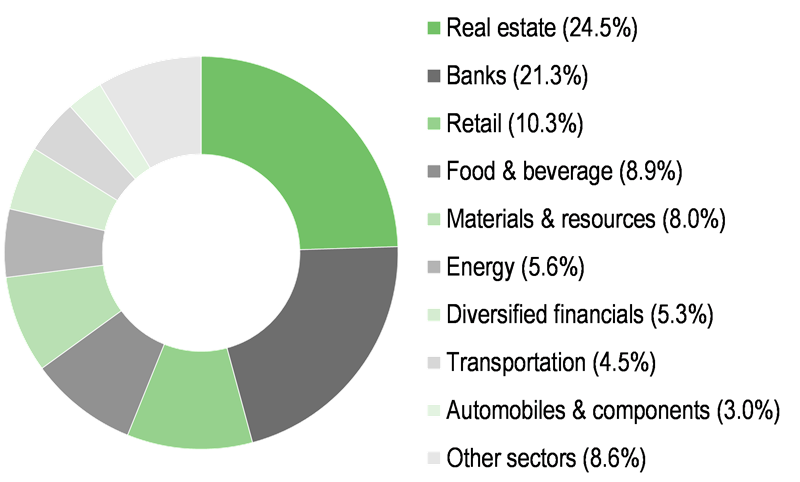
Portfolio exposure by sector (as at 31 October 2018) |
|||||||||||||||||||||||||||||||||||||||||||||||||||||||||||||||||||||
|
|
|||||||||||||||||||||||||||||||||||||||||||||||||||||||||||||||||||||
Top 10 holdings (as at 31 October 2018) |
||||||||||||||||||||||||||||||||||||||||||||||||||||||||||||||||||||||
|
||||||||||||||||||||||||||||||||||||||||||||||||||||||||||||||||||||||
Source: VEIL, Edison Investment Research, Bloomberg, Thomson Reuters. Note: *N/A where not in October 2017 portfolio. **N/A where not a constituent of the VN index.
Market outlook: GDP growth prospects look superior
The VN index surpassed its previous 2007 peak in April 2018 in local currency terms (although it still lags considerably in US dollar terms). This coincided with a more challenging environment for global equities as quantitative easing started to reverse, resulting in higher interest rates and a reduction in liquidity. Escalating trade tensions between the US and China, to which Asia is particularly sensitive, have added to investors’ fears. The VN index has corrected c 24% from its April 2018 peak and valuations have moderated significantly. As shown in Exhibit 2, Vietnam equity valuations are now close to their 10-year average in forward P/E multiple terms and more comparable with that of Asia ex-Japan, following a period of being considerably more expensive in 2017 and early 2018. However, Vietnam offers superior long-term economic growth potential compared to Asia ex-Japan, which includes the relatively developed countries of South Korea, Taiwan, Hong Kong and Singapore. Exhibit 3 shows the IMF forecasts for Vietnam’s GDP compound annual growth rate over the 2018 to 2013 period to be 6.5%. This is higher than the 5.7% and 3.6% forecasts for Asia ex-Japan and the world, respectively.
|
Exhibit 2: Vietnamese market valuation metrics |
||||||||||||||||||||||||||||||||
VN index forward P/E multiple vs Asia ex-Japan index |
Vietnam market valuation metrics |
|||||||||||||||||||||||||||||||
|
|
|||||||||||||||||||||||||||||||
|
Source: Thomson Datastream, Bloomberg, Edison Investment Research. Note: Index valuations at 12 November 2018. |
||||||||||||||||||||||||||||||||
|
Exhibit 3: Real GDP growth – Vietnam versus developing Asia and advanced economies |
||||||||||||||||||||||||||||||||
|
||||||||||||||||||||||||||||||||
|
Source: IMF October 2018 WEO, Edison Investment Research |
||||||||||||||||||||||||||||||||
Fund profile: Long-established Vietnam specialist
VEIL was launched in 1995 as a closed-ended fund, incorporated in the Cayman Islands. Its shares were admitted to the Main Market of the London Stock Exchange in July 2016, when it de-listed from the Irish Stock Exchange, and included in the FTSE 250 Index on 18 July 2017. VEIL is the largest and longest established fund focused on Vietnam equities. Its investment objective is to deliver long-term capital growth and it seeks to outperform the VN Index on a rolling three-year basis. However, it is not constrained by index weightings, and follows a bottom-up approach to find companies that can benefit from Vietnam’s underlying growth drivers and that are well-managed and trade on reasonable valuations. The portfolio is relatively concentrated, holding 35–40 stocks, most of which are listed on one of Vietnam’s three exchanges: the Ho Chi Minh Stock Exchange (HSX), the Hanoi Stock Exchange (HNX) and the Unlisted Public Companies Market (UPCoM), an exchange for newly-listed, state-owned companies that must transfer to either the HSX or HNX within one year. VEIL can also invest in unlisted companies, which tend to be those scheduled for IPO in the near term.
The fund manager: Vu Huu Dien
The manager’s view: More optimistic after correction
Vu believes Vietnam’s recent equity market correction was due, with the VN Index having gained over 130% from the beginning of 2016 to its peak in April 2018. In his view, near-term valuation multiples had become stretched and initial public offering (IPO) pricing had become overly ambitious. He considered that the VN index surpassing the psychologically important barrier of its previous 2007 peak was a natural trigger for profit-taking. Following this, the market continued to fall in tandem with the global equity sell-off. Valuations are now back at levels the manager finds attractive for the long-term investor, while earnings have not been especially buffeted by global events. Vu expects the Vietnam equity market (based on Dragon Capital’s top 60 stocks) to deliver earnings per share growth of c 20% in 2018 and c 12% in 2019. He also believes there are positive structural earnings drivers that should be less fundamentally affected by global events and anticipates that indiscriminate sell-offs could present compelling investment opportunities.
In the manager’s view, Vietnam’s economy is in robust shape and can sustain GDP growth of 6–7% pa over the medium term. He thinks the manufacturing sector is performing well, continuing to attract foreign direct investment (FDI), helping to underpin healthy export growth. Vietnam’s current account and foreign exchange surpluses continue to grow, supporting its currency, while foreign currency borrowing levels are conservative and well-managed. Vu also considers the domestic economy to be doing well and consumer confidence remains strong.
The manager expects that Vietnam’s inclusion in the MSCI Emerging Markets index to be only a matter of time and the market already qualifies on many measures. He believes Vietnam could be put on the MSCI watch list for inclusion as early as June 2019 and notes that FTSE Russell recently added Vietnam to its watch list for possible reclassification as a ‘secondary emerging’ market. Vietnam’s government has increased its determination to achieve inclusion, announcing this as one of its key performance indicators, and Vu thinks progress is being made. The government has engaged with domestic and international investor groups (including Dragon Capital) to help guide policy to address MSCI’s issues, particularly surrounding a trading mechanism for foreign investors once a stock’s foreign ownership limit has been reached. Dragon Capital estimates that Vietnam’s inclusion could bring foreign inflows of c $10bn into its equity market (approximately one-third of current foreign participation levels).
While trade wars are not a welcome development, the manager believes Vietnam could potentially benefit from the US–China dispute. China has been one of the world’s largest recipients of FDI for some time and he sees that the tensions could encourage foreign investors to accelerate a trend to broaden their investment geographically. Vietnam has already been very successful at attracting FDI and Vu believes the country has much to offer, with its well-educated, young population and a good reputation for its work ethic. Meanwhile, he notes that some export sectors may benefit from tariff distortions that are making some of China’s exports comparatively more expensive.
Asset allocation
Investment process: Active and disciplined
VEIL follows a rigorous, bottom-up approach to finding well-managed companies with sustainable growth that trade at reasonable valuations. VEIL is one of the longest established funds investing in Vietnam and benefits from a well-resourced team of highly experienced investment professionals. The manager, Vu, is supported by two deputy portfolio managers and a further 10 analysts, allowing for an intensive schedule of company visits and in-depth fundamental analysis. The assessment of ESG factors is embedded into the investment process and the manager believes firms that score highly in ESG terms tend to outperform over time. There are few constraints on exposures relative to the benchmark and, coupled with the manager’s strict investment criteria, VEIL’s relatively concentrated portfolio of 35–40 stocks reflect the team’s highest conviction ideas. All investment decisions are reviewed by an investment advisory committee, comprising Dragon Capital’s senior managers: CEO Beat Schuerch, deputy CEO Alex Pasikowski, CIO Bill Stoops and CRO Gavin Patterson. This committee reviews the portfolio regularly and ensures VEIL is on track to meet its investment objectives.
Current portfolio positioning
Exhibit 4 shows VEIL’s sector exposures as at end-October 2018. Real estate is the largest exposure in the portfolio at 24.5%, an increase of 8.1pp over the year. More than half of this increase was accounted for by the May 2018 purchase of shares in Vinhomes, Vietnam’s largest IPO to date. The company is the largest real estate developer in Vietnam with projects in over 40 cities across the country. Vinhomes has entered the affordable housing segment of the market (homes priced below $1,500 per square metre), and the manager is optimistic that the firm can replicate the success of its premium property businesses. He believes this is underpinned by Vinhomes’ strong management team and its large, low-cost land bank. VEIL also invested in two unlisted, mid-sized real estate companies, scheduled to list next year. Both companies have a strong presence in Hanoi and surrounding areas in northern Vietnam: Hai Phat is a developer and CenLand is a leading real estate broker. VEIL’s increased real estate exposure over the year also reflects outperformance of its holdings in this sector, notably Khang Dien House and Dat Xanh.
Exhibit 4: Portfolio sector exposure at 31 October 2018
% unless stated |
Portfolio |
Portfolio |
Change |
VN index weight |
Active weight vs index (pp) |
Trust weight/ index weight (x) |
Real estate |
24.5 |
16.4 |
8.1 |
24.9 |
(0.4) |
1.0 |
Banks |
21.3 |
17.9 |
3.4 |
23.2 |
(1.8) |
0.9 |
Retail |
10.3 |
11.6 |
(1.4) |
1.6 |
8.7 |
6.4 |
Food and beverage |
8.9 |
10.3 |
(1.4) |
14.8 |
(6.0) |
0.6 |
Materials and resources |
8.0 |
12.9 |
(4.9) |
5.1 |
2.9 |
1.6 |
Energy |
5.6 |
4.3 |
1.3 |
10.0 |
(4.4) |
0.6 |
Diversified financials |
5.3 |
5.5 |
(0.1) |
5.4 |
(0.1) |
1.0 |
Transportation |
4.5 |
7.6 |
(3.1) |
4.0 |
0.6 |
1.1 |
Automobiles and components |
3.0 |
2.1 |
0.9 |
0.3 |
2.7 |
8.9 |
Software and services |
2.8 |
5.2 |
(2.4) |
1.0 |
1.8 |
2.9 |
Consumer durables |
2.7 |
2.4 |
0.4 |
0.9 |
1.8 |
3.0 |
Capital goods |
1.6 |
2.0 |
(0.5) |
2.7 |
(1.1) |
0.6 |
Pharmaceuticals |
1.5 |
1.7 |
(0.2) |
1.0 |
0.5 |
1.5 |
Other sectors |
0.0 |
0.0 |
(0.0) |
5.2 |
(5.2) |
0.0 |
100.0 |
100.0 |
100.0 |
Source: VEIL, Edison Investment Research
Funding for new investments came from sales and partial sales across many holdings, as stretched valuations in the early part of the year presented profit-taking opportunities. More notably, the portfolio’s exposures to materials and resources and transportation have fallen over the year by 4.9pp and 3.1pp, respectively. Sales included steel group Hoa Phat, Airports Corporation of Vietnam and Vietjet.
Vu highlights that the portfolio is, effectively, most exposed to the consumer sector, with a c 29% weighting as at end-October 2018. In his view, the consumer sector encompasses companies classified as retail, food and beverage, and consumer durables, but also many companies that are classified within other sectors, such as autos, pharmaceuticals, and software and services. The large weight in this sector reflects the manager’s positive view on the multi-year growth opportunities for companies that can benefit from Vietnam’s rising income and urbanisation trends.
Performance: Strong long-term absolute returns
VEIL has a solid performance track record and over three, five and 10 years, its NAV total return and share price return have outperformed the VN index, the large-cap VN 30 index and the MSCI Emerging Markets index. Absolute NAV total return has been strong over 10 years at 241%, representing an annualised return of 14.2%.
|
Exhibit 5: Investment company performance to 31 October 2018 in sterling terms |
|||||||||
Price, NAV and index total return performance, one-year rebased |
Price, NAV and index total return performance (%) |
||||||||
|
|
||||||||
|
Source: Thomson Datastream, Edison Investment Research. Note: Three-, five- and 10-year performance figures annualised. |
|||||||||
|
Exhibit 6: Share price and NAV total return performance, relative to indices (%) |
|||||||||
|
One month |
Three months |
Six months |
One year |
Three years |
Five years |
10 years |
||
Price relative to Vietnam VN index |
4.0 |
4.8 |
5.1 |
1.0 |
25.0 |
29.8 |
11.1 |
||
NAV relative to Vietnam VN index |
(0.0) |
2.1 |
(1.0) |
(1.5) |
11.5 |
11.0 |
0.4 |
||
Price relative to Vietnam VN30 index |
3.3 |
4.9 |
4.5 |
1.9 |
30.8 |
50.1 |
N/A |
||
NAV relative to Vietnam VN30 index |
(0.8) |
2.3 |
(1.5) |
(0.6) |
16.6 |
28.3 |
N/A |
||
Price relative to MSCI Emerging Markets |
2.8 |
14.0 |
8.2 |
24.9 |
60.1 |
139.0 |
35.7 |
||
NAV relative to MSCI Emerging Markets |
(1.3) |
11.0 |
2.0 |
21.9 |
42.7 |
104.3 |
22.7 |
||
|
Source: Thomson Datastream, Edison Investment Research. Note: Data to end-October 2018. Geometric calculation. |
|||||||||
|
Exhibit 7: NAV total return performance relative to VN index over five years |
|||||||||
|
|||||||||
|
Source: Thomson Datastream, Edison Investment Research |
|||||||||
Discount: Narrower than the three-year average
VEIL currently trades on a discount to NAV of 10.2%, which is narrower than its three-year average of 15.0%. The board does not have a formal discount management policy but monitors it closely, and has the ability to manage an imbalance in supply and demand for VEIL’s shares through repurchases.
|
Exhibit 8: Share price discount to NAV over three years (%) |
|
|
Source: Thomson Datastream, Edison Investment Research |
Capital structure and fees
VEIL has two classes of shares in issue: ordinary shares and non-redeemable management shares. Management shares carry one vote each but are not entitled to dividends. There are 1,000 management shares in issue, all owned by Dragon Capital, which confer the right to appoint two members to the board. In a wind-up situation, ordinary shareholders have priority over management shareholders in the return of capital. The board has the authority to repurchase up to 14.99% of shares in issue (renewed annually) and a small buyback programme was implemented in June 2018, repurchasing 2.4m shares at a total cost of $0.6m. There are currently 219.6m ordinary shares in issue and 1.3m shares held in treasury.
VEIL is permitted to borrow up to 20% of NAV (at the time of drawdown) for the purposes of investment flexibility. However, there has been a slowdown in IPO and placements activity in response to more volatile market conditions. Therefore, VEIL has reduced its borrowing and, as at end-October 2018, had a $40m loan facility with Standard Chartered and net gearing of 1.7%.
The investment manager, Enterprise Investment Management, a subsidiary of Dragon Capital, is paid a management fee of 2.0% pa on assets up to $1.25bn, reducing to 1.75% pa on assets between $1.25bn and $1.5bn, above which the fee reduces further to 1.5% pa. No performance fees are payable.
Dividend policy and record
VEIL’s objective is to generate capital growth over the medium to long term and the company has not paid a dividend since its inception.
Peer group comparison
Exhibit 9 shows members of the AIC Country Specialists – Asia Pacific sector (excluding private equity focused funds). This group comprises a diverse range of countries and therefore, direct comparisons of funds may be of limited relevance. VEIL is the second-largest fund within the peer group. In terms of NAV total return performance, it ranks second over one year, first over three and five years, and third over 10 years. VEIL has the second-highest ongoing charge; however, it does not charge a performance fee. It also has the third-narrowest discount to cum-fair NAV.
Exhibit 9: Country specialists – Asia Pacific peer group as at 16 November 2018*
% unless stated |
Market cap £m |
NAV TR |
NAV TR |
NAV TR |
NAV TR |
Discount (cum-fair) |
Ongoing charge |
Perf. fee |
Net gearing |
Dividend yield (%) |
Vietnam Enterprise Investments |
970.5 |
11.2 |
110.8 |
172.0 |
277.5 |
(10.7) |
2.23 |
No |
102 |
0.0 |
Aberdeen New India |
252.5 |
(9.4) |
36.9 |
88.6 |
277.8 |
(13.8) |
1.23 |
No |
105 |
0.8 |
Aberdeen New Thai |
90.0 |
2.9 |
60.5 |
45.8 |
549.0 |
(12.7) |
1.45 |
No |
105 |
2.0 |
Fidelity China Special Situations |
1,102.5 |
(19.3) |
40.5 |
101.8 |
|
(9.7) |
1.11 |
Yes |
122 |
1.7 |
India Capital Growth |
93.4 |
(23.8) |
27.5 |
107.3 |
118.0 |
(11.0) |
2.21 |
No |
100 |
0.0 |
JPMorgan Chinese |
178.8 |
(22.5) |
36.4 |
51.7 |
238.8 |
(11.9) |
1.38 |
No |
122 |
0.7 |
JPMorgan Indian |
665.1 |
(18.9) |
21.2 |
72.5 |
185.4 |
(14.7) |
1.20 |
No |
99 |
0.5 |
VietNam Holding |
129.5 |
9.4 |
55.5 |
116.3 |
258.7 |
(12.6) |
2.19 |
Yes |
100 |
0.0 |
VinaCapital Vietnam Opportunity Fund |
613.5 |
14.9 |
104.1 |
126.5 |
250.0 |
(17.3) |
2.34 |
Yes |
100 |
1.6 |
Weiss Korea Opportunity |
123.6 |
(23.3) |
15.1 |
45.2 |
|
(2.9) |
1.89 |
No |
100 |
2.3 |
Peer group average |
421.9 |
(7.9) |
50.9 |
92.8 |
269.4 |
(11.7) |
1.72 |
106 |
1.0 |
|
Rank in peer group |
2 |
2 |
1 |
1 |
3 |
3 |
2 |
5 |
8 |
|
Vietnam subgroup average |
571.2 |
11.8 |
90.1 |
138.3 |
262.0 |
(13.5) |
2.25 |
101 |
0.5 |
|
Rank in subgroup |
1 |
2 |
1 |
1 |
1 |
1 |
2 |
1 |
2 |
Source: Morningstar, Bloomberg, Edison Investment Research. Note: *Performance data to 31 October 2018. TR = total return. Net gearing is total assets less cash and equivalents as a percentage of net assets.
The board
Following the appointment of Vi Le Peterson in April 2018, the board consists of five members, four of whom are independent and non-executive. Chairman Wolfgang Bertelsmeier was appointed in July 2009 and assumed his present role in November 2013. The other board members are senior independent director Stanley Chou (appointed January 2016), Derek Loh (appointed March 2011), Gordon Lawson (appointed July 2014) and non-independent director Dominic Scriven (appointed May 1995), the founder of Dragon Capital.
|
|
Investment Companies
BTG reported good H119 results headlined by 12% and 35% y-o-y growth in revenues and operating profit, respectively. The performance was driven by volume growth from the Interventional Medicine segment, royalties from Zytiga and cost control. Cash at the end of H119 was $285m and could be a powerful asset in redressing BTG’s uncertainties.