Last close As at 05/08/2026
GBP3.92
▲ 2.00 (0.51%)
Market capitalisation
GBP1,776m
Research: Investment Companies
HgT posted a 12-month net asset value (NAV) total return of 12.2% to end June 2024 (based on preliminary unaudited H124 valuations), maintaining its impressive long-term track record, at 18.6% and 18.3% pa over the last five and 10 years, respectively. Despite the still modest exit activity in the global private equity market, HgT received £347m (or 15% of opening NAV) in proceeds from exits and refinancings in H124. The four full and partial exits signed in 2024 were agreed at an average 13% uplift to their previous carrying values, reinforcing HgT’s portfolio valuations. Accounting for all deals announced to date, HgT’s pro forma available liquid resources were £508m, a robust 70% commitment coverage ratio.
HgT |
HgT’s value proposition
Investment trusts/TMT |
6 August 2024 |
Analysts
|
|||||||||||||||||||||||||||||||||||||||||||||||||||
HgT posted a 12-month net asset value (NAV) total return of 12.2% to endJune 2024 (based on preliminary unaudited H124 valuations), maintaining its impressive long-term track record, at 18.6% and 18.3% pa over the last five and 10 years, respectively. Despite the still modest exit activity in the global private equity market, HgT received £347m (or 15% of opening NAV) in proceeds from exits and refinancings in H124. The four full and partial exits signed in 2024 were agreed at an average 13% uplift to their previous carrying values, reinforcing HgT’s portfolio valuations. Accounting for all deals announced to date, HgT’s pro forma available liquid resources were £508m, a robust 70% commitment coverage ratio.
|
HgT – Equity Proposition video |
|
|
Source: Edison Investment Research |
Secular digitalisation trend remains intact
HgT’s portfolio has benefited from the structural trend towards digitalisation of business processes for many years now. According to the head of research at Hg (HgT’s investment manager), software spending continues to grow significantly, even in advanced economies (where IT spending in relation to GDP is already high vs less developed countries), suggesting the sector will not reach saturation any time soon. This is consistent with Gartner’s forecast, released in April 2024, of global software spending growth of 13.9% in 2024 after 12.9% in 2023, and is driven by enterprises prioritising spending to capture a competitive edge through increased productivity, automation and other software-driven transformation initiatives.
A quality portfolio of private tech businesses
HgT’s strong returns coupled with its focus on private software and tech services companies make it a promising complement to broader listed tech portfolios, which tend to be skewed to mega/large-cap stocks. HgT’s performance has historically been driven by strong sales and EBITDA momentum, which between 2019 and Q124 stood at around 20–30% per annum at a margin of c 30%+ across its top 20 holdings. Therefore, HgT’s portfolio continues to fulfil the ‘Rule of 40’ (see our previous note for details). Average organic top-line growth was c 13% over that period and was coupled with high ‘buy-and-build’ activity, which benefited earnings growth and supported returns through a considerable multiples arbitrage.
An appealing addition to a tech portfolio
HgT is a private equity (PE) investment company that invests in leading, profitable, unquoted European midmarket businesses with an international footprint, offering mission-critical, low-spend software solutions to small and medium-sized enterprises (SMEs). It currently holds a portfolio valued at c £2.5bn consisting of around 50 such holdings and it provides high-quality exposure to the corporate digitalisation theme. The trust offers a combination of a high share of recurring revenues (usually 90%+) based on software-as-a-service (SaaS) subscription models, high customer retention, as well as cash conversion (measured as free cash flow to EBITDA) of over 90%. HgT’s ‘sweet spot’ lies in defensive tech growth companies operating in one of eight core end-markets: tax and accounting; ERP and payroll; legal and compliance; automation and engineering; insurance; SME tech services; capital markets and wealth management IT; and healthcare IT.
|
Exhibit 1: Hg’s ‘sweet spot’ |
|
|
Source: Hg |
Shrinking opportunity set in Europe, crowded AI plays in the US
HgT should not be viewed exclusively as a PE opportunity but should also be considered a potential component of an investor’s broader tech exposure. In this context, we note the deequitisation trend in Europe, which translates into fewer publicly listed software companies. Over the last year, we calculate that, for the universe of European-listed software companies with a market cap above US$10m, only seven companies were added whereas nine were delisted and 18 were acquired. For investors wanting exposure to the wider software sector, HgT has the advantage of being able to invest in privately-owned companies providing a far wider range of opportunities. In aggregate, Hg’s total portfolio enterprise value of over US$140bn as at end-March 2024 would make it the second largest European software company (after SAP).
Looking beyond Europe, we believe that HgT’s focus on private software and tech services companies (most of which are the size of listed small caps) makes it a good addition to a portfolio tracking the broader tech landscape, which tends to be skewed towards mega/large caps, including the ‘Magnificent 7’ stocks. This is particularly important given that US tech mega caps, especially those benefiting from the positive sentiment towards AI, have become a quite crowded play (even if underpinned by strong revenue and earnings momentum). The AI boom, coupled with a delay in the Fed rate cuts, contributed to the recent underperformance of US SaaS software companies against the Nasdaq, as illustrated by the BVP Emerging Cloud Index, which serves as a good proxy as it tracks the performance of 67 US-listed companies that provide cloud-based software or services (see Exhibit 2). Here, we note that c 13% of these companies by count are forecast to be loss-making this year, while the vast majority of HgT’s portfolio holdings are profitable, according to the company. This follows the strong performance in 2020 and 2021 on the back of accelerated adoption of cloud-based services during the pandemic. On the contrary, the iShares Expanded Tech-Software Sector ETF (tracking 100 US tech companies, mostly software businesses) was ahead of the broader US tech market in recent months.
|
Exhibit 2: BVP Emerging Cloud Index and iShares Expanded Tech-Software Sector ETF compared to Nasdaq and S&P500 |
|
|
Source: LSEG Data & Analytics |
HgT’s strong track record makes it a quality tech play
The outperformance of mega-cap US tech stocks has been reflected in the NAV total returns of some of the UK-listed tech investment trusts, most notably Polar Capital Technology Trust and Allianz Technology Trust, which over the 12 months to end-June 2024 visibly outperformed both HgT and several other UK-listed investment companies investing primarily in public technology companies (see Exhibit 3). Both above-mentioned trusts (as well as major tech ETFs) were also the top performers over 10 years, supported by the ‘Magnificent 7’ stocks.
Notably, HgT was the top performer in this peer group over the last three years. It also outperformed all peers except for the above-mentioned two over five and 10 years to end-June 2024, posting NAV total returns (TR) of 18.6% and 18.3% pa, respectively. We believe that this highlights HgT’s role as a high-quality play in the technology small-cap space. The trust also significantly outperformed the MSCI World Small Cap Index and the UK All-Share Index (see Exhibit 4).
Exhibit 3: HgT versus selected UK-listed tech-focused investment companies at 5 August 2024*
% unless stated |
Market cap £m |
NAV TR |
NAV TR |
NAV TR |
NAV TR |
Ongoing |
Perf. |
Discount |
Net |
Dividend |
HgT |
2,199 |
12.2 |
46.7 |
134.4 |
438.0 |
1.7 |
Yes |
(8.3) |
100.0 |
1.4 |
Scottish Mortgage |
10,074 |
15.1 |
(28.2) |
89.2 |
384.4 |
0.3 |
No |
(13.3) |
112.4 |
0.6 |
Polar Capital Technology |
3,394 |
40.8 |
38.8 |
152.1 |
633.4 |
0.8 |
Yes |
(8.8) |
100.0 |
0.0 |
Herald |
1,092 |
18.1 |
(5.4) |
61.2 |
208.1 |
1.1 |
No |
(13.0) |
100.0 |
0.0 |
Allianz Technology Trust |
1,294 |
44.4 |
38.9 |
164.9 |
708.3 |
0.7 |
Yes |
(8.1) |
100.0 |
0.0 |
BlackRock Science and Technology Trust |
1,024 |
23.5 |
7.1 |
16.3 |
N/A |
1.1 |
No |
(4.4) |
100.0 |
0.0 |
Edinburgh Worldwide |
562 |
(7.1) |
(52.6) |
(12.2) |
101.9 |
0.7 |
No |
(8.2) |
112.9 |
0.0 |
Simple average (excluding HgT) |
2,907 |
22.5 |
(0.2) |
78.6 |
407.2 |
0.8 |
- |
(9.3) |
104.2 |
0.1 |
HGT rank in peer group |
3 |
6 |
1 |
3 |
3 |
1 |
- |
4 |
3 |
1 |
Source: Morningstar, company data, Edison Investment Research. Note: Net gearing is total assets less cash and equivalents as a percentage of net assets (100 = ungeared). *Performance to end-June 2024.
|
Exhibit 4: HgT’s performance to 30 June 2024 |
|
Price, NAV and benchmark to total return performance, five years rebased |
Price, NAV and benchmark total return performance (%) |
|
|
|
Source: LSEG Data & Analytics, Edison Investment Research. Note: Three-, five- and 10-year performance figures annualised. |
|
Exhibit 5: Five-year discrete performance data
12 months ending |
Share price |
NAV |
UK All-Share |
MSCI World Small Cap (%) |
STOXX Europe 600 Technology (%) |
30/06/20 |
12.3 |
13.2 |
(13.0) |
(1.9) |
17.5 |
30/06/21 |
53.2 |
41.2 |
21.5 |
37.3 |
22.9 |
30/06/22 |
(5.3) |
20.6 |
1.6 |
(10.9) |
(23.4) |
30/06/23 |
14.4 |
8.4 |
7.9 |
8.4 |
33.8 |
30/06/24 |
32.8 |
12.2 |
13.0 |
10.3 |
22.7 |
Source: LSEG Data & Analytics. Note: All % on a total return basis in pounds sterling.
HgT’s 100% focus on software and tech services companies differs from the broader remit of its investment company peers, which invest in software and tech services businesses to a varying degree, alongside other tech sectors such as biotechnology, healthcare equipment, internet media or semiconductors (see Exhibit 6). We did not include Scottish Mortgage in the exhibit due to its disclosed sector breakdown not being fully comparable with other companies; its portfolio includes a combination of listed (c 75% at end-June 2024) and private (c 25%) growth companies across the size spectrum, primarily those exposed to themes such as digitalisation, ‘technology meets healthcare’ and decarbonisation (though it also has other holdings such as SpaceX).
|
Exhibit 6: Exposure of selected UK-listed investment companies to tech* investments |
|
|
Source: Company data. Note: *Split based on Edison’s assumptions due to varying industry definitions used by the respective investment companies. Based on the latest available detailed sector split – end-June 2024 for Polar Capital Technology; end-December 2023 for Allianz Technology, BlackRock Science and Technology, and Herald; end-October 2023 for Edinburgh Worldwide. |
AI is an opportunity beyond the US mega caps
Ultimately, the broader software and services sector should also be a major beneficiary of the efficiency and new revenue opportunities unlocked by AI. In this context, we note that Hg has been an early adopter exploring the potential of AI, and Hg has built a team of 20 in-house data and AI experts and more than 50 consultant specialists, whose experience has been codified in Retina, a suite of AI-powered SaaS tools available to Hg’s portfolio companies. Retina augments the business intelligence, data-driven decision making and M&A sourcing of HgT’s portfolio companies. Hg’s capabilities and value creation activities across its portfolio related to AI solutions should give its holdings a competitive advantage over some peers that do not have such a strong backing. Hg sees a significant potential for AI/machine learning for both customer-facing applications, such as improving the revenue profile (for instance churn prediction and prevention tools, upsell/cross-sell modelling) and developing new products (eg Visma’s school time tabling optimisation tool), as well as internal productivity opportunities, most notably in coding, customer support (eg handling inbound inquiries) and marketing (eg to pinpoint the ideal customer profile). Hg has identified generative AI opportunities to improve its portfolio EBITDA by US$50m (which represents 2pp of the 2024 margin).
High consistency of returns by vintage
Unlike the mega-cap stocks which have been beneficiaries of the latest bull market for tech, HgT’s NAV performance has historically been earnings growth rather than multiples expansion. The main attraction of the trust is its consistent performance over the long term from a portfolio of relatively defensive but fast-growing SaaS-based software businesses, mostly based in Europe (75% at end-March 2024). Over the 10 years to end-March 2024, around 90% of Hg’s realised investments have returned multiples on invested capital (MOIC) of more than 2.0x and internal rates of return (IRR) of over 20% (with a loss ratio of c 1%), including 3.8x and 34% since the start of 2022, respectively. Hg’s long-term track record to end-March 2024 (accounting for post-period events) is an average MOIC of 3.2x and IRR of 32% (see Exhibit 7).
|
Exhibit 7: Hg’s realised gross MOIC and IRR by investment vintage |
|
|
Source: Hg |
Outperforming the listed PE group
HgT continues to perform significantly ahead of the listed PE peer group average over one, three, five and 10 years, and remains the top-performer (except for the three-year period, over which it ranked third after Oakley Capital Investments and CT Private Equity (see Exhibit 8)).
Exhibit 8: HgT versus listed private equity peers at 26 July 2024*
% unless stated |
Market cap £m |
NAV TR |
NAV TR |
NAV TR |
NAV TR |
Ongoing |
Perf. |
Discount |
Net |
Dividend |
HgT |
2,199 |
12.2 |
46.7 |
134.4 |
438.0 |
1.7 |
Yes |
(8.3) |
100.0 |
1.4 |
HarbourVest Global Private Equity |
1,871 |
4.7 |
38.6 |
106.4 |
364.9 |
1.2 |
Yes |
(38.8) |
105.5 |
0.0 |
Pantheon International |
1,393 |
8.0 |
39.5 |
78.5 |
260.2 |
1.3 |
Yes |
(38.9) |
107.2 |
0.0 |
ICG Enterprise |
802 |
4.4 |
44.3 |
96.6 |
243.3 |
1.5 |
Yes |
(36.3) |
108.5 |
2.7 |
Patria Private Equity |
789 |
5.8 |
45.6 |
99.5 |
281.3 |
1.1 |
No |
(33.5) |
109.3 |
3.2 |
CT Private Equity Trust |
316 |
1.6 |
58.5 |
115.4 |
274.7 |
1.1 |
Yes |
(35.5) |
118.7 |
6.3 |
Apax Global Alpha |
697 |
(1.3) |
2.5 |
45.0 |
N/A |
1.8 |
Yes |
(33.3) |
100.0 |
8.0 |
NB Private Equity Partners |
728 |
0.2 |
21.8 |
69.0 |
265.9 |
1.9 |
Yes |
(32.6) |
102.4 |
2.3 |
Partners Private Equity |
605 |
0.1 |
9.3 |
47.3 |
196.8 |
1.7 |
Yes |
(28.7) |
105.3 |
7.0 |
Altamir |
766 |
(0.1) |
21.5 |
83.1 |
233.7 |
3.3 |
No |
(30.9) |
100.0 |
4.4 |
Oakley Capital Investments |
882 |
7.5 |
62.6 |
132.9 |
308.4 |
2.8 |
Yes |
(29.4) |
100.0 |
0.9 |
Simple average (excluding HgT) |
885 |
3.2 |
34.0 |
87.0 |
270.1 |
1.8 |
- |
(33.8) |
105.7 |
3.5 |
HGT rank in peer group |
1 |
1 |
3 |
1 |
1 |
5 |
- |
1 |
8 |
8 |
Source: Morningstar, company data, Edison Investment Research. Note: Net gearing is total assets less cash and equivalents as a percentage of net assets (100 = ungeared). *12-month performance based on end-June 2024 or latest available NAV: end-May 2024 for Partners Private Equity; end-April 2024 for ICG Enterprise Trust; end-March 2024 for CT Private Equity Trust; and end-December 2023 for Altamir. **Excludes look-through expenses at the underlying funds level.
Portfolio delivering healthy, highly profitable growth
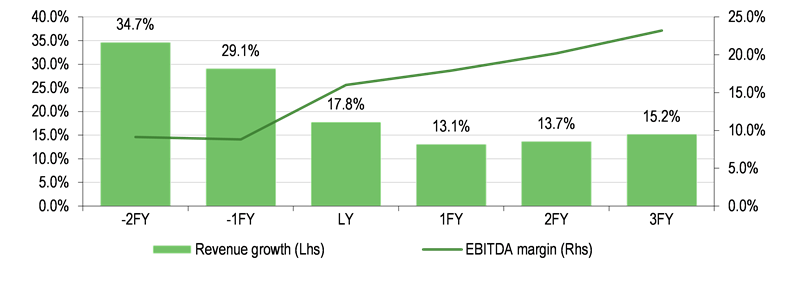
As highlighted above, HgT’s superior long-term performance has been primarily driven by earnings momentum across its portfolio. Between 2019 and Q124, HgT delivered revenue and EBITDA growth across its top 20 holdings of around 20–30% per annum (with average organic top-line growth of c 13%) at a margin of c 30%+ across its top 20 holdings (see Exhibit 9). LTM revenue and EBITDA growth to end-June 2024 was 20% and 25%, respectively, and its average EBITDA margin for the 12 months to end-March 2024 (last reported) stood at 31%. We calculate that this is ahead of the average 18% revenue growth and 16% EBITDA margin for US SaaS companies in their last financial year, based on LSEG Data & Analytics data (see Exhibit 10 below). HgT’s portfolio therefore fulfils the so-called ‘Rule of 40’, which is a rule of a thumb (but based on empirical evidence) saying that software stocks with combined revenue growth and EBITDA margins of 40% or more typically generate higher valuations (see our June 2023 note for details).
|
Exhibit 9: Revenue and EBITDA growth across HgT’s top 20 holdings |
|
|
Source: Hg |
The strong earnings growth across HgT’s portfolio comes only partly from its sector focus. Another important contributor is Hg’s vast tech expertise and value creation capabilities coming from a combination of three strengths: firstly, its in-house team of operational experts, which includes more than 50 senior operational specialists, each supported by a network of trusted third-party associates and partners; secondly, an extensive community consisting of key managers from its portfolio companies (called Hg Hive); and thirdly, intellectual property, tools and group services on which its portfolio companies can rely (such as the above-mentioned Hg Retina). We included historical return attribution details of Hg’s historical gross IRR in our June 2023 note.
Market outlook: Secular growth continues
Software spending poised to stay on an upward trend
HgT’s portfolio has benefited from the structural trend towards digitalisation for many years now, with accelerated adoption following the COVID-19 outbreak. Hg’s head of research examined the IT spending patterns across countries and found that the share of software spending grows with the level of overall IT spending as a percentage of GDP. This suggests that the sector is not nearing saturation even in the more developed economies. IT spending slowed in 2022 (growth of 0.5%), representing a digestion phase after elevated COVID-19-related spending. Despite this, the software market grew 8.8%, according to Gartner. Spending recovered in 2023, with IT market growth of 3.8%, within which software grew 12.6% and IT services grew 6.1%. Overall, Gartner forecasts IT spending to accelerate to growth of 8.0% in 2024, with software growth of 13.9% and IT services growth of 9.7%, as enterprises prioritise spending to capture competitive advantages through increased productivity, automation and other software-driven transformation initiatives. These measures are aimed at, among others, offsetting the cost inflation coming from the growth in ‘white-collar’ wages (which is partly driven by demographic factors, most notably an ageing society). In 2023, some of this growth was due to price increases as software companies enacted inflation-linked increases.
GenAI drives further investments in the sector
The public launch of ChatGPT in late 2022 heralded the rapid adoption of generative AI (GenAI), which is driving another wave of spending, with investment in data centre capacity to support model creation and training and the creation of tools and applications that allow enterprises to exploit GenAI for specific use cases. Consequently, public cloud services revenue grew 17.3% in 2023 and is forecast to grow 20.4% in 2024 and 22.1% in 2025, with SaaS spending growth of 18.1% in 2023, 20.0% in 2024 and 19.4% in 2025, according to Statista citing Gartner. The positive market backdrop is also reflected in market expectations of healthy revenue growth and increasing profitability of listed SaaS companies over the next two years. Based on a basket of c 100 SaaS companies listed in the US, Exhibit 10 shows revenue growth and EBITDA margins over the last three fiscal years and consensus estimates for the next three forecast years shown.
|
Exhibit 10: Average historical and forecast revenue and EBITDA growth of US listed SaaS businesses |
|
|
Source: LSEG Data & Analytics data as at 6 August 2024, Edison Investment Research. Note: LY, last financial year, FY, financial year. |
So far this year, US listed SaaS companies have seen mixed share price performances. In May, some of the largest companies, such as Salesforce, Shopify and Workday, reduced revenue guidance for the current year, citing slower sales cycles due to the risk of ‘higher for longer’ inflation and interest rates and, in some cases, slower customer headcount growth, which affects the value of per seat licensing. Others have raised guidance, with ServiceNow in particular, benefiting from the uptake of GenAI-based solutions. Here, we note that HgT’s portfolio companies focus on SMEs rather than larger corporate clients and are therefore less exposed to the above-mentioned headwinds.
Some of the largest software companies that are not included in the pure-SaaS group have benefited from the growing adoption of GenAI, with Oracle’s June FY24 results pointing to strong order intake in Q3 and Q4 for products that support the training of large language models and Microsoft benefiting from growing AI-driven demand for its cloud services.
Returning significant cash to investors
Hg delivered 19 liquidity events (realisations and refinancings) between January 2023 and end-June 2024 (and 40 since early 2022, broadly in line with its target of eight to 16 events per year on average), returning more than US$7.5bn to its investors (US$12bn since early 2022). As a result, Hg highlights that it is among the top 5% of all buyout firms globally for cash returned to clients as measured by the distributions to paid-in capital (DPI) multiple, on every fund launched since 2012, see Exhibit 11.
|
Exhibit 11: Hg’s net DPI multiple versus industry by vintage |
|
|
Source: Hg. Note: Net DPI figures for Hg as of 31 March 2024 adjusted pro forma for post-period transactions. Average of the top 5%, median and vintage benchmark data based on Q423 data available from Cambridge Associates (ex US PE) benchmarks. Average for 2017 vintages includes Mercury 2 and Genesis 8. 2018 vintage includes Saturn 1; average for 2020/21 vintages includes Mercury 3, Genesis 9 and Saturn 2. Pro-forma estimates for recent exits signed but not yet closed. |
HgT generated strong total realisations of £345.9m in FY23 or c 17% of opening NAV (£323.8m net of carried interest). This included £132.3m generated on the full exits of the cloud-based transportation management software platform Transporeon (at an uplift of 18% to carrying value, agreed in December 2022, sold to a trade buyer) and the business messaging solutions provider to local enterprises Commify (at a 32% uplift, sold to ECI Partners), as well as c £73.5m from partial exits of P&I, Azets and Silverfin (the latter was sold to Visma, HgT’s portfolio company).
HgT conducted a secondary sale of 25% of its limited partner position in Hg Genesis 8 (a 2017 vintage mid-market fund) for £91m at 100% end-December 2022 NAV (representing a healthy MOIC of 3.2x), with proceeds paid in two instalments on 31 March 2024 and 31 March 2025. HgT’s secondary sale of Genesis 8 was aimed at generating proceeds that could be reinvested into co-investments, which are targeted at 10–15% of HgT’s portfolio over the medium term versus c 7% in Q224 on a pro forma basis (ie accounting for all announced transactions). Finally, HgT agreed with Hg to reduce its commitment to Hg Saturn 3, which led to a £47.3m rebate of invested capital. It is important to put Hg’s good level of realisations in the context of the broader PE market, which saw a 66% decline in global PE exit activity in 2023 versus the 2021 peak.
A further £347m (or 15% of opening NAV) in proceeds from exits and refinancings was realised in H124. This included three exits agreed in 2023, which were followed by a reinvestment in the same business: the exit from IRIS, which valued HgT’s holding at £99.8m (resulting in net proceeds of £42.1m); the £82m exit from GGW Group (£38m net of subsequent reinvestment); and the sale of Visma’s stake by the Genesis 7 fund (accounting for the subsequent reinvestment, the deal was a net investment of £83.5m into Visma by HgT). On top of this, HgT received £78.5m from realisations in Q124, mostly from the full exit of Argus Media (signed in 2024), as well as partial exits of MeinAuto and TeamSystem. Hg greed a further two full exits from F24 and its remaining stake in TeamSystem, and a partial exit of team.blue, from which HgT expects to generate c £71m of proceeds. We believe that the above exits and refinancings illustrate Hg’s strong ability to deliver continued liquidity events and the quality of its investment portfolio.
Continuing to realise investments above carrying value
Importantly, HgT’s realisations of its direct investments were historically delivered at an uplift to carrying value, which between 2017 and 2022 stood on average at a strong 38%. Even in 2023’s demanding environment, marked by low deal activity and pressure from higher interest rates, the trust was able to realise investments at a price that was, on average, 25% above the end-2022 carrying value (and 28% to latest unadjusted quarterly carrying value). The four full and partial exits signed in 2024 were agreed at an average 13% uplift to their previous carrying values (as at end-September 2023 for Argus Media, end-March 2024 for the post-H124 deals). Hg has never sold an investment below the carrying value at signing. We view HgT’s realisations as a testament to the quality of the trust’s portfolio and its conservative valuation approach.
Selective platform investments, high add-on activity
Hg has been quite cautious in terms of platform investments since the beginning of 2023 but conducted more than 280 bolt-on investments across its portfolio in 2023 and Q124. The bolt-on acquisitions allowed Hg to realise a significant multiples arbitrage, with the average bolt-on price of 12.3x being 46% below the average platform price of 22.7x. HgT’s platform investments in H124 amounted to £310m and included the above-mentioned reinvestments in Visma, IRIS and GGW Group, as well as new investments in Cube (active in automated regulatory intelligence and regulatory change management technology, with HgT investing £9.7m), CINC Systems (a cloud-based software company serving the community association management sector, £19.2m) and Induver (an independent corporate insurance broker in Belgium, which merged with its competitor Clover, £6.7m). Post reporting date, HgT made £108m of new investments into Focus Group (a provider of essential business technology to SMEs, including IT, telecom and connectivity services) and AuditBoard (a connected risk platform for audit, risk, compliance and ESG management). It also announced a £11.5m investment in CTAIMA and e-coordina, which join forces to create an Iberian contractor management, risk and compliance software platform.
Portfolio positioning
HgT’s portfolio consisted of 50 software and services companies at end-Q124, categorised into the eight clusters mentioned above. The top 10 investments represented c 56% of portfolio value (see Exhibit 12), with the top 20 making up 78%. While HgT’s portfolio is concentrated in Europe (75% of value), it has broader indirect exposure, as a number of its largest companies operate globally.
Exhibit 12: HgT’s top 10 holdings at 31 March 2024
Company name |
Country |
Cluster |
% of portfolio value |
|
31 Mar 2024 |
31 Mar 2023 |
|||
Access |
UK |
ERP and payroll |
11.9% |
12.6% |
Visma |
Scandinavia |
Tax and accounting |
8.8% |
8.4% |
IFS Workwave |
Scandinavia |
ERP and payroll |
5.4% |
5.9% |
Howden |
UK |
Insurance |
5.3% |
5.1% |
Litera |
North America |
Legal and compliance |
4.9% |
4.2% |
Septeo |
France |
Legal and regulatory compliance |
4.4% |
3.1% |
GGW Group |
Germany |
Insurance |
3.9% |
N/A |
IRIS |
UK |
Tax and accounting |
3.9% |
3.7% |
P&I |
Germany |
ERP and payroll |
3.7% |
4.0% |
Ideagen |
UK |
Legal and regulatory compliance |
3.6% |
3.5% |
Top 10 (% of holdings) |
55.8% |
55.0%* |
||
Source: HgT data. Note: *Based on top 10 holdings as at end-March 2023.
|
Exhibit 13: Portfolio breakdown by cluster |
Exhibit 14: Portfolio breakdown by geography |
|
|
|
Source: Hg, Edison Investment Research. Note: Data at 31 March 2024. |
|
|
Exhibit 13: Portfolio breakdown by cluster |
|
|
|
|
Exhibit 14: Portfolio breakdown by geography |
|
|
|
|
Source: Hg, Edison Investment Research. Note: Data at 31 March 2024. |
Dividends
HgT is primarily a capital appreciation vehicle, but has been paying regular dividends, with the LTM payment of 6.5p implying a dividend yield of 1.2%. HgT’s dividend per share from 2023 profit was 6.50p (vs 7.00p in 2022). HgT does not follow any explicit dividend policy and the payments depend on its income streams, investment structures and liquidity events. However, HgT can only retain up to 15% of income to qualify for investment trust tax status and its board recently highlighted that it believes that 5.0p per share is a reasonable level for a floor.
|
Exhibit 15: Dividend history since FY10 |
|
|
Source: HgT, Edison Investment Research |
Gearing and commitment coverage ratio
HgT does not deploy structural gearing but has a £375m credit facility in place (representing c 16% of NAV, maturing in March 2027) to optimise balance sheet management (most notably to bridge the gap between investments and realisations) and to help manage foreign exchange risk. The interest rate on the amount drawn from the facility stands at Euribor plus a 3.25% margin and HgT pays a commitment fee on the undrawn part of the facility of 1.15% per year.
Accounting for all the transactions announced to date, HgT’s pro forma available liquid resources (including the £308m undrawn part of its £375m credit facility) stood at £508m, which represents a robust 70% coverage of its outstanding commitments.
|
Exhibit 16: HgT’s commitment coverage ratio |
|
|
Source: HgT, Edison Investment Research. Note: *Pro forma as at end-June 2024 adjusted for all transactions announced to date. |
Hg also utilises credit lines to fund portfolio M&A and return cash to investors. These facilities are unsecured and have no recourse to HgT and the underlying Hg private funds HgT invests in. At end-December 2023, the fund level facilities attributable to HgT’s investments stood at £355.8m, which represented c 14% of HgT’s portfolio value (including accrued income but before carried interest and the balance of these facilities) or c 10% of the combined portfolio value and HgT’s outstanding commitments at end-2023. Finally, Hg usually applies leverage at the level of its portfolio companies, which is serviced using the investment’s own cash flows. At end-March 2024, the average net debt to EBITDA across HgT’s top 20 holdings stood at 7.4x, which represents a loan-to-value of 29% based on the average 25.7x EV/EBITDA ratio of these holdings.
Fees and charges
HgT pays a management fee specific to each of the Hg funds and calculated in respect of either HgT’s commitments to or capital invested alongside the respective Hg fund. HGT’s co-investments alongside Hg funds are exempt from fees. In FY23, total priority profit charged to HgT stood at £28.5m and operating expenses were £9.2m, bringing ongoing charges (excluding carried interest) to c 1.7% of average NAV. On top of this, HgT incurred finance costs of £8.2m. Other than fees payable for each of the underlying funds, Hg charges a small management fee (flat at £20k a year, paid quarterly) and an administrative fee (0.1% pa, calculated and paid quarterly).
Approach to ESG
Hg actively integrates ESG factors into its business, which is reflected in its scores from the United Nations-supported Principles for Responsible Investment of 100% for PE and 89% for Policies and Stewardship in the most recent assessment. The manager has been certified as carbon neutral since 2019, which it achieved thanks to the reduction of its own carbon footprint and offsetting the remaining emissions with carbon certificates. Hg was one of the first PE firms to sign up to the Science Based Targets initiative with the aim to have a portfolio aligned to Net Zero by 2050. It is targeting a 50% reduction of its direct emissions (Scope 1 and 2) by 2030 and plans to adopt science-based carbon reduction targets across its portfolio companies by at least 2040.
Hg continues to monitor the progress of ESG performance across its portfolio holdings with the Hg Sustainable Business Framework, initially developed and implemented in 2018 and based on around 180 metrics across three main areas: essentials (governance and business integrity, risk and compliance, and data and cybersecurity), employees (purpose and culture, business and talent growth, engagement and diversity), as well as society (community, environmental, positive relationships with key external stakeholders and transparency). Moreover, the manager has committed US$20m to support the causes of the Hg Foundation from its launch in July 2020 to date, the goal of which is to help develop the skills most required for employment in the technology industry, with a focus on individuals who may otherwise experience barriers to accessing these skills.
Capital structure
HgT’s share capital consisted of 457.7m ordinary shares as at end-March 2024. Each year, HgT’s directors renew the authority to buy back up to 14.99% of the issued share capital, at prices below the prevailing NAV per ordinary share. HgT did not perform any share buybacks in FY23 or so far in FY24. A general authority to allot shares (or to grant rights over shares) up to a maximum nominal amount of £3.8m (representing c 33% of HGT’s ordinary share capital) was also given to directors at the AGM in 2024.
|
Exhibit 17: Major shareholders |
Exhibit 18: Average daily traded value |
|
|
|
Source: LSEG Data & Analytics. Note: At 6 August 2024. |
Source: LSEG Data & Analytics. Note: 12 months to 5 August 2024. |
|
Exhibit 17: Major shareholders |
|
|
Source: LSEG Data & Analytics. Note: At 6 August 2024. |
|
Exhibit 18: Average daily traded value |
|
|
Source: LSEG Data & Analytics. Note: 12 months to 5 August 2024. |
The board
HgT’s board, led by Jim Strang (chair of the board since May 2020), consists of six non-executive directors.
Jim Strang has more than 20 years of PE industry experience, recently serving as chairman EMEA and managing director at Hamilton Lane. He now also serves on the boards of Pictet Alternative Advisors and UK-based investment company BGF.
Erika Schraner (senior independent director) has 25 years of experience from a number of senior leadership positions in Silicon Valley, the UK and Europe, including Fortune 500 technology companies and the Big Four accounting firms. She is now an NED at JTC Group, Bytes Technology, Pod Point Group Holdings and Videndum.
Richard Brooman (chairman of the Audit, Valuation and Risk Committee) qualified as a chartered accountant with Price Waterhouse with prior experience at Mars (where he held senior operational and financial positions) and SmithKline Beecham (as CFO of the global consumer healthcare business), as well as VCI (group finance director) and Sherwood International (CFO). He has served on HGT’s board since 2007.
Helena Coles (chairman of the management engagement committee) brings more than 30 years of investment experience, gained through the perspectives of an asset owner, fund manager, as well as UK regulator, and having co-founded and built a successful fund management firm with peak assets under management of over $10bn.
John Billowits has over 25 years of operational experience and a wealth of investment expertise in the software sector through his past roles and current appointments on boards of US, Canadian and European software companies, including Constellation Software.
Pilar Junco is a managing partner and chief client officer at AltamarCAM Partners, a pan-European solutions provider for private markets. Before joining AltamarCAM, she worked at Blackstone for 10 years, most recently as senior managing director and head of non-US (EMEA and APAC) private wealth management and retail business.
Exhibit 19: HgT’s board of directors
Board member |
Date of appointment |
Remuneration in FY23 (£) |
Shareholdings at end-FY23 (number of shares) |
Jim Strang (Chairman) |
March 2018 |
105,000 |
167,282 |
Erika Schraner |
August 2022 |
58,938 |
14,148 |
Richard Brooman |
October 2007 |
66,625 |
36,000 |
Helena Coles |
November 2023 |
5,849 |
2,611 |
John Billowits |
May 2024 |
- |
N/A |
Pilar Junco |
July 2020 |
51,250 |
- |
Source: HgT
|
|
Research: Real Estate
The completion of Regional REIT’s (RGL’s) £110.5m equity raise has reduced gearing, including repayment of its retail bonds, and provides additional flexibility to its capex and disposal programmes. With funding uncertainty lifted, investor attention is likely to refocus on operational performance and the wider outlook for the regional office sector. Robust occupier demand for good quality assets continues to generate rental growth and the tone of the investment market has begun to improve.