Last close As at 05/08/2026
—
— 0.00 (0.00%)
Market capitalisation
—
Research: Investment Companies
Fidelity China Special Situations (FCSS) had a challenging year in 2018, heavily influenced by the correction in Chinese equities that was longer and deeper than in other major stock markets. However, the trust’s longer-term returns have been strong, with an impressive 14.0% annualised NAV total return over five years, which is well ahead of its benchmark MSCI China index, as well as the MSCI World and FTSE All-Share indices. The market fall created compelling opportunities for manager Dale Nicholls, who added to holdings in high-quality companies that were trading at historically low valuations. The manager is optimistic about the long-term outlook, but he anticipates that volatility may persist and cut net market gearing from c 23% to c 18% in December 2018, mainly via index hedges.
Written by
Fidelity China Special Situations |
Confident in the long-term outlook |
Investment trusts |
25 January 2019 |
Share price/discount performance
Three-year performance vs index
Gearing
Analysts
|
|||||||||||||||||||||||||||||||||||||||||||||||||||||||||||||||||||||||||||||||||||||||
Fidelity China Special Situations (FCSS) had a challenging year in 2018, heavily influenced by the correction in Chinese equities that was longer and deeper than in other major stock markets. However, the trust’s longer-term returns have been strong, with an impressive 14.0% annualised NAV total return over five years, which is well ahead of its benchmark MSCI China index, as well as the MSCI World and FTSE All-Share indices. The market fall created compelling opportunities for manager Dale Nicholls, who added to holdings in high-quality companies that were trading at historically low valuations. The manager is optimistic about the long-term outlook, but he anticipates that volatility may persist and cut net market gearing from c 23% to c 18% in December 2018, mainly via index hedges.
12 months ending |
Share price |
NAV |
MSCI China (%) |
MSCI China Small Cap (%) |
MSCI World (%) |
FTSE All-Share (%) |
31/12/14 |
27.4 |
32.5 |
15.0 |
5.9 |
12.1 |
1.2 |
31/12/15 |
8.2 |
12.5 |
(2.3) |
9.5 |
5.5 |
1.0 |
31/12/16 |
20.3 |
17.5 |
20.6 |
12.2 |
29.0 |
16.8 |
31/12/17 |
39.8 |
40.3 |
41.0 |
13.8 |
12.4 |
13.1 |
31/12/18 |
(18.8) |
(21.6) |
(13.7) |
(14.5) |
(2.5) |
(9.5) |
Source: Thomson Datastream. Note: All % on a total return basis in pounds sterling.
Investment strategy: Unconstrained stock selection
Following a bottom-up process, unrestricted by top-down allocations, the manager seeks cash-generative companies with experienced management in structurally faster-growing areas of the economy. The trust has a bias to small/mid-cap stocks, which tend to be under-researched and often provide better opportunities. Fidelity’s extensive analyst team conducts in-depth company research, with site visits and company meetings a key part of the investment process, and risk management is a priority. Contracts for difference (CFDs) are used to add gearing, take short positions and hedge market risks, alongside futures and options. Unlisted holdings may represent up to 10% of the portfolio and there is a 15% limit on short positions.
Market outlook: Relatively attractive fundamentals
The pace of China’s GDP growth is favourable for corporate earnings prospects, although it is broadly expected to slow over time. Currently, deleveraging policies are affecting business and consumer confidence, along with ongoing concerns over trade with the US. However, the resulting slowdown has largely been reflected in the 2018 stock market correction and Chinese equity valuations are now lower than for many other major markets. While stock price volatility may remain elevated, a form of stimulus or a prospective resolution of the US-China trade dispute could act as a near-term catalyst for a stock market upturn. Longer term, increasing inclusion of Chinese shares in global equity indices could support higher valuation levels.
Valuation: Discount at narrow end of three-year range
FCSS’s current 11.9% share price discount to NAV (including income) is towards the narrow end of its 9.7% to 20.0% three-year range and compares with its 12.1%, 13.9% and 13.4% averages over one, three and five years respectively.
Exhibit 1: Trust at a glance
Investment objective and fund background |
Recent developments |
|||||||||||||||||||||||||||||||||||||||||||||||||||||||||||||||||||||||||||||||||||||||||||||||
Fidelity China Special Situations aims to achieve long-term capital growth from an actively managed portfolio made up primarily of securities issued by companies listed in China or Hong Kong and Chinese companies listed elsewhere. It may also invest in listed companies with significant interests in China and Hong Kong. Futures, options and CFDs are used to provide gearing, as well as to take short positions. |
■ 23 November 2018: Interim results to 30 September 2018 – NAV TR -9.1% versus benchmark TR -4.0%; share price TR -8.8%. ■ 22 October 2018: Vera Hong Wei resigned from board, effective 31 October 2018. ■ 25 July 2018: Mike Balfour appointed as a director, effective 1 October 2018; John Ford stepped down from the board, having departed Fidelity at end-2017; David Causer to step down at 2019 AGM after nine years as a director. ■ 1 July 2018: New variable 0.70-1.10% management fee effective, replacing fixed management fee and variable performance fee structure. |
|||||||||||||||||||||||||||||||||||||||||||||||||||||||||||||||||||||||||||||||||||||||||||||||
Forthcoming |
Capital structure |
Fund details |
||||||||||||||||||||||||||||||||||||||||||||||||||||||||||||||||||||||||||||||||||||||||||||||
AGM |
July 2019 |
Ongoing charges |
1.11% (1.35% incl interest chgs) |
Group |
Fidelity International |
|||||||||||||||||||||||||||||||||||||||||||||||||||||||||||||||||||||||||||||||||||||||||||
Final results |
June 2019 |
Net market gearing* |
17.8% |
Manager |
Dale Nicholls |
|||||||||||||||||||||||||||||||||||||||||||||||||||||||||||||||||||||||||||||||||||||||||||
Year end |
31 March |
Annual mgmt fee |
Variable: 0.7-1.1% of net assets (see page 7) |
Address |
Beech Gate, Millfield Lane, Lower Kingswood, Tadworth, Surrey, KT20 6RP |
|||||||||||||||||||||||||||||||||||||||||||||||||||||||||||||||||||||||||||||||||||||||||||
Dividend paid |
July 2019 |
Performance fee |
None |
|||||||||||||||||||||||||||||||||||||||||||||||||||||||||||||||||||||||||||||||||||||||||||||
Launch date |
April 2010 |
Trust life |
Indefinite |
Phone |
0800 41 41 10 |
|||||||||||||||||||||||||||||||||||||||||||||||||||||||||||||||||||||||||||||||||||||||||||
Continuation vote |
No |
Loan facilities |
US$150m revolving |
Website |
||||||||||||||||||||||||||||||||||||||||||||||||||||||||||||||||||||||||||||||||||||||||||||
Dividend policy and history (financial years) |
Share buyback policy and history (financial years) |
|||||||||||||||||||||||||||||||||||||||||||||||||||||||||||||||||||||||||||||||||||||||||||||||
Although focused on capital growth, as an investment trust FCSS pays out at least 85% of income received as an annual dividend. |
FCSS has authority to buy back up to 14.99% of its shares (at a discount) and allot up to 10% (at a premium). There is no strict discount control mechanism. |
|||||||||||||||||||||||||||||||||||||||||||||||||||||||||||||||||||||||||||||||||||||||||||||||
|
|
|||||||||||||||||||||||||||||||||||||||||||||||||||||||||||||||||||||||||||||||||||||||||||||||
Shareholder base (as at 31 December 2018) |
Portfolio exposure by market cap (as at 31 December 2018) |
|||||||||||||||||||||||||||||||||||||||||||||||||||||||||||||||||||||||||||||||||||||||||||||||
|
|
|||||||||||||||||||||||||||||||||||||||||||||||||||||||||||||||||||||||||||||||||||||||||||||||
Top 10 holdings (as at 31 December 2018) |
||||||||||||||||||||||||||||||||||||||||||||||||||||||||||||||||||||||||||||||||||||||||||||||||
|
||||||||||||||||||||||||||||||||||||||||||||||||||||||||||||||||||||||||||||||||||||||||||||||||
Source: Fidelity China Special Situations, Edison Investment Research, Bloomberg, Morningstar. Note: *Gearing net of short positions. **Adjusted for gearing and index hedges. ***N/A where not in end-December 2017 top 10.
Market outlook: Promising longer-term fundamentals
The Chinese stock market correction in 2018 was longer and deeper than the stock market declines in many other regions, with the MSCI China index falling 25% in sterling terms from mid-June to mid-October, compared with a 16% drop in the MSCI World index between late August and late December. The weakness of Chinese equities in 2018 broadly offset their outperformance in 2017, and over three years to end-December 2018, the MSCI China and MSCI World indices delivered reasonably similar returns, significantly ahead of the FTSE All-Share index (Exhibit 2 chart). The market fall and strong underlying corporate earnings growth in 2018 have led to a decline in the Chinese stock market forward P/E multiple to 10.0x at end-December 2018, slightly lower level than emerging markets overall, and at a c 26% discount to developed markets (Exhibit 2 table).
|
Exhibit 2: Market performance and valuation |
|||||||||||||||||||||||||
Chinese equities performance vs World and UK indices (£ terms) |
Chinese equities valuation metrics vs World and UK indices |
||||||||||||||||||||||||
|
|
||||||||||||||||||||||||
|
Source: Thomson Datastream, Edison Investment Research, MSCI. Note: Valuation data as at end-December 2018. |
|||||||||||||||||||||||||
The International Monetary Fund’s (IMF) October 2018 forecasts show 6.1% annualised Chinese GDP growth from 2018 to 2023, compared with 3.8% for other emerging market economies and 1.8% for advanced economies. China’s superior economic growth provides a favourable backdrop for corporate earnings growth, which supports a positive market outlook, alongside relatively low valuation metrics. While elevated volatility may remain a feature of the Chinese stock market due to changing views over the risk of economic slowdown, progress towards resolution of the US-China trade dispute could act as a catalyst for a near-term re-rating of Chinese stocks. Longer term, the rising inclusion of Chinese equities in global market indices could support higher valuation levels.
Fund profile: Chinese equity growth portfolio
Launched in April 2010, FCSS is an LSE-listed investment trust that aims to generate long-term capital growth from a diversified portfolio of Chinese equities, primarily comprising companies listed in China or Hong Kong, as well as Chinese companies listed on other exchanges. Performance is benchmarked against the MSCI China index (sterling adjusted), but exposures are unconstrained by index weightings. Portfolio construction is based on in-depth, bottom-up analysis conducted by Fidelity’s extensive team of research analysts, who cover c 600 stocks in the Greater China investment universe. The manager favours investing in areas of the economy with stronger structural growth prospects – mainly as a result of rising domestic consumption and ongoing structural reforms – and the trust also has a bias to small/mid-cap companies. The portfolio typically comprises 130-140 stock holdings, and includes unlisted investments as well as short positions. Gearing is permitted up to 30% of net assets, with CFDs used in addition to bank borrowings. Fidelity International is FCSS’s investment manager, and Dale Nicholls has managed the portfolio since April 2014. Based in Hong Kong, Nicholls has 15 years’ experience investing in China.
The fund manager: Dale Nicholls
The manager’s view: Confident in the long-term outlook
Even if there is further near-term market weakness, Nicholls remains confident in the long-term outlook for the trust’s investments. While acknowledging that the Chinese stock market is likely to remain volatile, he is reassured by current low valuations and negative factors already being well publicised. The manager emphasises that medium-term earnings growth prospects for portfolio companies remain strong, even with the prospective backdrop of a broad economic slowdown. He also reiterates that portfolio companies are predominantly focused on the domestic Chinese market with only 1.5% of revenues derived from the US.
Nicholls highlights that the portfolio included a number of strong performers in 2018 such as hotpot condiment supplier Yihai International, which continued to deliver strong growth, helped by its collaboration with restaurant chain Haidilao, which successfully listed on the Hong Kong stock exchange in September 2018. However, FCSS’s lack of exposure to some of the stronger performers in the benchmark index contributed to portfolio underperformance. Additionally, certain portfolio holdings were marked down sharply, such as apparel e-commerce platform Vipshop, which faced a challenging environment with strong competition, and software and internet services company Kingsoft, which experienced delays in launching new online games.
The manager comments that recent portfolio activity has centred around compelling opportunities created by the relatively indiscriminate nature of the market sell-off. He points out that certain sectors, such as insurance and investment companies, are particularly market sensitive and many companies have seen their valuations drop to historically low levels which significantly discount their long-term growth prospects. Although some ‘A’ shares have recently been included in MSCI indices, which has supported share prices, others have fallen to historically low valuations and FCSS has made selective investments in industrial companies in the ‘A’ share market, in segments such as artificial intelligence and surveillance. Nicholls had increased the trust’s net market gearing from c 15% in March 2018 to c 23% at end-November 2018, but cut it to c 18% at end-December 2018, mainly through increasing index hedge positions.
Asset allocation
Investment process: Fundamentals-driven, bottom-up selection
Portfolio construction is driven by bottom-up stock selection based on company fundamentals, with no restrictions imposed over sector allocations. The portfolio manager is supported by Fidelity’s team of 23 research analysts (based in Hong Kong, Singapore and Shanghai) who conduct detailed analysis on Chinese equities. The manager seeks to invest in highly cash-generative companies run by capable management teams, and focuses on industries with above-average structural growth prospects within the Chinese economy. The portfolio has a bias to small- and mid-cap stocks, as the manager tends to find greater investment opportunities in this area of the market, due to stocks being under-researched and valuations not reflecting companies’ long-term growth prospects. Company meetings and site visits are key aspects of the research process for assessing prospective investments, as well as monitoring existing holdings. Risk management is an important part of the process, particularly as investing in small-cap stocks can carry higher risks.
The same overall research-intensive approach is applied to investments in listed and unlisted companies, as well as short positions. Individual holdings are restricted to 15% of the portfolio at the time of acquisition, with a 10% limit on the total value of unlisted investments and a 15% limit on total short exposure. Investments in China ‘A’ shares are made using Fidelity’s Qualified Foreign Institutional Investor (QFII) licence, as well as via brokers who hold a QFII.
Current portfolio positioning
FCSS’s portfolio is diversified across 130-140 investments, but is relatively concentrated in the top 10 holdings, which accounted for 34.5% of the portfolio at end-December 2018 (Exhibit 1). The two largest holdings, Tencent and Alibaba, represented 18.5% of the portfolio, but this is underweight relative to their 27.9% combined index weight. Certain Global Industry Classification Standard (GICS) sector definitions were changed in September 2018, leading to the reclassification of Tencent and Alibaba from information technology to communication services and consumer discretionary, respectively, and this contributed to the largest changes in FCSS’s sector exposure over the year to end-December 2018 (Exhibit 3).
Exhibit 3: Portfolio sector exposure vs benchmark (% unless stated)
Portfolio end-Dec 2018 |
Portfolio end-Dec 2017 |
Change (pp) |
Index weight |
Active weight vs index (pp) |
Trust weight/ index weight (x) |
|
Consumer discretionary |
27.2 |
26.0 |
1.2 |
20.0 |
7.2 |
1.4 |
Communication services |
19.2 |
1.1 |
18.0 |
27.4 |
(8.2) |
0.7 |
Financials |
14.2 |
11.0 |
3.2 |
23.3 |
(9.0) |
0.6 |
Information technology |
14.0 |
32.3 |
(18.3) |
2.5 |
11.5 |
5.6 |
Industrials |
10.1 |
11.4 |
(1.4) |
5.4 |
4.7 |
1.9 |
Healthcare |
6.1 |
5.2 |
0.9 |
2.8 |
3.3 |
2.2 |
Consumer staples |
5.8 |
6.2 |
(0.5) |
2.6 |
3.2 |
2.2 |
Energy |
1.7 |
2.1 |
(0.5) |
5.2 |
(3.5) |
0.3 |
Materials |
1.1 |
1.1 |
(0.0) |
2.1 |
(1.0) |
0.5 |
Real estate |
0.5 |
1.4 |
(0.9) |
5.8 |
(5.3) |
0.1 |
Utilities |
0.3 |
2.1 |
(1.7) |
3.1 |
(2.8) |
0.1 |
100.0 |
100.0 |
100.0 |
Source: Fidelity China Special Situations, Edison Investment Research. Note: Adjusted for gearing.
FCSS’s portfolio is broadly diversified but exposures are highly differentiated from the index, with sector weightings broadly reflecting the focus on faster-growing areas of the Chinese economy, mainly driven by rising domestic consumption and structural reforms. Information technology and consumer discretionary are the trust’s most notable overweights, with financials and communication services the largest underweights. FCSS does not hold any bank shares, and its 10 largest underweight stock positions include four banks, which together represent 12.3% of the index.
Two of FCSS’s prior unlisted holdings, Aurora Mobile and Meituan Dianping listed during 2018, and two new unlisted stocks were added: SenseTime – an artificial intelligence technology company, and an unnamed leading drone manufacturer. At end-December 2018, the current four unlisted investments represented c 5% of the portfolio. Some short positions, particularly in more cyclical stocks, were closed as share prices fell during the second half of 2018, but new short positions were added, and short exposure equated to c 3% of net assets at end-December 2018.
Performance: Ahead of benchmark over longer term
As illustrated in Exhibit 4, FCSS’s weak shorter-term performance largely reflects the sell-off in Chinese equities, with the trust’s NAV dropping 31% between mid-June and mid-October 2018 when the MSCI China index fell 25% in sterling terms. Underperformance during this period of market weakness is not entirely unexpected given the trust’s c 20% net market gearing, which amplifies both positive and negative returns. The trust’s longer-term returns have been reasonably strong, with its share price and NAV total returns outperforming the MSCI China index over five years to end-December 2018 and since its inception in 2010. From its launch to end-December 2018, which also includes a 32% fall in NAV during 2011, FCSS has achieved a 10.0% pa NAV total return, meaningfully ahead of the MSCI China index’s 6.1% pa return.
While underperforming over one year, FCSS’s NAV total return is ahead of the FTSE All-Share index over three and five years and since the trust’s inception, as shown in Exhibit 5. FCSS has also outperformed the MSCI World index over five years.
|
Exhibit 4: Investment trust performance to 31 December 2018 |
||||||||
Price, NAV and benchmark total return performance, one-year rebased |
Price, NAV and benchmark total return performance (%) |
|||||||
|
|
|||||||
|
Source: Thomson Datastream, Edison Investment Research. Note: Three-year, five-year and SI (since inception) performance figures annualised. Inception date is 16 April 2010. |
||||||||
|
Exhibit 5: Share price and NAV total return performance, relative to indices (%) |
||||||||
|
One month |
Three months |
Six months |
One year |
Three years |
Five years |
Since inception |
|
Price relative to MSCI China |
0.5 |
(4.0) |
(8.8) |
(5.9) |
(6.9) |
14.2 |
21.9 |
|
NAV relative to MSCI China |
(1.4) |
(5.5) |
(11.0) |
(9.2) |
(11.9) |
16.8 |
36.9 |
|
Price relative to MSCI China Small Cap |
(2.0) |
(3.5) |
(5.5) |
(5.0) |
25.1 |
48.8 |
78.1 |
|
NAV relative to MSCI China Small Cap |
(3.8) |
(4.9) |
(7.8) |
(8.3) |
18.5 |
52.3 |
100.1 |
|
Price relative to MSCI World |
2.1 |
(1.2) |
(17.3) |
(16.7) |
(3.4) |
12.6 |
(12.4) |
|
NAV relative to MSCI World |
0.2 |
(2.7) |
(19.3) |
(19.6) |
(8.6) |
15.3 |
(1.6) |
|
Price relative to FTSE All-Share |
(1.7) |
(2.3) |
(12.3) |
(10.3) |
14.3 |
54.1 |
20.7 |
|
NAV relative to FTSE All-Share |
(3.6) |
(3.7) |
(14.4) |
(13.4) |
8.2 |
57.7 |
35.6 |
|
|
Source: Thomson Datastream, Edison Investment Research. Note: Data to end-December 2018. Inception date is 16 April 2010. Geometric calculation. |
||||||||
FCSS’s outperformance over five years includes shorter periods of relative strength and weakness, highlighting the differentiation in the trust’s performance from the MSCI China index (Exhibit 6).
|
Exhibit 6: NAV total return performance relative to benchmark over five years |
|
|
Source: Thomson Datastream, Edison Investment Research |
Discount: At the narrower end of its three-year range
As illustrated in Exhibit 7, FCSS’s share price discount to NAV (including income) has largely remained in a 10–15% range since October 2016. The discount reached a three-year wide point of 20% in early 2016, when the MSCI China index had fallen by c 40% (in sterling terms) from its 2015 peak, which compares to its c 25% fall during 2018. FCSS’s current 11.9% discount is towards the narrow end of its 9.7% to 20.0% three-year range and compares with its 12.1%, 13.9% and 13.4% averages over one, three and five years respectively. Since its launch in April 2010, FCSS’s shares have traded between a 13.2% premium and a 23.4% discount to NAV, usually with a strong influence from changes in broad investor sentiment towards Chinese equities.
|
Exhibit 7: Share price discount to NAV (including income) over three years (%) |
|
|
Source: Thomson Datastream, Edison Investment Research |
Capital structure and fees
FCSS has 549.6m ordinary shares in issue, with a further 21.8m shares held in treasury. The trust has authority to buy back up 14.99% of its outstanding shares at a discount to NAV and allot up to 10% of issued capital at a premium. There is no strict discount control mechanism, and buybacks have been modest since FY16 (Exhibit 1), with 1.8m shares (0.3% of issued capital) repurchased so far in FY19. Borrowing is restricted to 25% of net assets, while total gearing is permitted up to 30% of net assets. Gearing is achieved via a fully-drawn US$150m credit facility (equating to c 8% gearing), supplemented by long CFDs on a number of portfolio holdings. The credit facility runs to February 2020 and charges interest at a fixed 3.01% pa, while CFDs incur a lower cost. Short positions on individual stocks are also taken using CFDs, while market risk is hedged using CFDs, index futures and options. At end-December 2018, FCSS had 23.7% gross market gearing and 17.8% net market gearing (net of short positions).
Since July 2018, FCSS has paid a management fee of 0.90% pa on net assets, with a ±0.20% variation fee, based on the trust’s NAV returns relative to the benchmark index. This new variable fee structure has reduced the range of potential fees payable to 0.7-1.1% pa, from 1.0-2.0% pa previously. A £0.1m annual administration fee is also paid to the manager (£0.6m prior to FY19). Management fees and finance costs are allocated 75% to capital and 25% to revenue, reflecting historical contributions to total returns. The published FY18 ongoing charge of 1.35% includes interest charges (0.24pp), and the comparable underlying 1.11% charge was slightly lower than the 1.16% published FY17 ongoing charge.
Dividend policy and record
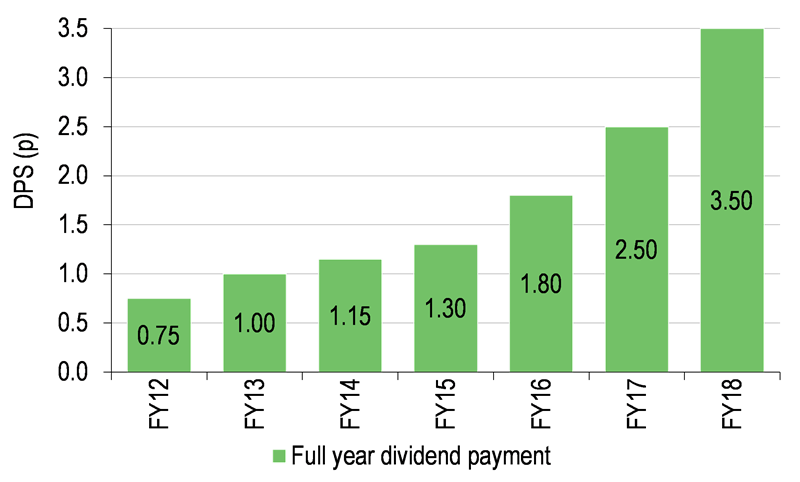
FCSS pays an annual dividend in July/August each year, distributing at least 85% of its revenue earnings, as required to maintain its investment trust status. The fund has a capital growth objective and no commitment has been made in relation to growing or maintaining the dividend. However, the manager’s focus on cash-generative companies has led to the portfolio consistently producing a material level of income, and FCSS’s dividend has been increased every year since its inception. The allocation of management fees and finance costs between revenue and capital accounts was revised in FY18, which increased the amount available for distribution. As a result, the FY18 dividend was increased by 40.0% to 3.50p (Exhibit 1), which equates to a 1.8% dividend yield, based on the current share price. While the annual payout will vary according to portfolio income generation, FCSS has revenue reserves equating to 2.06p per share, which could be used to smooth future dividend distributions.
Peer group comparison
Exhibit 8 shows a comparison of FCSS with a range of open- and closed-ended funds that invest primarily in Chinese equities. FCSS is a member of the AIC Country Specialists: Asia Pacific sector, but JPMorgan Chinese is the only other fund in the sector that focuses on China, so we show averages for the AIC Asia Pacific ex-Japan sector, which is more relevant due to its 39% aggregate exposure to China & Greater China. We also include IA China/Greater China open-ended funds larger than £300m with more than five years’ track record in the comparison.
FCSS’s NAV total return is lower than the open- and closed-ended peer group averages over one and three years, but is clearly ahead of the averages over five years and is the highest of all funds shown over the 8.8 years since its inception in April 2010. The shorter-term weak relative performance is not unexpected given the scale of the Chinese market correction in 2018 relative to other markets, and FCSS’s relatively high gearing, which amplifies positive and negative returns. The trust’s NAV total return is better than JPMorgan Chinese over one year, marginally weaker over three years, and appreciably higher over the longer periods shown. FCSS’s ongoing charge is higher than the AIC Asia Pacific ex-Japan sector average, but is one of the lowest among its open- and closed-ended single-country fund peers. FCSS has significantly higher gearing than average among its closed-ended peers, although its net market gearing (net of short positions) is slightly more modest at c 18%. FCSS’s share price discount to NAV is wider than the 11.2% average for the AIC Country Specialists: Asia Pacific sector, and its dividend yield is above average among single-country fund peers.
Exhibit 8: Selected peer group investing in Chinese equities as at 24 January 2019*
% unless stated |
Market cap/ fund size £m |
NAV TR |
NAV TR |
NAV TR |
NAV TR |
Discount (cum-fair) |
Ongoing charge |
Perf. |
Gearing |
Dividend yield |
Fidelity China Special Situations |
1,069.5 |
(24.7) |
56.9 |
98.6 |
134.2 |
(11.4) |
1.11 |
Yes |
124 |
1.8 |
JPMorgan Chinese |
170.5 |
(28.6) |
57.7 |
59.8 |
89.6 |
(12.1) |
1.34 |
No |
119 |
1.5 |
Asia Pacific ex-Japan average |
360.0 |
(8.2) |
58.8 |
65.4 |
109.0 |
(4.8) |
1.01 |
103 |
2.1 |
|
Open-ended funds |
||||||||||
Aberdeen Global Chinese Equity |
393.6 |
(10.6) |
50.3 |
45.2 |
51.8 |
1.98 |
No |
0.0 |
||
Allianz China Equity |
375.5 |
(17.3) |
48.6 |
56.6 |
56.3 |
2.28 |
No |
0.0 |
||
Barings Hong Kong China |
1,162.5 |
(17.0) |
55.6 |
58.5 |
46.4 |
1.70 |
No |
0.1 |
||
Fidelity China Focus |
3,587.0 |
(12.3) |
71.9 |
99.1 |
91.7 |
1.93 |
No |
0.9 |
||
First State Greater China Growth |
442.9 |
(11.8) |
62.9 |
67.4 |
118.9 |
1.81 |
No |
0.5 |
||
GAM Star China Equity |
335.7 |
(26.5) |
31.4 |
25.4 |
|
1.10 |
No |
0.6 |
||
HSBC GIF Chinese Equity |
930.2 |
(20.0) |
56.3 |
61.8 |
48.0 |
2.40 |
No |
0.0 |
||
Invesco Hong Kong & China |
347.5 |
(11.2) |
59.6 |
65.8 |
105.3 |
1.69 |
No |
0.4 |
||
Janus Henderson China Opps |
1,157.0 |
(21.0) |
64.0 |
73.4 |
86.1 |
1.72 |
No |
0.5 |
||
JPM Greater China |
366.7 |
(21.6) |
56.4 |
61.0 |
|
1.82 |
No |
0.5 |
||
Schroder ISF Greater China |
895.6 |
(12.1) |
76.1 |
87.4 |
97.5 |
1.86 |
No |
2.7 |
||
Templeton China |
327.7 |
(9.0) |
64.7 |
56.2 |
43.9 |
2.45 |
No |
0.0 |
||
Open-ended funds average |
860.2 |
(15.9) |
58.2 |
63.1 |
74.6 |
1.90 |
0.8 |
Source: Morningstar, Edison Investment Research. Note: *Performance to 23 January 2019. **SI is since FCSS’s inception in April 2010. TR = total return. Net gearing is total assets less cash and equivalents as a percentage of net assets (100 = ungeared).
The board
Following the appointment of Mike Balfour as a director and the resignation of Vera Hong Wei (appointed March 2016), both in October 2018, FCSS’s board comprises five independent non-executive directors. The other board members are chairman Nicholas Bull (appointed director February 2010, chairman July 2016), senior independent director Elisabeth Scott (appointed November 2011), David Causer (appointed February 2010) and Peter Pleydell-Bouverie (appointed February 2010). Causer will step down from the board at the conclusion of the 2019 AGM, when he will have completed more than nine years’ service. The board has engaged a specialist consultancy firm to assist in identifying a suitable candidate for recruitment as a new director.
|
|
Investment Companies
Destiny has had two positive and supportive announcements. The UK government has announced a number of initiatives and strategies to significantly enhance the return on investment for companies like Destiny that are developing new drugs to combat antimicrobial resistance (AMR). In addition Destiny has been awarded a £1.6m UK-China AMR grant.