For Thinfilm (THIN), 2016 has been principally dominated by a steadily growing list of new client partnerships, preparations for the move to the new R2R plant and a successful $61.7m funding round. The restart of EAS orders in January adds to revenue security this year. THIN is also shortly to scale up go-to-market activities for the Smart ElastiTag solution with hang-tag specialist, Bedford Industries, including a joint marketing road-show. This is expected to accelerate new NFC product field trial numbers in 2017, helped also by the recent launch of THIN’s cloud-based software portal CNECT. Earnings for 2016 were affected by higher than expected stockpiling costs and one-off FX losses, with no material impact on our forecasts. Our DCF valuation remains NOK8.19 per share.
Written by
Thin Film Electronics |
Cloud portal launch strengthens NFC proposition |
FY16 results |
Tech hardware & equipment |
6 March 2017 |
Share price performance
Business description
Next events
Analysts
|
||||||||||||||||||||||||||||||||||||||||||||||||||||||
For Thinfilm (THIN), 2016 has been principally dominated by a steadily growing list of new client partnerships, preparations for the move to the new R2R plant and a successful $61.7m funding round. The restart of EAS orders in January adds to revenue security this year. THIN is also shortly to scale up go-to-market activities for the Smart ElastiTag solution with hang-tag specialist, Bedford Industries, including a joint marketing road-show. This is expected to accelerate new NFC product field trial numbers in 2017, helped also by the recent launch of THIN’s cloud-based software portal CNECT. Earnings for 2016 were affected by higher than expected stockpiling costs and one-off FX losses, with no material impact on our forecasts. Our DCF valuation remains NOK8.19 per share.
Year |
Revenue ($m) |
PBT* |
EPS* |
DPS |
EV/Sales |
EV/EBITDA |
Yield |
12/15 |
4.4 |
(28.3) |
(5.3) |
0.0 |
86.6 |
N/A |
N/A |
12/16 |
3.8 |
(43.0) |
(6.6) |
0.0 |
87.5 |
N/A |
N/A |
12/17e |
10.8 |
(42.5) |
(5.2) |
0.0 |
36.2 |
N/A |
N/A |
12/18e |
48.3 |
(29.9) |
(3.7) |
0.0 |
8.9 |
N/A |
N/A |
Note: *PBT and EPS are normalised, excluding amortisation of acquired intangibles, exceptional items and share-based payments.
Fourth-quarter results affected by one-offs
Thinfilm reported Q4 revenue of $1.0m, up 23% q-o-q, reflecting increased contributions from a number of ongoing projects. EAS production ahead of the expected disruption from the move to the new site in Q217 was higher than we had forecast, leading to higher than expected expensed material costs. The group also incurred unexpectedly high forex losses due to the impact of the weak year-end NOK on the cash reserves boosted by the December equity raising. The recent completion of purchases of EAS roll-to-roll (R2R) equipment for the new production facility completes around one-third of the capex plans for the new R2R facility. Management has stated that the outlay was within 10% of the run-rate expected for the total planned $32m total R2R capex outlay.
Balance sheet strength gives Thinfilm space
Thinfilm remains in cash-consumption mode but with a strong balance sheet, helped by the $61.7m equity raising in December. We do not anticipate the need for further funding until 2018 and this may be met by strategic partnerships, customer funding, warrant conversions, etc. The decision to classify the group’s lease over its new production facility in San Jose as a financial lease has led us to include an additional $12.6m in 2016 year-end debt levels, resulting in net cash of $61.6m.
Valuation: NOK8.19 is milestone-dependant
It is worth noting that our DCF valuation of NOK8.19 per share relies on THIN achieving a number of key milestones, in particular completion of the R2R plant for EAS production by end 2017 and NFC label production in Q318, and sufficient order inflows to attain sales of 2.0bn NFC labels in 2019. This in turn assumes falling label price points arising from substantially lower unit production costs.
2016 results summary
Thinfilm reported slightly higher than expected revenues of $3.8m in 2016, albeit 13% down on the previous year. The y-o-y decline was principally due to lower sales revenues of $1.5m (2015: $2.2m) derived from product development projects, prototype deliveries and sales of EAS tags. Orders for EAS tags were interrupted by the need to add a glue layer, then delays in re-initiation of orders from Thinfilm’s go-to-market partner. Revenues were supported by government grants and other funded projects of $2.0m ($1.8m in 2015) and $0.4m ($0.4m) from sub-leasing part of the San Jose production site.
Reported operating losses in 2016 rose to $41.5m (2015: $31.8m). A major factor in the rise was 39% growth in uncapitalised R&D costs to $15.1m, relating to the development of roll-to-roll printing processes, printed batteries and displays. The cost was contained within a number of lines, including payroll costs, which grew 24% to $20.7m on the back of a 26% increase in employee numbers during 2016 to 134.
Another cost pressure related to the planned ramp up in production was a greater build-up of front-end buffer stock than we had forecast, ahead of the expected disruption to production from the planned move to group’s new Junction Avenue site in Q217. The company did not release exact figures for this, but we understand that the bulk of the stock build-up was expensed rather than capitalised and contained in the premises and supplies line, which grew 58% to $12.0m in 2016.
Thinfilm management put significant effort into marketing during the year, with notable successes in new partnership agreements and field trials. Part of this was reflected in rising personnel costs but marketing costs rose only moderately from $2.8m in 2015 to $3.0m.
Capital issues had a negative impact on financial costs during the year. The group reported a $2.7m expense (2015: $2.4m profit) in 2016. Of this $869k in Q1 was related to fees for the private placement to Woodford. Nevertheless, we understand that the high $1.4m expense in the fourth quarter was principally due to depreciation in the value of the NOK, which led to FX losses on the funds raised from the $61.7m capital issue in December and the costs of the capital issue in December were capitalised.
Local taxes resulted in a small $0.3m tax burden, which resulted in net post-tax losses rising from $29.4m to $44.5m and normalised post-tax losses rising from $28.3m to $43.1m after a $0.3m rise in share-based remuneration to $1.4m.
Fourth quarter results
Revenues in the fourth quarter fell 36% y-o-y to $1.0m, but were above our $0.9m forecast due to higher than expected technology access and development fees.
The inventory build-up mentioned above had a particularly strong impact on the Q4 results and contributed to a 59% y-o-y increase in Q416 premises and supplies costs to $4.3m. This cost line was also affected by the take-up of the lease over the new Junction Avenue site in November, which resulted in additional ancillary costs relating to insurance etc, alongside the costs incurred by the existing Zanker Road site. These costs will continue until the move in Q217, with the lease cost extending until June. Further pressure from 18% employee cost growth contributed to a 30% widening in Q4 operating losses to $12.7m ($12.4m normalised).
The new lease over the Junction Avenue site (where the R2R plant will be built) began in November but, being deemed a financial lease (as opposed to the operational lease designation for the existing site), the charge was reflected in the D&A and finance cost lines rather than in the premises/supplies line. We have restated our forecasts to account for this change (see Exhibit 4).
Exhibit 1: Quarterly earnings summary
US$000s |
Q416 |
Q415 |
Change |
2016 |
2015 |
Change |
Q116 |
Q216 |
Q316 |
Sales revenue |
466 |
989 |
(52.9) |
1,460 |
2,214 |
(34.0) |
150 |
597 |
248 |
Other operating revenue |
447 |
485 |
(7.8) |
1,964 |
1,791 |
9.7 |
557 |
483 |
476 |
Other income |
105 |
125 |
(15.7) |
421 |
408 |
3.2 |
104 |
105 |
105 |
Total revenue |
1,018 |
1,599 |
(36.3) |
3,845 |
4,413 |
(12.9) |
811 |
1,185 |
829 |
Payroll |
(5,410) |
(4,591) |
17.8 |
(20,674) |
(16,663) |
24.1 |
(4,648) |
(5,146) |
(5,470) |
Premises, supplies |
(4,263) |
(2,687) |
58.6 |
(11,970) |
(7,562) |
58.3 |
(2,479) |
(2,507) |
(2,721) |
Other operating costs |
(2,581) |
(3,105) |
(16.9) |
(8,327) |
(9,375) |
(11.2) |
(1,916) |
(2,492) |
(1,338) |
Total operating costs |
(12,561) |
(10,859) |
15.7 |
(42,151) |
(34,664) |
21.6 |
(9,229) |
(10,558) |
(9,802) |
EBITDA |
(11,543) |
(9,260) |
24.7 |
(38,306) |
(30,251) |
26.6 |
(8,418) |
(9,373) |
(8,973) |
Less share based payments |
(308) |
(476) |
(35.3) |
(1,180) |
(1,064) |
10.9 |
(186) |
(413) |
(273) |
EBITDA (norm) |
(11,235) |
(8,784) |
27.9 |
(37,126) |
(29,187) |
27.2 |
(8,232) |
(8,960) |
(8,700) |
Expensed R&D |
(3,417) |
(4,586) |
(25.5) |
(15,068) |
(10,812) |
39.4 |
(2,638) |
(5,262) |
(3,751) |
EBITDA (norm, excl expensed R&D) |
(7,565) |
(4,198) |
80.2 |
(21,805) |
(18,375) |
18.7 |
(5,594) |
(3,698) |
(4,949) |
D&A |
(1,126) |
(458) |
145.9 |
(3,176) |
(1,537) |
106.6 |
(552) |
(684) |
(814) |
Operating profit |
(12,669) |
(9,718) |
30.4 |
(41,482) |
(31,788) |
30.5 |
(8,970) |
(10,057) |
(9,787) |
Operating profit (norm) |
(12,361) |
(9,242) |
33.7 |
(40,302) |
(30,724) |
31.2 |
(8,784) |
(9,644) |
(9,514) |
Net financial items |
(1,421) |
368 |
NA |
(2,731) |
2,406 |
NA |
(967) |
(454) |
111 |
Profit Before Tax |
(14,090) |
(9,350) |
50.7 |
(44,213) |
(29,382) |
50.5 |
(9,937) |
(10,511) |
(9,676) |
Profit Before Tax (norm) |
(13,782) |
(8,874) |
55.3 |
(43,033) |
(28,318) |
52.0 |
(9,751) |
(10,098) |
(9,403) |
Tax |
19 |
0 |
NA |
(282) |
0 |
NA |
(299) |
(1) |
(1) |
Profit After Tax |
(14,071) |
(9,350) |
50.5 |
(44,495) |
(29,382) |
51.4 |
(10,236) |
(10,512) |
(9,677) |
Profit After Tax (norm) |
(13,510) |
(8,874) |
52.2 |
(43,315) |
(28,318) |
53.0 |
(10,050) |
(10,099) |
(9,404) |
EPS - (norm) ($) |
(0.018) |
(0.016) |
15.0 |
(0.066) |
(0.053) |
24.9 |
(0.016) |
(0.015) |
(0.014) |
Earnings per ADR (norm) ($) |
(0.184) |
(0.160) |
15.0 |
(0.657) |
(0.526) |
24.9 |
(0.163) |
(0.149) |
(0.138) |
Net cash |
61,624 |
15,940 |
286.6 |
61,624 |
15,940 |
286.6 |
49,122 |
36,808 |
27,122 |
Cash flow from operations |
(10,325) |
(7,779) |
32.7 |
(37,530) |
(26,036) |
44.1 |
(6,253) |
(11,517) |
(9,436) |
Cash burn (CF from ops and investments) |
(12,082) |
(7,809) |
54.7 |
(42,792) |
(31,440) |
36.1 |
(8,024) |
(12,828) |
(9,858) |
Purchases of PPE |
(1,544) |
100 |
(1,647.5) |
(4,464) |
(4,809) |
(7.2) |
(1,700) |
(945) |
(275) |
Cash flow from investments |
(1,757) |
(30) |
5,718.5 |
(5,262) |
(5,404) |
(2.6) |
(1,771) |
(1,311) |
(422) |
Source: Thinfilm, Edison Investment Research
Balance sheet
Cash flow from operations rose to $37.5m in 2016 from $26.0m the previous year. During Q4 the outflow was increased to $10.4m (Q415: $7.8m) by the stock-piling of front-end buffer stock and the additional premises costs discussed above. Including investments, cash burn reached $42.8m (2015: $31.4m), which was funded principally by equity issues totalling $101.1m, which resulted in cash levels rising from $15.9m to $74.2m (in line with our forecast of $74.0m). Netting off debt and the new $12.6m financial lease discussed above, net cash reserves at end 2016 were $61.6m.
Capex developments
The group completed the purchase of the EAS label-producing equipment for the R2R plant during December. The purchase cost comprises approximately one-third of the total $32m outlay planned for the entire plant including the Near Field Communication (NFC) transistor segment, which will be procured later this year. Based on the costs incurred in this purchase, management expects the final capex outlay for the R2R plant should be within 10% of the budgeted total amount of $32m.
New CNECT software portal solution
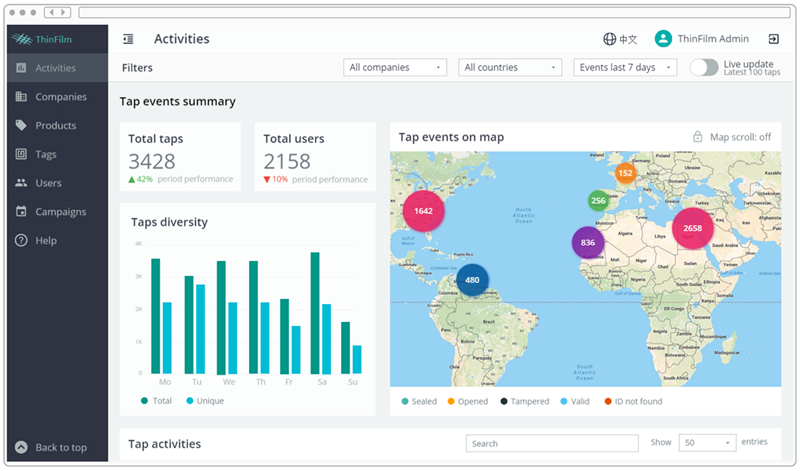
Thinfilm’s new software portal, which first went live in China in Q416, was launched internationally on 22 February. The portal primarily supports brand owners, enabling them to store and manage tag data, execute marketing campaigns, and track real-time consumer tapping activity. Consumers can also authenticate products via the portal with an integrated app.
The portal was designed to be accessed via a range of devices, using android and IoS systems. Functionality includes tracking the location of products, viewing real-time data on the number and location of consumers accessing the labels using interactive maps and charts. In addition, the brands are able to alter the messages accessed by consumers such that they can launch specific marketing campaigns or alter the message to suit specific consumer events, holidays or geographic locations.
Thinfilm is offering two versions, one in a Thinfilm skin and one that can be customised for brands. An application protocol interface (API) and software development kit (SDK) also allows third-party integrators to develop their own applications.
Thinfilm management is very bullish about the prospects for an acceleration in field trial orders in upcoming months helped by the launch of the portal internationally (after it was launched in China in Q416) and the launch of go-to-market activities with hang-tag specialist, Bedford Industries. The latter’s elasticised “smart hang-tag” labels are being marketed as a low-cost, high-impact method of attaching Thinfilm’s NFC labels to bottles and other packaging.
|
Exhibit 2: CNECT interface screen: live updates of tag interactions by time and location |
Exhibit 3: CNECTinterface: break out by smartphone type, type of label country and timeline |
|
|
|
Source: Thinfilm |
Source: Thinfilm |
|
Exhibit 2: CNECT interface screen: live updates of tag interactions by time and location |
|
|
Source: Thinfilm |
|
Exhibit 3: CNECTinterface: break out by smartphone type, type of label country and timeline |
|
|
Source: Thinfilm |
Earnings restated for new finance lease
Major impact is increase in net debt, slightly positive reported earnings impact
We have restated our earnings forecasts to account for the classification of Thinfilm’s 12-year lease over the new group’s new headquarters in the US as a financial, rather than operating, lease. A significant impact of this is that the lease liability of $12.6m at end-2016 has had to be treated like debt (unlike the existing lease on the Zanker Road site), so has had to be included in our net cash calculation, reducing the net cash figure for end 2016 to $61.6m. As we had assumed that the lease would be an operating lease, we have also had to adjust our forecast net cash/debt levels accordingly.
In the P&L we have had to transfer our forecast of lease costs on this site from premises and services and increase in depreciation and interest costs to reflect the creation of the lease property asset in the accounts under IFRS standards. Our revised forecast for 2017 reflects this with a $1.3m reduction in premises and services costs and $1.1m and $0.2m increases in D&A costs and interest expenses, respectively. By shifting expenses down the P&L, our otherwise unchanged forecasts of 2017 EBITDA, operating loss and net loss are reduced by 3%, 1% and 0.2%, respectively (see Exhibit 4).
Exhibit 4: Earnings revision – adjustments for accounting for new financial lease
$m |
2015 |
2016 |
2016e |
Chg (% ) |
2017e |
2017e |
Chg (%) |
2018e |
2018e previous |
Chg (%) |
Production |
||||||||||
NFC OpenSense (m units) |
0.0 |
0.8e |
0.8 |
0.0 |
8.0 |
8.0 |
0.0 |
50.0 |
50.0 |
0.0 |
NFC SpeedTap (m units) |
0.0 |
0.3e |
0.3 |
0.0 |
12.0 |
12.0 |
0.0 |
150.0 |
150.0 |
0.0 |
EAS labels (m units) |
11.2 |
2.3e |
2.3 |
0.0 |
15.0 |
15.0 |
0.0 |
346.0 |
346.0 |
0.0 |
Total OpenSense equivalent (OSE) units, m units) |
3.2 |
1.8 |
1.8 |
0.0 |
27.3 |
27.3 |
0.0 |
320.6 |
320.6 |
0.0 |
Average unit price/OSE (c) |
68.4 |
79.7 |
68.6 |
16.2 |
31.3 |
31.3 |
0.0 |
14.4 |
14.4 |
0.0 |
Sales Revenue |
2.2 |
1.5 |
1.3 |
16.2 |
8.6 |
8.6 |
0.0 |
46.3 |
46.3 |
0.0 |
Total revenue |
4.4 |
3.8 |
3.7 |
3.9 |
10.8 |
10.8 |
(0.0) |
48.3 |
48.3 |
0.0 |
Gross profit |
N/A |
(1.5) |
(1.9) |
(16.8) |
0.9 |
1.0 |
(3.8) |
11.7 |
11.8 |
(0.4) |
Gross profit margin (%) |
N/A |
neg. |
neg. |
N/A |
8.5 |
8.8 |
N/A |
24.3 |
24.4 |
(0.4) |
Payroll |
(16.7) |
(20.7) |
(21.3) |
(2.9) |
(23.1) |
(23.1) |
(0.0) |
(25.1) |
(25.1) |
0.0 |
Premises, supplies |
(7.6) |
(12.0) |
(10.4) |
14.8 |
(9.3) |
(10.7) |
(12.9) |
(2.1) |
(3.5) |
(40.5) |
Other operating costs |
(9.4) |
(8.3) |
(8.3) |
0.7 |
(16.7) |
(16.7) |
0.0 |
(44.5) |
(44.5) |
0.0 |
of which COGS (e) |
N/A |
(2.0) |
(2.3) |
(13.5) |
(6.8) |
(6.8) |
0.5 |
(33.6) |
(33.5) |
0.1 |
Total operating costs |
(34.7) |
(42.2) |
(41.4) |
1.9 |
(50.7) |
(52.0) |
(2.6) |
(73.4) |
(74.8) |
(1.9) |
EBITDA |
(30.3) |
(38.3) |
(37.7) |
1.7 |
(39.8) |
(41.2) |
(3.3) |
(25.1) |
(26.5) |
(5.3) |
EBITDA margin (%) |
neg. |
neg. |
neg. |
N/A |
neg. |
neg. |
N/A |
neg. |
neg. |
N/A |
less Share based payments |
(1.1) |
(1.2) |
(1.4) |
(14.0) |
(1.6) |
(1.6) |
(0.0) |
(1.7) |
(1.7) |
0.0 |
EBITDA (norm) |
(29.2) |
(37.1) |
(36.3) |
2.3 |
(38.3) |
(39.7) |
(3.5) |
(23.4) |
(24.8) |
(5.7) |
D&A |
(1.5) |
(3.2) |
(2.7) |
15.7 |
(4.1) |
(3.0) |
35.3 |
(5.9) |
(4.8) |
22.1 |
Operating profit |
(31.8) |
(41.5) |
(40.4) |
2.6 |
(43.9) |
(44.2) |
(0.7) |
(30.9) |
(31.3) |
(1.1) |
Operating profit (norm) |
(30.7) |
(40.3) |
(39.0) |
3.2 |
(42.4) |
(42.7) |
(0.7) |
(29.2) |
(29.6) |
(1.2) |
Finance costs |
2.4 |
(2.7) |
(1.2) |
118.7 |
(0.2) |
0.1 |
N/A |
(0.7) |
(0.5) |
34.3 |
Profit before Tax |
(29.4) |
(44.2) |
(41.7) |
6.1 |
(44.1) |
(44.2) |
(0.2) |
(31.6) |
(31.8) |
(0.5) |
Profit before Tax (norm) |
(28.3) |
(43.0) |
(40.3) |
6.8 |
(42.5) |
(42.6) |
(0.2) |
(29.9) |
(30.1) |
(0.6) |
Tax |
0.0 |
(0.3) |
(0.3) |
(6.9) |
0.0 |
0.0 |
N/A |
0.0 |
0.0 |
N/A |
Profit after tax |
(29.4) |
(44.5) |
(42.0) |
6.0 |
(44.1) |
(44.2) |
(0.2) |
(31.6) |
(31.8) |
(0.5) |
EPS - (norm) (c) |
(5.3) |
(6.6) |
(5.9) |
11.1 |
(5.2) |
(5.2) |
(0.2) |
(3.7) |
(3.7) |
(0.6) |
EPS - (IFRS) (c) |
(5.5) |
(6.8) |
(6.1) |
10.4 |
(5.4) |
(5.4) |
(0.2) |
(3.9) |
(3.9) |
(0.5) |
Capex |
(4.8) |
(4.8) |
(6.4) |
(25.2) |
(17.0) |
(17.0) |
0.0 |
(14.0) |
(14.0) |
0.0 |
Cash and cash equivalent |
(31.4) |
(42.8) |
(43.6) |
(1.9) |
(55.9) |
(55.9) |
0.0 |
(38.7) |
(38.7) |
(0.0) |
Cash generation (burn) |
15.9 |
73.9 |
74.0 |
(0.1) |
17.8 |
18.1 |
(1.4) |
(0.7) |
0.4 |
(284.9) |
Net cash/(debt)* |
15.9 |
61.6 |
74.0 |
(16.7) |
5.7 |
18.1 |
(68.4) |
(33.0) |
(20.6) |
60.0 |
Source: Thinfilm, Edison Investment Research. Note: *After creation of $13.6m financial lease in Q416 and its first time inclusion in net debt.
Exhibit 5: Financial summary
US$000s |
2014 |
2015 |
2016 |
2017e |
2018e |
||
Year-end December |
IFRS |
IFRS |
IFRS |
IFRS |
IFRS |
||
PROFIT & LOSS |
|||||||
Revenue |
|
|
4,479 |
4,413 |
3,845 |
10,824 |
48,333 |
EBITDA (norm) |
|
|
(23,550) |
(29,187) |
(37,126) |
(38,272) |
(23,362) |
Operating Profit (norm, before amort. and except.) |
|
|
(24,855) |
(30,724) |
(40,302) |
(42,359) |
(29,244) |
Intangible Amortisation |
0 |
0 |
0 |
0 |
0 |
||
Exceptionals |
0 |
0 |
0 |
0 |
0 |
||
Share-based payments |
(941) |
(1,064) |
(1,433) |
(1,572) |
(1,706) |
||
Operating Profit |
(25,796) |
(31,788) |
(41,482) |
(43,930) |
(30,950) |
||
Net Interest |
701 |
2,406 |
(2,731) |
(163) |
(680) |
||
Profit Before Tax (norm) |
|
|
(24,155) |
(28,318) |
(43,033) |
(42,522) |
(29,924) |
Profit Before Tax (FRS 3) |
|
|
(25,096) |
(29,382) |
(44,213) |
(44,093) |
(31,630) |
Tax |
0 |
0 |
(282) |
0 |
0 |
||
Profit After Tax (norm) |
(24,155) |
(28,318) |
(43,315) |
(42,522) |
(29,924) |
||
Profit After Tax (FRS 3) |
(25,096) |
(29,382) |
(44,495) |
(44,093) |
(31,630) |
||
Average Number of Shares Outstanding (m) |
493.5 |
535.4 |
659.1 |
816.8 |
816.8 |
||
EPS - normalised (c) |
|
|
(4.9) |
(5.3) |
(6.6) |
(5.2) |
(3.7) |
EPS - (IFRS) (c) |
|
|
(5.1) |
(5.5) |
(6.8) |
(5.4) |
(3.9) |
Dividend per share (c) |
0.0 |
0.0 |
0.0 |
0.0 |
0.0 |
||
EBITDA Margin (%) |
N/A |
N/A |
N/A |
N/A |
N/A |
||
Operating Margin (before GW and except.) (%) |
N/A |
N/A |
N/A |
N/A |
N/A |
||
BALANCE SHEET |
|||||||
Fixed Assets |
|
|
7,189 |
10,390 |
24,903 |
36,751 |
43,804 |
Intangible Assets |
2,319 |
2,602 |
3,142 |
3,142 |
3,142 |
||
Tangible Assets |
4,870 |
7,788 |
9,155 |
22,068 |
30,186 |
||
Investments |
0 |
0 |
12,607 |
11,542 |
10,476 |
||
Current Assets |
|
|
33,870 |
19,425 |
79,500 |
24,921 |
10,307 |
Stocks |
451 |
367 |
1,086 |
2,839 |
3,130 |
||
Debtors |
2,565 |
3,118 |
3,940 |
4,237 |
7,869 |
||
Cash |
30,854 |
15,940 |
74,474 |
17,844 |
(692) |
||
Other |
0 |
0 |
0 |
0 |
0 |
||
Current Liabilities |
|
|
(4,748) |
(5,170) |
(8,058) |
(9,632) |
(33,882) |
Creditors |
(4,748) |
(5,170) |
(7,789) |
(9,363) |
(12,613) |
||
Short term borrowings |
0 |
0 |
(269) |
(269) |
(21,269) |
||
Long Term Liabilities |
|
|
0 |
0 |
(12,581) |
(11,863) |
(11,040) |
Long term borrowings |
0 |
0 |
(12,581) |
(11,863) |
(11,040) |
||
Other long term liabilities |
0 |
0 |
0 |
0 |
0 |
||
Net Assets |
|
|
36,311 |
24,645 |
83,764 |
40,177 |
9,188 |
CASH FLOW |
|||||||
Operating Cash Flow |
|
|
(24,079) |
(26,036) |
(37,248) |
(38,748) |
(24,033) |
Net Interest |
569 |
146 |
88 |
(163) |
(680) |
||
Tax |
0 |
0 |
(282) |
0 |
0 |
||
Capex |
(3,217) |
(4,751) |
(4,806) |
(17,000) |
(14,000) |
||
Acquisitions/disposals |
(2,700) |
(799) |
(544) |
0 |
0 |
||
Financing |
16,477 |
16,527 |
101,057 |
0 |
0 |
||
Dividends |
0 |
0 |
0 |
0 |
0 |
||
Net Cash Flow |
(12,949) |
(14,914) |
58,265 |
(55,911) |
(38,714) |
||
Opening net debt/(cash) |
|
|
(43,803) |
(30,854) |
(15,940) |
(61,624) |
(5,713) |
Finance leases initiated |
0 |
0 |
(12,581) |
0 |
0 |
||
Other |
0 |
0 |
0 |
0 |
0 |
||
Closing net debt/(cash) |
|
|
(30,854) |
(15,940) |
(61,624) |
(5,713) |
33,001 |
Source: Thinfilm, Edison Investment Research. Note: Net debt levels increased by first time inclusion of a finance lease. We anticipate that current cash holdings will be sufficient to fund the business until 2018 and that any funding gap may be met by strategic partnerships, customer finance and/or exercise of existing warrants. For the purposes of our model we present this sum as short-term debt in the balance sheet.
Edison is an investment research and advisory company, with offices in North America, Europe, the Middle East and AsiaPac. The heart of Edison is our world-renowned equity research platform and deep multi-sector expertise. At Edison Investment Research, our research is widely read by international investors, advisers and stakeholders. Edison Advisors leverages our core research platform to provide differentiated services including investor relations and strategic consulting. Edison is authorised and regulated by the Financial Conduct Authority. Edison Investment Research (NZ) Limited (Edison NZ) is the New Zealand subsidiary of Edison. Edison NZ is registered on the New Zealand Financial Service Providers Register (FSP number 247505) and is registered to provide wholesale and/or generic financial adviser services only. Edison Investment Research Inc (Edison US) is the US subsidiary of Edison and is regulated by the Securities and Exchange Commission. Edison Investment Research Limited (Edison Aus) [46085869] is the Australian subsidiary of Edison and is not regulated by the Australian Securities and Investment Commission. Edison Germany is a branch entity of Edison Investment Research Limited [4794244]. www.edisongroup.com DISCLAIMER |
Frankfurt +49 (0)69 78 8076 960 Schumannstrasse 34b 60325 Frankfurt Germany |
London +44 (0)20 3077 5700 280 High Holborn London, WC1V 7EE United Kingdom |
New York +1 646 653 7026 245 Park Avenue, 39th Floor 10167, New York US |
Sydney +61 (0)2 8249 8342 Level 12, Office 1205 95 Pitt Street, Sydney NSW 2000, Australia |
Frankfurt +49 (0)69 78 8076 960 Schumannstrasse 34b 60325 Frankfurt Germany |
London +44 (0)20 3077 5700 280 High Holborn London, WC1V 7EE United Kingdom |
New York +1 646 653 7026 245 Park Avenue, 39th Floor 10167, New York US |
Sydney +61 (0)2 8249 8342 Level 12, Office 1205 95 Pitt Street, Sydney NSW 2000, Australia |
Ultra Electronics has more than delivered on our earnings expectations in FY16, with anticipated flat organic performance boosted by M&A and FX in the second half. The outlook is for slightly improved organic growth in FY17 marginally offset by dilution from the ID disposal. With net debt down significantly we would also expect increased M&A to augment the improving defence spending environment, which should accelerate in FY18. Having rolled the base forward a year, our fair value for now stands at 2,257p.