Last close As at 05/08/2026
—
— 0.00 (0.00%)
Market capitalisation
—
Research: Investment Companies
HarbourVest Global Private Equity (HVPE) gives investors access to selected private equity (PE) managers globally and a highly diversified portfolio of over 7,000 underlying companies. HVPE will celebrate its 10th anniversary in December 2017 and since inception its shares have outperformed global listed and unlisted equities, represented by the FTSE All-World and LPX 50 indices, by 11% and 36%, respectively. This solid performance is consistent with the mandate to generate long-term capital growth above global equities, and has been achieved with relatively low volatility due to HVPE’s high level of diversification.
Written by
HarbourVest Global Private Equity |
Closing in on a successful decade |
Investment companies |
16 August 2017 |
Share price/discount performance
Three-year performance vs index
Gearing
Analysts
|
|||||||||||||||||||||||||||||||||||||||||||||||||||||||||||||||||||||||||||||||||||||
HarbourVest Global Private Equity (HVPE) gives investors access to selected private equity (PE) managers globally and a highly diversified portfolio of over 7,000 underlying companies. HVPE will celebrate its 10th anniversary in December 2017 and since inception its shares have outperformed global listed and unlisted equities, represented by the FTSE All-World and LPX 50 indices, by 11% and 36%, respectively. This solid performance is consistent with the mandate to generate long-term capital growth above global equities, and has been achieved with relatively low volatility due to HVPE’s high level of diversification.
12 months ending |
Share price |
NAV |
Blended benchmark* (%) |
FTSE All-World (%) |
LPX 50 |
LPX 50 NAV |
30/06/13 |
39.3 |
13.3 |
21.2 |
21.4 |
40.6 |
17.7 |
30/06/14 |
7.6 |
5.0 |
9.6 |
9.6 |
14.3 |
4.1 |
30/06/15 |
25.2 |
19.8 |
10.1 |
10.2 |
9.7 |
4.6 |
30/06/16 |
5.1 |
24.4 |
13.9 |
14.0 |
6.7 |
23.3 |
30/06/17 |
40.2 |
14.7 |
22.9 |
23.0 |
34.3 |
17.7 |
Source: Thomson Datastream, Bloomberg. Note: *Blended benchmark is MSCI AC World up to 30 November 2016 and FTSE All-World thereafter. Total returns in pounds sterling.
Investment strategy: Diversified global exposure
HVPE provides a highly diversified route into the unlisted sector, which is many times larger than the listed sector and difficult for most individual investors to access directly. HarbourVest funds invest in third-party managers’ PE funds globally, using a network of specialists and relationships built up over 35 years. HVPE’s resulting overall portfolio is highly diversified by vintage year, strategy (dominated by buyout plus venture and growth capital), geography and industry, with more than 7,000 underlying companies. The investment mandate is to generate capital growth in excess of listed equities, hence the company does not pay a dividend, instead reinvesting cash proceeds into new opportunities.
A 10-year journey
Since inception almost a decade ago, HVPE has delivered solid outperformance of both global listed equities and its peer group. Volatility has been low, with the NAV declining in only one financial year (FY09) and even then by significantly less than global equities. HVPE has become a £1bn market cap company listed on the Main Market of the London Stock Exchange and a member of the FTSE 250 Index. The shareholder base has shifted away from US-based investors towards quality UK-based institutions and wealth managers. Share liquidity is good with £0.5m on average traded per day. FY17 results confirmed the long-term performance trend, with NAV up 24.8% in sterling terms and 10.3% in US dollar terms.
Valuation: Narrowing discount
HVPE shares are trading at a 14.7% discount to NAV, a notable improvement on the three-year average of 20.0% but still slightly wider than the peer group average of 13.1%. HVPE has delivered class-leading NAV total returns since inception and over five years, with above-average returns over three years. This suggests scope for the discount to narrow relative to the peer group.
Exhibit 1: Company at a glance
Investment objective and fund background |
Recent developments |
|||||||||||||||||||||||||||||||||||||||||||||||||||||||||||||||||||||||||||||||||||||||||
HarbourVest Global Private Equity is a Guernsey-incorporated, LSE-listed, closed-end investment company that aims to deliver long-term capital appreciation, while avoiding undue risk, by investing in a global portfolio of private equity investments diversified by stage, geography, strategy and industry. |
■ 12 May 2017: Results for the year ended 31 January 2017. NAV total return +24.8% in £ and +10.3% in US$. Share price total return +37.2% in £ and +21.1% in US$. US$251m realisation proceeds received. ■ 3 April 2017: Francesca Barnes appointed as a non-executive director. ■ 6 January 2017: Renewal of US$500m credit facility, extended to December 2020. ■ 8 November 2016: Home member state changed from the Netherlands to the UK. ■ 25 October 2016: HVPE shares delisted from Euronext Amsterdam. |
|||||||||||||||||||||||||||||||||||||||||||||||||||||||||||||||||||||||||||||||||||||||||
Forthcoming |
Capital structure |
Fund details |
||||||||||||||||||||||||||||||||||||||||||||||||||||||||||||||||||||||||||||||||||||||||
AGM |
July 2018 |
Ongoing charges |
2.17% (see page 12) |
Group |
HarbourVest Partners LLC |
|||||||||||||||||||||||||||||||||||||||||||||||||||||||||||||||||||||||||||||||||||||
Interim results |
September 2017 |
Net cash |
12.1% |
Manager |
HarbourVest LP |
|||||||||||||||||||||||||||||||||||||||||||||||||||||||||||||||||||||||||||||||||||||
Year end |
31 January |
Annual mgmt fee |
1.08% (see page 12) |
Address |
Dorey Court, Admiral Park, St Peter Port, Guernsey, GY1 2HT |
|||||||||||||||||||||||||||||||||||||||||||||||||||||||||||||||||||||||||||||||||||||
Dividend paid |
N/A |
Performance fee |
See page 12 |
|||||||||||||||||||||||||||||||||||||||||||||||||||||||||||||||||||||||||||||||||||||||
Launch date |
6 December 2007 |
Company life |
Indefinite |
Phone |
+44 (0)1481 702 400 |
|||||||||||||||||||||||||||||||||||||||||||||||||||||||||||||||||||||||||||||||||||||
Continuation vote |
N/A |
Loan facilities |
US$500m |
Website |
||||||||||||||||||||||||||||||||||||||||||||||||||||||||||||||||||||||||||||||||||||||
Share buyback policy and history (financial years) |
Age of the investment pipeline (31 January 2017) |
|||||||||||||||||||||||||||||||||||||||||||||||||||||||||||||||||||||||||||||||||||||||||
HVPE has authority to purchase up to 14.99% of its issued share capital. 2014 and 2015 costs reflect A share redemptions to distribute profits on the realisation of Absolute and Conversus co-investments. |
This analysis shows the age profile of HVPE’s investment pipeline (totalling US$1,201m). When commitments are made to underlying third-party funds or HarbourVest secondary or direct funds, these are classified as allocated. |
|||||||||||||||||||||||||||||||||||||||||||||||||||||||||||||||||||||||||||||||||||||||||
|
|
|||||||||||||||||||||||||||||||||||||||||||||||||||||||||||||||||||||||||||||||||||||||||
Shareholder base (as at 10 August 2017) |
Currency exposure of assets (as at 30 June 2017) |
|||||||||||||||||||||||||||||||||||||||||||||||||||||||||||||||||||||||||||||||||||||||||
|
|
|||||||||||||||||||||||||||||||||||||||||||||||||||||||||||||||||||||||||||||||||||||||||
Top 10 underlying holdings (as at 31 January 2017) |
||||||||||||||||||||||||||||||||||||||||||||||||||||||||||||||||||||||||||||||||||||||||||
|
||||||||||||||||||||||||||||||||||||||||||||||||||||||||||||||||||||||||||||||||||||||||||
Source: HarbourVest Global Private Equity, Morningstar, Edison Investment Research. Note: *Held at least in part via a HarbourVest direct co-investment fund.
Fund profile: Broad selected private equity exposure
HarbourVest Global Private Equity (HVPE) is a closed-ended investment company, incorporated in Guernsey and listed (since September 2015) on the Main Market of the London Stock Exchange. HVPE was listed on Euronext Amsterdam from its inception in December 2007 until October 2016, and its shares were admitted to trading on the Specialist Funds Market of the London Stock Exchange in May 2010. HVPE’s share price is quoted in sterling, but its functional reporting currency is the US dollar and it publishes its NAV monthly in both sterling and dollar terms.
HVPE is a private equity fund of funds, which invests in a diversified portfolio of primary, secondary and co-investment funds (as well as selected direct investments) that are managed by HVPE’s investment manager HarbourVest, an independent, global private markets investment specialist, with a 35-year track record and over US$40bn of assets under management. Headquartered in Boston, US, HarbourVest also has offices in London, Hong Kong, Tokyo, Bogotá, Beijing, Toronto, Seoul and Tel Aviv, giving it broad geographical coverage. HarbourVest’s team of more than 100 investment professionals manages a range of primary, secondary and co-investment funds.
|
Exhibit 2: HVPE outline of fund and investment structure at 31 January 2017 |
|
|
Source: HarbourVest Global Private Equity |
The HarbourVest funds make commitments to leading third-party fund managers across the spectrum of global private equity investment, in venture capital, growth equity and buyout strategies. HVPE’s approach gives investors access to a very broad selection of underlying companies, as outlined in Exhibit 2, which means that the potential effect of adverse events in any one company, industry or market should be minimised.
Despite its portfolio’s wide diversification, individual underlying investments can make a material contribution to HVPE’s overall performance. HVPE’s portfolio has included a number of high profile private equity backed technology companies such as Uber Technologies, Skype, Facebook and Twitter, as well as more traditional household names such as Hilton hotels and Odeon cinemas.
The manager: HarbourVest
The manager’s summary of global market developments in 2016
Fund-raising
■
US buyout – Total fund-raising for 2016 was US$129bn, surpassing the US$104bn raised in 2015. Capital was concentrated in funds over US$1bn. 89% of closings hit their targets for 2016 – greater than in any other year within the past decade.
■
US venture – Fund-raising reached the highest levels since 2000 at over US$40bn, compared to US$28bn for the prior year. Going forward, liquidity is expected to continue to drive future commitments.
■
Europe – Strong fund-raising environment (€50bn) up 4% over 2015, with much of the gain driven by large-cap funds. At year-end 2016, average fund size exceeded €980m.
■
Asia – Compared to US$37bn in 2015, fund-raising reached US$41bn for 2016. China-focused funds attracted close to 50% of capital raised in the region.
■
Other emerging markets – Fund-raising totalled US$8bn in 2016, down from the prior year total of US$9bn as limited partners faced forex risk and macro volatility.
Investments
■
US buyout – Total investment activity in 2016 was over US$200bn, up from US$134bn in 2015. Sponsor-to-sponsor transactions remained consistent with prior year levels (50%), and managers continued to search through market volatility for buying opportunities.
■
US venture – Investment activity of US$49bn in 2016 was less than the US$60bn invested in venture in 2015. Information technology accounted for the vast majority of activity, with expansion and later-stage investments attracting the majority of the capital in both years.
■
Europe – Overall deal activity of €112bn was down 16% from 2015, reflecting a slowdown in overall M&A activity. General partners are expected to proceed with caution in the face of macro uncertainty.
■
Asia – After reaching an all-time high of US$60bn in 2015, the investment pace in 2016 normalised to be more in line with 2014 levels at US$43bn. Consistent with 2015, China was the main focus of approximately half of the investment activity.
■
Other emerging markets – Investment activity in 2016 amounted to US$4bn, down 17% from US$5bn in 2015.
Liquidity
■
US buyout – At US$86bn, 2016 M&A activity trailed 2015 levels. Share sales slightly exceeded 2015 at US$45bn. The slow IPO market is expected to accelerate.
■
US venture – Decreased demand for later-stage deals contributed to valuation declines. Volatility in public markets cut IPO activity in half compared to 2015. Similarly, M&A activity was 19% lower. High-profile IPOs could energise liquidity activity going forward.
■
Europe – Continued strong exit levels are starting to come off the 2014/15 peak; IPO exits by value were down over 40% compared to 2015 and M&A exits were down 19%. Macro uncertainty going forward may be balanced by currency weakness and growing corporate cash.
■
Asia – Totalling just over US$36bn in 2016, exit value lagged 2015 slightly, with public exit activity slower and M&A remaining resilient. By value, leading markets remain consistent year-on-year (South Korea, India, and Australia/New Zealand).
■
Other emerging markets – Exit levels in the emerging markets were US$4.3bn in 2016, down 14% from 2015. Premium assets continued to generate liquidity, and improving macro conditions are expected to support increased liquidity.
Asset allocation
Investment process: Consistent, selective, broad allocation
In November each year, HVPE’s board approves a plan for new commitments to HarbourVest funds over the subsequent 12-month period. This plan is prepared by the investment manager, with a view to optimising long-term returns for HVPE shareholders. The total commitment for the year is based on forecast cash flows and investment returns, while the allocation by fund is set with reference to strategic asset allocation targets. The commitment plan is executed so as to maximise the benefit of any early-closing fee discounts available on the selected HarbourVest funds, while also metering the pace of commitments in line with a set of agreed balance sheet ratios.
The strategic asset allocation is defined as a set of rolling five-year portfolio construction targets by investment stage, geography, and strategy, as a proportion of NAV. The strategic allocation takes into account macroeconomic and geopolitical factors, the available opportunity set, historical performance and HarbourVest’s specific areas of expertise. The targets are reviewed annually by the board and the following revisions were made in November 2016:
■
Introduction of a 5% specific allocation for real assets and mezzanine investments.
■
Increased allocation to US from 60% to 65%.
■
Increased allocation to Asia and Rest of world from 15% to 17%.
■
Reduced allocation to Europe from 25% to 18%.
Exhibit 3: HVPE strategic asset allocation
Stage |
% |
Geography |
% |
Strategy |
% |
||
Buyout |
65 |
US |
65 |
Primary |
60 |
||
Venture and growth equity |
30 |
Europe |
18 |
Secondary |
25 |
||
Mezzanine and real assets |
5 |
Asia Pacific |
12 |
Direct |
15 |
||
|
Rest of world |
5 |
|
||||
|
100 |
|
100 |
|
100 |
Source: HarbourVest Global Private Equity, Edison Investment Research
HVPE maintains a consistent rate of investment, which ensures a broad spread of vintages. The fund-of-funds structure enhances this averaging effect, with commitments made by HVPE to HarbourVest funds, which are allocated over a period of three to four years to third-party managers, who invest in operating companies over the following three to five years.
HarbourVest undertakes considerable due diligence before investing in underlying managers, backed up by the long experience and extensive networks of its investment professionals. In the primary segment (where investments are into a ‘blind pool’), commitments are made to underlying funds at formation, and the HarbourVest team will focus on assessing such factors as the investment skills, leadership and performance record of the fund manager, the attractiveness of the fund’s investment focus and strategy, and contractual terms and features such as fund size, expected duration, exposure limits and fees.
Where investments are made in secondary assets (whole or part portfolios of maturing private equity investments), the managers value the operating companies in the portfolio on a bottom-up basis, projecting future performance and assessing the capabilities of the underlying fund manager. HarbourVest has experience in complex secondary market transactions, as illustrated by the Absolute and Conversus acquisitions in 2011 and 2012, where HarbourVest was able to offer liquidity to existing investors who sought an exit. The transactions were particularly complex because they involved taking private two listed private equity funds.
Direct investments in private companies – usually co-investments alongside the general partners who run the underlying funds – typically arise as a result of HarbourVest’s strong and deep relationships with leading private equity investors. The team reviews about 100 such opportunities each year, assisted by a proprietary database covering 20 years of transactions.
Current portfolio positioning
HVPE’s broadly diversified portfolio comprised 38 HarbourVest funds and two direct co-investments at end-January 2017, giving exposure to over 800 underlying funds and partnerships, which are invested in over 7,000 operating companies (see Exhibit 2). There were seven companies representing 1.0% or more of the portfolio (see Exhibit 1), with the top 10 underlying investments accounting for 11.8% of the portfolio and 10.4% of NAV (11.9% of NAV was held in cash). Exhibit 4 highlights that, while the top 10 HarbourVest funds account for over 60% of HVPE’s portfolio, there is a clear diversification by phase, vintage, stage, region and strategy.
Exhibit 4: Top 10 HarbourVest funds by investment value at end-January 2017
Fund |
Phase |
Vintage |
Stage |
Region |
Strategy |
Unfunded commitment (US$m) |
Amount invested (US$m) |
Distributions received (US$m) |
Fair value (US$m) |
% of portfolio |
% of NAV |
HarbourVest VIII Buyout |
Mature |
2006 |
Buyout |
US |
Primary/ secondary/ direct |
15.0 |
237.8 |
232.1 |
137.2 |
10.6 |
9.3 |
Dover Street VIII |
Growth |
2012 |
Buyout/ venture |
Global |
Secondary |
29.7 |
150.4 |
78.1 |
130.2 |
10.0 |
8.8 |
HarbourVest 2013 Direct Fund |
Investment |
2013 |
Buyout/ venture |
Global |
Direct |
5.5 |
94.9 |
9.8 |
125.9 |
9.7 |
8.5 |
HIPEP VI Partnership Fund |
Growth |
2008 |
Buyout/ venture |
Europe/ AsiaPac/ RoW |
Primary |
15.7 |
106.9 |
36.6 |
103.9 |
8.0 |
7.0 |
HarbourVest Partners IX Venture |
Growth |
2011 |
Venture |
US |
Primary/ secondary/ direct |
12.3 |
58.1 |
14.3 |
64.7 |
5.0 |
4.4 |
HarbourVest Global Annual Private Equity Fund |
Investment |
2014 |
Buyout/ venture/ other |
Global |
Primary/ secondary/ direct |
43.3 |
56.7 |
5.6 |
62.7 |
4.8 |
4.3 |
HarbourVest VII Venture Fund |
Mature |
2003 |
Venture |
US |
Primary/ secondary |
2.3 |
135.3 |
147.2 |
56.3 |
4.3 |
3.8 |
HarbourVest Partners 2007 Direct Fund |
Mature |
2007 |
Buyout |
Global |
Direct |
2.3 |
97.9 |
106.7 |
53.6 |
4.1 |
3.6 |
HarbourVest Partners IX Buyout Fund |
Growth |
2011 |
Buyout |
US |
Primary/ secondary/ direct |
28.2 |
43.1 |
11.9 |
46.4 |
3.6 |
3.1 |
HIPEP VI Asia Pacific Fund |
Growth |
2008 |
Buyout/ venture |
Asia Pacific |
Primary |
6.5 |
43.7 |
13.9 |
45.8 |
3.5 |
3.1 |
Top 10 |
160.7 |
1,024.7 |
656.2 |
826.6 |
63.8 |
56.0 |
Source: HarbourVest Global Private Equity, Edison Investment Research
HVPE aims to balance the investment phases to help smooth out the often uneven nature of private equity returns. The investment phase is when capital is drawn down by underlying managers to build their portfolios; the growth phase is the bulk of the life of the underlying investment; and the mature phase is when portfolio companies are prepared for sale and realisations are achieved through trade sales, sales to other financial investors, or companies becoming publicly listed. Mature funds include vintage years pre-2007, growth 2008 to 2012, and investment 2013 to 2017.
Exhibit 5 shows the split of the portfolio by stage, phase, geography, strategy and industry. Compared with a year earlier, the most significant change is a 15pp decline in growth phase exposure, offset by 11pp and 4pp increases in investment and mature phase exposures. This reflects the natural maturing of the portfolio, with investments moving from the growth to mature phase and mature investments being realised, leading to an increase in new investments as realisation proceeds are reinvested.
Exhibit 5: HVPE portfolio profile at end-June 2017
Stage |
% |
Phase |
% |
Geography |
% |
Strategy |
% |
Industry |
% |
Buyout |
62 |
Investment |
44 |
US |
62 |
Primary |
45 |
Consumer/financial |
33 |
Venture and growth equity |
30 |
Mature |
29 |
Europe |
20 |
Secondary |
30 |
Technology/telecom |
30 |
Mezzanine and real assets |
8 |
Growth |
27 |
Asia Pacific |
12 |
Direct |
25 |
Industrial/other |
20 |
Rest of world |
6 |
Medical/biotech |
17 |
||||||
|
100 |
|
100 |
|
100 |
|
100 |
|
100 |
Source: HarbourVest Global Private Equity, Edison Investment Research
The next largest shift in exposure is a 6pp increase in the direct strategy, with 3pp corresponding declines in primary and secondary strategies. This shift largely reflects the outperformance of direct co-investments over the last 12 months, which was helped by strong gains from Lightower Fiber Networks, Capsugel (sale announced to Lonza), Leaseplan, and H-Line Shipping, and from accretive exits from The Sun Products and Planview. Direct and secondary investments are 10pp and 5pp above their strategic allocations and the exposures are expected to reduce gradually towards their target levels over the medium term, as investments are realised and HVPE’s new investments are geared towards the primary strategy.
Exhibit 6: Top five managers by strategy as a percentage of HVPE’s portfolio value at end-January 2017
Buyout |
% |
Venture |
% |
Mezzanine and real asset |
% |
||
Thoma Bravo |
1.8 |
Index Ventures |
1.2 |
Lone Star Funds |
0.5 |
||
Welsh, Carson, Anderson & Stowe |
1.5 |
Health Evolution Investments |
1.2 |
1901 Partners Management |
0.4 |
||
Compass Partners International |
1.4 |
Lightspeed Venture Partners |
1.2 |
Crestline Management |
0.4 |
||
TPG Capital |
1.4 |
Insight Venture Management |
1.1 |
Oaktree Capital Management |
0.4 |
||
The Blackstone Group |
1.3 |
DCM |
1.0 |
MatlinPatterson Global Partners |
0.3 |
||
Top 5 |
7.3 |
Top 5 |
5.8 |
Top 5 |
2.1 |
Source: HarbourVest Global Private Equity
Geographic exposure is unchanged compared with a year earlier. While the portfolio is global, it retains a US bias and exposure to the US is likely to move up from the current 62% towards the recently increased 65% strategic asset allocation level over the next couple of years. Exposures to other regions are nearer to their strategic allocations, with Europe already close to its recently reduced 18% target level.
Exhibit 7: Top five managers by geography as a percentage of HVPE’s portfolio value at end-January 2017
US |
% |
Europe |
% |
Asia and rest of world |
% |
||
Thoma Bravo |
1.8 |
Compass Partners International |
1.4 |
Mid Europa Partners |
1.0 |
||
Welsh, Carson, Anderson & Stowe |
1.5 |
Index Ventures |
1.2 |
RMB Capital Partners |
0.8 |
||
TPG Capital |
1.4 |
CVC Capital Partners |
1.0 |
TPG Asia |
0.8 |
||
The Blackstone Group |
1.3 |
Doughty Hanson & Co |
0.9 |
DCM |
0.7 |
||
Health Evolution Investments |
1.2 |
PAI Partners |
0.8 |
Trustbridge Partners |
0.7 |
||
Top 5 |
7.1 |
Top 5 |
5.4 |
Top 5 |
4.0 |
Source: HarbourVest Global Private Equity
With regards to stage, there has been a 4pp increase in mezzanine and real assets, although this remains the smallest exposure at 8%. This increase is offset by small declines in both buyout and venture and growth equity, with buyout investments still representing over 60% of the portfolio. Venture capital is a highly competitive area where HarbourVest’s longstanding relationships with the top managers are key to securing allocations in new funds. Venture capital is skewed towards technology/telecoms, which was the second-largest industry weighting at end-June 2017, as well as to medical/biotech, which is the smallest of the four industry weightings in HVPE’s portfolio.
Commitments and financial resources
During FY17, HVPE committed a total of US$425m to six newly formed HarbourVest funds:
■
US$100m to Dover Street IX – a global secondary fund
■
US$100m to HarbourVest 2016 Global Fund – a global multi-strategy fund of funds
■
US$100m to HarbourVest Co-Investment Fund – a global co-investment fund
■
US$50m to HarbourVest Real Assets III – a global secondary fund
■
US$50m to HarbourVest X – a US fund of funds
•
US$30m to HarbourVest X Venture
•
US$20m to HarbourVest X Buyout
■
US$25m to HarbourVest Mezzanine Income Fund – a US co-investment fund
During FY17, HVPE invested US$270m through capital calls to fund underlying investments (US$176m to primary funds, US$32m to secondary funds and US$62m to co-investment funds), and received US$251m from realisations (US$149m from primary funds, US$36m from secondary funds, US$23m from co-investment funds and US$43m from secondary co-investments).
Since the FY17 year-end, HVPE has committed US$137m to two new HarbourVest funds and the acquisition of a portfolio of seven venture capital funds, alongside other HarbourVest funds:
■
In March and April 2017, US$97m was committed:
•
US$40m to HarbourVest 2017 Global Fund – a global multi-strategy fund of funds
•
US$57m to HIPEP VIII Partnership Fund – an international fund-of-funds programme
■
In June 2017, US$40m was committed:
•
US$30m to HarbourVest 2017 Global Fund
•
US$10m to a secondary portfolio of funds managed by Asia-based venture managers
Cash drawn down by HarbourVest funds during the first five months of FY18 totalled US$107m, and HVPE received realisations of US$120m. The run-rate of new capital commitments so far in FY18 is appreciably lower than that of FY17, but the pace of investments and realisations is broadly similar to FY17. While the lower rate of commitments may represent a short-term variation in the timing of new HarbourVest fund launches, if sustained it would feed through to a lower level of cash investments in the future as the funds are drawn down by underlying managers.
HVPE principally invests through funds of funds, making its cash drawdown profile relatively predictable, with primary fund drawdowns typically spread over five to seven years. The investment manager has prepared cash flow models covering several different macroeconomic scenarios, all of which predict that HVPE’s balance sheet remains sound even in the event of a downturn worse than the 2008 global financial crisis. Although in most foreseeable circumstances the forecast level of borrowing remains very modest, the board has chosen to maintain US$500m of secured and committed bank facilities, believing that they provide an essential foundation for future investment performance by allowing HVPE to run a commitment ratio materially higher than many of its peers.
HVPE has a large asset portfolio that has historically delivered a steady flow of realisations. Since its inception, HVPE’s investments in HarbourVest funds have been funded almost entirely from current-year realisations, and its total debt remained low even during the 2008 financial crisis.
The level of HVPE’s investments (when underlying funds draw down cash to invest in operating companies) and realisations (when assets are divested) broadly correspond to the proportion of funds in investment and mature phases. Capital allocation, through making commitments to new HarbourVest funds at launch, aims to match realisation proceeds with capital calls for investments, to ensure efficient deployment of capital. Exhibit 8 (left-hand chart) shows the evolution of these three areas over HVPE’s last seven financial years. In line with the fund’s aim of achieving balance, on average the level of commitments, investments and realisations has been broadly equal.
Three key ratios are used to assess HVPE’s commitment levels:
■
Total commitment ratio (TCR) – the sum of the current investment portfolio and investment commitments as a percentage of NAV. This ratio provides a measure of total market exposure and is a key determinant of HVPE’s total commitment capacity for new investments. At end-June 2017, HVPE’s TCR was 168%, similar to its end-FY17 level of 169%.
■
Commitment coverage ratio (CCR) – the sum of cash and available credit divided by total investment commitments. This ratio provides a measure of balance sheet risk. HVPE’s peers typically have shorter-term investment pipelines, making CCR comparison less relevant. At end-June 2017, HVPE’s CCR was 56%, the same level as at end-FY17.
■
Rolling coverage ratio (RCR) – the sum of cash, available credit and realisation proceeds expected in the current year as a percentage of expected cash investment in the current year and the following two years. Considering investments over a fixed three-year period makes the RCR a more equivalent ratio for comparison of HVPE’s commitment coverage to its peers. At end-June 2017, HVPE’s RCR was 109%, slightly higher than its end-FY17 level of 105%.
HVPE also considers alternative measures of commitment coverage based on its capital commitments that have been allocated to third-party funds as well as HarbourVest secondary and direct funds. The commitment level shown in Exhibit 8 (right-hand chart) is calculated by taking the value of HVPE’s investment portfolio and allocated commitments, and dividing this by NAV. The coverage ratio shown reflects the sum of cash and available credit, divided by allocated investment commitments. The allocated commitment level and coverage ratio have both been stable, at c 150% and c 75%, respectively, since August 2016. Both measures stood at 126% at end-2015 and the subsequent relatively sharp move reflected an increase in HVPE’s allocated commitments. This followed a rise in the overall level of HVPE’s commitments during 2015, driven by the medium-term aim to increase to c 50% the proportion of its assets in the growth phase, which typically runs from five to nine years after initial commitment.
|
Exhibit 8: Commitments/investments/realisations and coverage ratios |
|
Financial year commitments, investments, realisations |
Monthly commitment and coverage ratios to June 2017 |
|
|
|
Source: Thomson Datastream, Edison Investment Research |
|
Performance: Long-term outperformance
HVPE’s investments are principally denominated in US dollars and this remains the company’s functional currency, although the shares are LSE-listed, with the share price quoted in sterling, and NAV is reported in US dollars and sterling. In US dollar terms, HVPE’s NAV total return was 10.3% in its financial year to end-January 2017, which is higher than the 8.1% return recorded in both of the prior two financial years and in line with the 10.2% pa five-year NAV total return. Exhibit 9 shows HVPE’s NAV per share progression in US dollar terms in FY17, highlighting that underlying investment performance was the key driver of returns.
|
Exhibit 9: NAV per share progression in US dollar terms in the year to 31 January 2017 |
|
|
Source: HarbourVest Global Private Equity, Edison Investment Research |
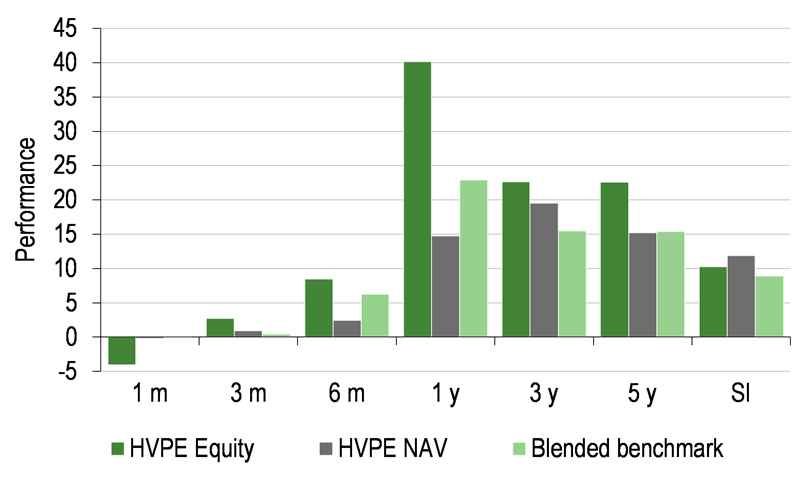
As illustrated in Exhibit 10, HVPE’s share price total return has outperformed its global listed equity benchmark over one year to end-June 2017, while its NAV total return has lagged the benchmark. This weak relative NAV performance largely reflects the lower volatility of HVPE’s returns and the sustained recovery of global equity markets after the market weakness that persisted through the second half of 2015 and early 2016. As shown in Exhibit 11, in sterling terms HVPE’s NAV total return to end-June 2017 is ahead of its benchmark over three years and the 9.6 years since its inception in December 2007, but lower than the benchmark over one and five years. The contrasting relative performance over different time periods largely reflects the volatility of global equity markets against the relatively steady progression of HVPE’s NAV. HVPE’s share price discount to NAV has narrowed by c 15 percentage points over the year to end-June 2017, and the share price strength over one year has helped to bring HVPE’s share price total return ahead of its benchmark over all periods shown.
HVPE uses a global listed equity market index (MSCI AC World Index up to 30 November 2016 and FTSE All-World Index thereafter) as an official performance benchmark, but we also compare its returns to global private equity peers, as represented by the LPX 50 Index of the largest, most liquid listed private equity funds globally. HVPE’s NAV total return has outperformed the LPX 50 Index over three and five years and since its inception, while underperforming over one year, largely reflecting a weaker relative performance over three months. HVPE’s share price total return is ahead of the LPX 50 Index over one, three and five years and since its inception.
|
Exhibit 10: Investment company performance to 30 June 2017 (in sterling terms) |
|
Price, NAV and benchmark total return performance, one-year rebased |
Price, NAV and benchmark total return performance (%) |
|
|
|
Source: Thomson Datastream, Edison Investment Research. Note: Three, five and 10-year performance figures annualised. Blended benchmark is MSCI AC World up to 30 November 2016 and FTSE All-World thereafter. SI = since HVPE inception, 6 December 2007. |
|
Exhibit 11: Share price and NAV total return performance in sterling terms, relative to indices (%)
|
One month |
Three months |
Six months |
One year |
Three years |
Five years |
Since inception |
Price relative to Blended benchmark |
(3.9) |
2.2 |
2.1 |
14.0 |
19.7 |
35.1 |
11.8 |
NAV relative to Blended benchmark |
(0.0) |
0.5 |
(3.6) |
(6.6) |
10.9 |
(0.7) |
28.6 |
Price relative to FTSE All-World |
(3.9) |
2.2 |
2.1 |
14.0 |
19.4 |
34.6 |
11.1 |
NAV relative to FTSE All-World |
(0.0) |
0.5 |
(3.6) |
(6.7) |
10.6 |
(1.1) |
27.7 |
Price relative to LPX 50 |
(3.8) |
(2.7) |
(2.6) |
4.4 |
17.4 |
9.5 |
35.5 |
NAV relative to LPX 50 NAV |
(0.9) |
(3.4) |
(3.8) |
(3.0) |
12.1 |
8.8 |
61.5 |
Source: Thomson Datastream, Edison Investment Research. Note: Data to end-June 2017. SI = since HVPE inception, 6 December 2007. Geometric calculation.
Exhibit 12 compares HVPE’s share price and NAV performance in sterling and US dollars. Although sterling weakness was in focus during 2016 due to the sharp decline triggered by the UK’s EU referendum vote, HVPE’s managers note that sterling has been on a long-term weakening trend versus the dollar since the fund’s inception, when the exchange rate was US$2.0/£ in comparison to the current rate of US$1.3/£. This has significantly enhanced returns for sterling investors over periods of more than one year, although the short-term picture has been more mixed.
Exhibit 12: Comparing HVPE NAV and share price total return performance in US dollar and sterling terms (%)
One month |
Three months |
Six months |
One year |
Three years |
Five years |
Since inception |
|
HVPE NAV US$ |
0.4 |
4.9 |
7.7 |
11.9 |
29.9 |
68.4 |
87.9 |
HVPE NAV £ |
(0.2) |
1.0 |
2.5 |
14.7 |
70.9 |
103.3 |
192.8 |
HVPE share price US$ |
(3.5) |
6.7 |
14.0 |
36.2 |
40.2 |
129.2 |
63.3 |
HVPE share price £ |
(4.1) |
2.7 |
8.5 |
40.2 |
84.5 |
176.7 |
154.6 |
Source: Thomson Datastream, Edison Investment Research. Note: Data to end-June 2017. Inception date is 6 December 2007.
Exhibit 13 shows HVPE’s NAV performance relative to its benchmark (the MSCI AC World Index up to 30 November 2016 and FTSE All-World Index thereafter) over the past five years. Performance is compared on an equivalent currency basis and relative performance is the same in US dollar and sterling terms. For reference, we note that the MSCI AC World and FTSE All-World indices have delivered very similar performances over one, three, five and 10 years, with annualised returns differing by up to 0.1pp across these time periods. After performing broadly in line with its benchmark from mid-2012 to mid-2015, the second half of 2015 and early 2016 saw HVPE achieve notable outperformance, largely reflecting the weakness of global equity markets during this period, while HVPE’s NAV held fairly steady. Subsequent underperformance reflects the sustained recovery of global equity markets, while HVPE has delivered a comparatively strong performance in absolute terms over this period.
|
Exhibit 13: NAV performance relative to blended benchmark over five years |
|
|
Source: Thomson Datastream, Edison Investment Research. Note: Blended benchmark is MSCI AC World up to 30 November 2016 and FTSE All-World thereafter. |
Discount: Significant narrowing over one year
Similar to most listed private equity funds, HVPE has traded at a discount to NAV since the global financial crisis, although in recent years the sector discount has followed a broadly narrowing trend. As illustrated in Exhibit 14, the global private equity LPX 50 Index discount widened considerably in the second half of 2015, but this was reversed in 2016. HVPE’s discount was affected by sterling declining against the US dollar in 2016 due to its shares being sterling-denominated and its asset base being primarily US dollar-based. The currency translation effect is particularly evident on the chart between 23 and 27 June 2016, when HVPE’s discount widened from 21.7% to 33.7%, while its sterling share price declined by less than 5% and its US dollar NAV was unchanged. Although HVPE’s discount has since narrowed more sharply than the sector, its current 14.7% discount is more than 10 percentage points wider than the LPX 50 Index discount (similar to the period June 2012 to June 2014). While HVPE’s current discount is wider than its 9.6% low in May 2017, it is appreciably below its 18.8%, 19.8% and 22.7% one, three and five-year averages.
The board regularly reviews HVPE’s discount and considers options that might reduce it over the longer term. The board’s view remains that good investment performance, together with increased acceptance by the market of listed private equity as an asset class, are the key to lower discounts.
|
Exhibit 14: Share price discount to NAV vs LPX 50 discount over five years (%) |
|
|
Source: Thomson Datastream, Edison Investment Research |
Capital structure and fees
HVPE has a single share class, with 79.9m ordinary shares in issue. HVPE’s 101 voting B shares were repurchased and cancelled, and its A shares enfranchised prior to its September 2015 move to the Main Market of the London Stock Exchange. In October 2016, HVPE delisted from Euronext Amsterdam, where it had been listed since launch.
HVPE has a US$500m multi-currency revolving credit facility, which provides short-term flexibility in meeting commitments as well as underpinning its ability to meet fund commitments in the event that investments exceed realisations for a sustained period. The facility is provided by Lloyds Bank (US$300m) and Credit Suisse (US$200m) at a rate of Libor plus 300bp for borrowings up to US$250m, and Libor plus 330bp above US$250m. A commitment fee of 115bp is applied to the undrawn balance. HVPE’s original US$500m facility with Lloyds had been reduced to US$300m in October 2014 but was amended to include Credit Suisse as an additional lender in September 2015. In December 2016, the maturity of the debt facility was extended to December 2020. At 30 June 2017, no debt was drawn and HVPE had cash of US$185.2m (compared with US$175.2m at end-FY17), held in AAA-rated money market funds and equating to 12.1% of net assets.
As one of the largest investors into the HarbourVest platform, HVPE typically benefits from the lowest available fee rates on its new fund commitments to the HarbourVest funds. For FY17, total management fees represented 1.08% of net assets. HarbourVest funds pay fees to the underlying third-party managers, but these are deducted from returns at the underlying fund level rather than being separately reported. HVPE’s recurring operating expenses totalled 0.65% of net assets for FY17, while carried interest payments (performance fees) on the HarbourVest secondary and direct co-investment funds, as well as its two direct co-investments, amounted to 0.51% of net assets. No performance fee is charged by HVPE itself. Net of interest income (0.07% of net assets), HVPE’s total expense ratio was 2.17% for FY17, marginally lower than the 2.19% reported for FY16.
Dividend policy and record
HVPE has not paid a dividend since its launch, reflecting the capital nature of private equity returns. Two US$20m special distributions were made following the realisation of direct co-investments in Absolute and Conversus, representing 50% of the profits on these transactions. These were implemented via the redemption of a proportion of HVPE’s A shares in October 2013 and 2014.
Peer group comparison
Exhibit 15 shows a comparison of HVPE with seven other private equity investment companies that have a fund-of-funds structure, selected from the AIC Private Equity sector (a diverse group of 23 investment companies). 2016 was another good year for the private equity industry, with a supportive economic backdrop and expanding multiples supporting NAV growth and strong exit uplifts, although total realisations were down on record 2014/15 levels. This has resulted in positive total returns for every member of the peer group over all periods shown, including from HVPE’s inception date in December 2007, shortly before the global financial crisis.
In sterling terms, HVPE’s NAV total returns are marginally below the peer group average over one year and ahead of the average over three and five years and since its inception, ranking first over five years and since inception. Although HVPE’s discount has narrowed by c 15 percentage points over the last year, a similar trend has occurred across the listed PE sector and HVPE’s discount remains wider than the peer group average. HVPE does not pay a dividend, preferring to reinvest realisation proceeds in line with its capital growth mandate, and it holds net cash commensurate with its substantial pipeline of investment commitments. HVPE’s ongoing charges are among the highest in the peer group, which may be a reflection of its ‘fund of fund of funds’ structure, although not all the figures may be comparable as fee disclosure varies across underlying third-party managed funds. Excluding performance fees on the HarbourVest secondary and co-investment funds and on its two direct co-investments, HVPE’s ongoing charges were 1.66% in FY17.
Exhibit 15: Private equity funds of funds (all returns in sterling) as at 10 August 2017*
% unless stated |
Market cap £m |
NAV TR |
NAV TR |
NAV TR |
NAV TR |
Discount to NAV |
Ongoing charge |
Perf. fee |
Net gearing |
Dividend yield (%) |
HarbourVest Global Private Equity |
1,007.9 |
14.7 |
70.9 |
103.3 |
192.8 |
(14.6) |
2.17 |
No |
100 |
0.0 |
Aberdeen Private Equity |
139.6 |
9.9 |
50.9 |
60.7 |
69.4 |
(14.9) |
1.87 |
Yes |
100 |
3.1 |
F&C Private Equity Trust |
250.4 |
14.2 |
47.6 |
65.6 |
95.3 |
(3.5) |
1.27 |
Yes |
88 |
3.7 |
ICG Enterprise Trust |
515.2 |
21.8 |
35.9 |
66.4 |
98.8 |
(14.3) |
1.28 |
No |
100 |
2.7 |
JPEL Private Equity |
348.0 |
13.4 |
75.5 |
61.0 |
42.8 |
(13.2) |
1.94 |
Yes |
110 |
0.0 |
NB Private Equity Partners |
498.5 |
18.2 |
70.5 |
100.7 |
|
(17.3) |
2.27 |
Yes |
100 |
3.5 |
Pantheon International |
1,140.5 |
16.4 |
59.9 |
82.8 |
121.2 |
(17.5) |
1.39 |
Yes |
100 |
0.0 |
Standard Life Private Equity |
518.1 |
18.3 |
55.5 |
78.6 |
80.9 |
(9.9) |
0.99 |
Yes |
100 |
3.6 |
Peer group average |
552.2 |
15.9 |
58.3 |
77.4 |
100.2 |
(13.1) |
1.65 |
100 |
2.1 |
|
Rank |
2 |
5 |
2 |
1 |
1 |
5 |
2 |
2 |
6 |
Source: Morningstar, Edison Investment Research. Note: *Performance data to 30 June 2017. **SI=since HVPE inception, 6 December 2007. TR=total return. Net gearing is total assets less cash and equivalents as a percentage of net assets (100=ungeared).
The board
Following the appointment to the board of Francesca Barnes in April 2017, HVPE has eight directors, six of whom are independent. Chairman Sir Michael Bunbury has served on the board since October 2007, shortly before HVPE’s launch in December 2007, as have Andrew Moore, Jean-Bernard Schmidt, Keith Corbin and Brooks Zug. Alan Hodson and Peter Wilson were appointed in April and May 2013, respectively. Brooks Zug, a founder and senior managing director of HarbourVest, and Peter Wilson, a member of HarbourVest’s executive management committee who co-leads secondary investment activity in Europe, are deemed non-independent. Francesca Barnes has extensive private equity experience, most recently as a director of Electra Private Equity, and spent 16 years at UBS, serving as global head of private equity for the last seven years. The other directors have backgrounds in financial services, investment management and private equity. While it is unusual for a London-listed closed-end fund to have as many as two non-independent directors, the board is committed to having a majority of independent directors, from whom the chairman is drawn. A number of directors have served for nine years and the chairman has indicated that further new appointments to the board should be expected in due course.
|
|
7digital’s recent trading update confirmed good progress. H117 revenues increased 13%, with a strong performance from high-margin licence and creative sales. Momentum in monthly recurring revenues and new contract wins, as well as the full impact of the 24-7 acquisition put the group on track for an even stronger second half and add to our confidence in the deliverability of targeted EBITDA profitability in 2018. Given the progress being made, the 3.0x FY18 EBITDA rating looks extremely attractive.