Caledonia Mining
Written by
Caledonia Mining |
Production in line, EPS down on macro factors |
Q3 results and site visit |
Metals & mining |
24 November 2016 |
Share price performance
Business description
Next events
Analysts
Caledonia Mining is a research client of Edison Investment Research Limited |
|||||||||||||||||||||||||||||||||||||||||||||||
Caledonia Mining’s (CMCL) third-quarter results indicate the Blanket mine operating in line with expectations, bar a minor slip in the head grade, which is already improving through Q416. As such, revenue and costs remain in line with expectations and the company remains on track to meet its FY16 production target of 50koz Au. The main impacts to the company’s cash flow are non-operational, relating to share-based payments, negative forex movements (with rand strengthening affecting certain costs), as well as a non-recurring cost relating to due diligence on an investment opportunity. As a result, we downgrade our 2016 adj. EPS estimate 25% from 24c to 18c, while noting that this still represents a year-on-year increase of 123% and a low P/E of 6.7x (cf FTSE Mining Index average of 27.1x). Caledonia’s dividend yield is currently 4.5%.
Year end |
Revenue (US$m) |
PBT* |
EPS* |
DPS |
P/E |
Yield |
12/14 |
53.5 |
11.0 |
10.4 |
6.9 |
11.6 |
5.7 |
12/15 |
49.0 |
5.1 |
8.1 |
4.8 |
14.9 |
4.0 |
12/16e |
61.8 |
17.5 |
18.1 |
5.5 |
6.7 |
4.5 |
12/17e |
75.1 |
25.9 |
34.2 |
5.5 |
3.5 |
4.5 |
Note: *PBT and EPS are normalised, excluding amortisation of acquired intangibles, exceptional items and share-based payments.
Record quarterly production
Blanket produced a record 13,428oz Au in Q316, a q-o-q increase of 7.3% (Q216: 12,510oz Au) at cash operating costs of US$618/oz, 2% down q-o-q (Q216: US$629/oz). Q216 gold production in itself was a record. Third quarter all-in sustaining costs were US$969/oz, a slight q-o-q increase of 4% (Q216: US$936/oz). We expect cash costs to improve further as production capabilities improve at Blanket and costs are spread over more ounces produced. In FY17 we expect 60koz Au produced at cash operating costs of c US$615/oz.
New (lower) gold price forecasts
We maintain our production metrics as per our previous notes. The model we use to forecast the gold price implicitly assumes a relationship between the total US monetary base, inflation and the gold price. With a reduction in the monetary base along with an absence of inflation, we have revised our gold price forecasts down.
Valuation: Adjusted for Q3 results & non-mine inputs
We adjust our model for Q316 results, our new gold price forecasts and an exchange rate of US$1.24/£ (cf US$1.28/£ previously). On this basis our central valuation of Caledonia’s shares reduces by 18% from £1.77 to £1.46. This is at a 10% discount rate to reflect general equity risk. Forcing our model’s valuation of Caledonia’s shares to its current share price (114p as of 14 November 2016) requires using a discount rate of 16%.
Record quarterly production
As stated, Caledonia’s year-to-date production is on target to meet its FY16 production guidance of 50koz of gold produced. In fact, Caledonia achieved its highest ever gold production for Q316, producing 13,428oz Au, surpassing by 4% the previous record held in Q313 of 12,918oz Au. Including October’s production of 4,149oz Au, Caledonia looks to be able to achieve its FY16 target by producing 9,091oz Au over November and December (before accounting for WIP).
Earnings revision: Macro factors affect EPS, not operations
Caledonia maintains its production guidance of c 50koz for 2016. However, it has notified the market it expects downward pressure on earnings due to rand strength, one-off charges related to evaluation of a number of investment opportunities and an increase in share-based payments due to Caledonia’s share price increase.
These result in the following additional costs in our model:
■
US$0.7m in share-based payments.
■
Other costs increased from US$1.8m to US$2.0m.
Valuation adjusted for tax, gold prices, moving forward one year
Aside from the non-operational cost increases given above, the following revisions have been made to our model:
■
Gold price forecasts have been revised (see following section).
■
Reduction in opex by 5% on a full-year basis due to improved operational efficiencies resulting from improved underground infrastructure.
■
We record a US$1.8m tax charge in FY16, along with a deferred tax amount of US$4.3m charged to the balance sheet. Our previous tax estimate for FY16 was US$1.4m, with no deferred tax amount estimated. We have moved our base case valuation forward one year and, importantly, it no longer includes previous capital expenditures. For example, capex in FY15 and FY16e was US$16.6m and US$13.8m, respectively. A further US$18.0m is due in FY17, a 24% increase over our previous number of US$14.5m which, according to management, is due to additional onsite electrical infrastructure and additional decline development into the Blanket ore body. FY17 capex ends the main phase of capex, as outlined in the Revised Investment Plan (IP).
Gold price revisions
The model we use to forecast the gold price implicitly assumes a relationship between the total US monetary base, inflation and the gold price. In 2015 there was an (extremely rare) decline in the total US monetary base and (arguably conservative) absence of inflationary pressures. These combined to reduce the base for our longer-term analysis and, therefore, our longer-term numbers.
For further detail on the above method, please refer to page 48 of our October 2016 sector report: Mining overview: Gold and other metals.
Exhibit 1: Edison’s gold price forecasts, new vs old for reference
Year |
2017 |
2018 |
2019 |
2020 |
2021 |
2022 |
2023 |
2024 |
2025 |
2026 |
New US$/oz |
1,275 |
1,220 |
1,284 |
1,362 |
1,344 |
1,281 |
1,274 |
1,257 |
1,245 |
1,264 |
Old US$/oz |
1,347 |
1,408 |
1,483 |
1,467 |
1,409 |
1,404 |
1,389 |
1,379 |
1,398 |
1,423 |
Change (%) |
-5.4% |
-13.4% |
-13.4% |
-7.2% |
-4.6% |
-8.7% |
-8.3% |
-8.9% |
-11.0% |
-11.2% |
Source: Edison Investment Research
Valuation
As a result of the above cost adjustments and gold price revisions, and a new forex rate of US$1.24/£ (vs US$1.28/£ previously), our combined dividend discount flow (of Blanket’s free cash flow of production post-IP implementation) and DCF of vendor facilitation loan repayments reduces by 18% from £1.77 to £1.46. This is at a 10% discount rate to reflect general equity risk. Forcing our model’s valuation of Caledonia’s shares to its current share price (114p as of 14 November 2016) requires using a discount rate of 16.3%. This relatively low hurdle rate represents, in our view, a marked reduction in the country-risk factor applied to Caledonia’s shares, as well as a significantly more positive view on the company’s ability to deliver its IP on time and on budget, which is now two years completed.
IP implementation carries on as planned & budgeted
Caledonia’s staff and management continue to implement the 2014 initiated Investment Plan (IP), with all major components either completed (on time) or remaining on track for completion as envisaged. The elements of the IP completed or being completed are:
■
Completed No. 6 Winze – This is consistently producing ore for the first time below the 750m level.
■
Completed Tramming Loop on 22 Level – This has allowed more flexible and greater haulage of ore and waste to surface, and has also started to highlight the anticipated higher gold grades at the depths Caledonia will mine long-term. As a result of operating the Tramming Loop, the company stated it had achieved record ore haulage to the processing plant in Q316 of 133,375 tonnes, beating the previous record held in Q216, by 10.6%.
■
The Central Shaft is now one-third complete (final depth: 1,080m), and as stated within the Q316 results, is now 348m below surface. This main shaft development will significantly increase haulage to surface and will be located roughly centrally to Blanket’s orebodies adding considerable operational flexibility to the mine. The Central Shaft is expected to enter into operation in mid-2018.
■
A small additional tramming loop is being developed to allow even more flexibility around the current main haulage shaft to surface (the No. 4 shaft).
In addition to these elements of the IP, the company is also developing a decline (internal ramps) to access the AR South and AR Main orebodies ahead of completing the Central Shaft. We consider these additional costs carried in the capex forecasts for implementing the IP.
|
Exhibit 2: Blanket long section showing ore bodies and main IP developments |
|
|
Source: Caledonia Mining and Edison Investment Research |
Gold grade trends – reverting to norm through Q4
The reported head grade for Q316 was 3.36g/t Au, in line with Blanket’s budgeted head grade for the quarter of 3.33g/t Au. Caledonia reported 2.94g/t Au for the month of October, which is below-average for Blanket, however grade control practices have already indicated this grade is starting to revert to normal levels. The following exhibits give historical gold grades, recoveries and tonnages for the Blanket mine, which highlight the increased tonnages being milled and a general improvement in gold head grade since the start of 2015.
|
Exhibit 3: Blanket Mine historical grade, tonnage, recovery data Q114-Q316 |
|
|
|
|
Source: Caledonia Mining and Edison Investment Research |
|
|
Exhibit 3: Blanket Mine historical grade, tonnage, recovery data Q114-Q316 |
|
|
|
|
|
|
Source: Caledonia Mining and Edison Investment Research |
Metallurgical recoveries: Better grinding and oxygen delivery
Blanket’s processing plant recovers roughly half of the gold delivered to it in ore, via very cheap gravity separation methods (a very overlooked though highly desirable attribute of any precious metal orebody); the rest is recovered by conventional cyanidation and electro-winning processes.
Third-quarter recovery was 93.2%, slightly above Q216’s reading of 93.1%. Both are lower than the budgeted 93.5% expected from processing Blanket’s orebodies. The lower than expected recovery factor is due to:
■
a lower head grade, and
■
a non-optimal mix of oxygen in the cyanidation process.
To help rectify the issue surrounding oxygen mixing, an additional, larger, set of cyclones are being installed which is expected to provide a more consistent grind and homogenous sized feed material to the cyanidation plant. Further, a new oxygen plant is to be commissioned mid-2017, which along with the new cyclones should improve recoveries to the planned 93.5%.
Financials
Caledonia had cash at end Q316 of US$12.4m. However, as the company guides to increased costs related to forex, share-based payments and exceptional items (due diligence on an investment opportunity), we expect Caledonia to finish FY16 with cash of US$10.7m. This is post-payment of the company’s total US$2.9m dividend (paid quarterly).
Our FY16 cash balance assumes an average gold price of US$1,253/oz to price production.
As production increases as per the IP, and assuming c 60koz is produced in FY17 and peak capex of US$18.0m is realised, we expect Caledonia to be able to build on its cash balance to the order of US$12.5m by end 2017. This large increase demonstrates the leverage Caledonia has in increasing production and revenues while maintaining a stable fixed cost base.
Site visit
We attended a site visit on 17 to 18 October 2016, visiting the Blanket Mine as well as a satellite exploration project (Mascot/GG). It is clear that the company has moved some considerable way forward implementing its 2014-initiated IP. Underground bottlenecks that restricted haulage to surface via the No. 4 Shaft have been removed, allowing for the record tonnages and gold production that were achieved in both Q216 and Q316. What was clear first-hand is that existing underground infrastructure could not provide the scope for increasing gold production in a material way, and that the Central Shaft development clearly provides the solution to increasing production and reducing costs.
Seeing this development, in person, it is apparent that post-completion, the Blanket Mine will emerge as almost an entirely new, and far larger, mine, retaining the same continuous, highly profitable orebodies and well-managed mining practices that have characterised the company’s ongoing ability to generate cash, even in the worst of gold price environments.
The following are a few photos of our recent visit to the Blanket Mine site.
Current head frames in use
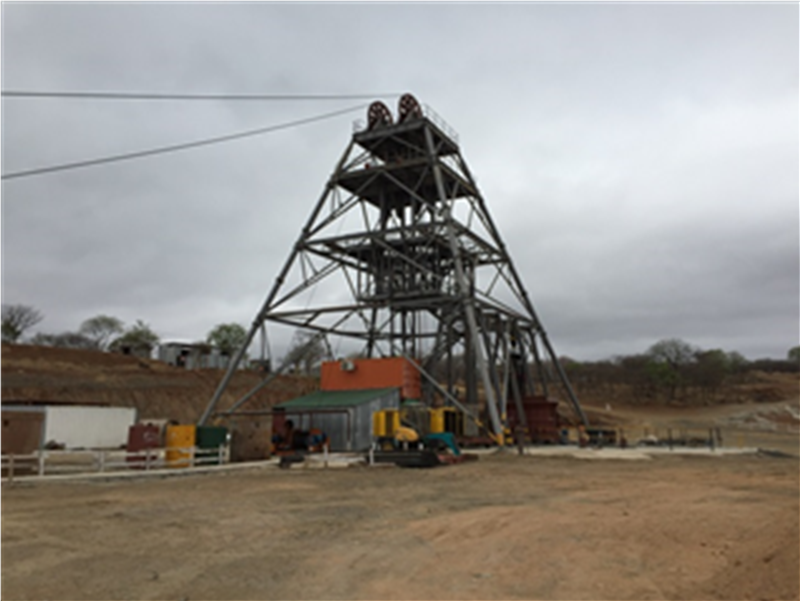
Two of the main headframes in use at Blanket today are shown in Exhibits 4 and 5 below. Note the relatively small size compared to the Central Shaft temporary headframe shown in Exhibit 6. This temporary headframe is only used to sink the shaft, after which it will be removed and a permanent headframe, some 2.5x the height of this one, will be constructed and used for run-of-mine operations.
|
Exhibit 4: Jethro Shaft – used as one access to mine |
Exhibit 5: Current main haulage shaft to surface – No. 4 |
|
|
|
Source: Edison Investment Research |
|
Exhibit 4: Jethro Shaft – used as one access to mine |
|
|
Source: Edison Investment Research |
|
Exhibit 5: Current main haulage shaft to surface – No. 4 |
|
|
Source: Edison Investment Research |
New Central Shaft development
As mentioned previously, Exhibit 6 shows the current temporary headframe in use to sink the Central Shaft to its eventual 1,080m depth.
|
Exhibit 6: Temporary headframe at Central Shaft |
Exhibit 7: New (old) winding gear for Central Shaft |
|
|
|
Source: Edison Investment Research |
|
Exhibit 6: Temporary headframe at Central Shaft |
|
|
Source: Edison Investment Research |
|
Exhibit 7: New (old) winding gear for Central Shaft |
|
|
Source: Edison Investment Research |
This temporary headframe will be replaced by a far larger (c 2.5x the height of the one shown) headframe, which will be used to haul men, equipment and materially more ore to the processing plant than is currently achievable via No. 4 Shaft.
Exhibit 8 below is the view from standing at the bottom of the Central Shaft at a depth of 326m. An important geological characteristic of Blanket’s gold ore, is that roughly half of the gold contained can be processed using the simplest of all techniques – gravity separation. This is a key reason for why the company has low cash operating costs. The Gemini vibrating Table shown in Exhibit 9 is basically like panning for gold, and moves the gold to the centre of the table, from where it can be removed by plant technicians. The rest of the contained gold is removed from its waste rock via more conventional cyanidation techniques (carbon-in-leach is the specific method used).
|
Exhibit 8: Central Shaft view from 326m below surface |
Exhibit 9: Gemini Vibrating Table (gravity processing) |
|
|
|
Source: Edison Investment Research |
|
Exhibit 8: Central Shaft view from 326m below surface |
|
|
Source: Edison Investment Research |
|
Exhibit 9: Gemini Vibrating Table (gravity processing) |
|
|
Source: Edison Investment Research |
Exhibit 10: Financial summary
US$'000s |
2014 |
2015 |
2016e |
2017e |
||
Year end 31 December |
IFRS |
IFRS |
IFRS |
IFRS |
||
PROFIT & LOSS |
||||||
Revenue |
|
|
53,513 |
48,977 |
61,792 |
75,079 |
Cost of Sales |
(34,970) |
(35,796) |
(36,889) |
(43,035) |
||
Gross Profit |
18,543 |
13,181 |
24,903 |
32,044 |
||
EBITDA |
|
|
14,721 |
8,967 |
20,710 |
29,542 |
Operating Profit (before amort. and except.) |
11,181 |
5,645 |
17,240 |
25,730 |
||
Intangible Amortisation |
0 |
0 |
0 |
0 |
||
Exceptionals |
887 |
2,850 |
572 |
0 |
||
Operating Profit |
12,068 |
8,495 |
17,812 |
25,730 |
||
Net Interest |
(140) |
(535) |
251 |
213 |
||
Other financial items |
(1,500) |
|||||
Profit Before Tax (norm) |
|
|
11,041 |
5,110 |
17,492 |
25,944 |
Profit Before Tax (FRS 3) |
|
|
11,928 |
7,960 |
16,564 |
25,944 |
Tax |
(5,982) |
(2,370) |
(6,079) |
(4,569) |
||
Profit After Tax (norm) |
5,059 |
2,740 |
11,413 |
21,375 |
||
Profit After Tax (FRS 3) |
5,946 |
5,590 |
10,485 |
21,375 |
||
Minority interests |
(1,511) |
(811) |
(2,734) |
(3,474) |
||
Net income (norm) |
|
|
5,420 |
4,220 |
9,479 |
17,901 |
Net income (FRS3) |
|
|
4,435 |
4,779 |
7,751 |
17,901 |
Average Number of Shares Outstanding (m) |
52.1 |
52.1 |
52.3 |
52.3 |
||
EPS - normalised (c) |
|
|
10.4 |
8.1 |
18.1 |
34.2 |
EPS - normalised and fully diluted (c) |
|
10.4 |
8.1 |
18.1 |
34.3 |
|
EPS - (IFRS) (c) |
|
|
8.4 |
8.9 |
14.8 |
34.2 |
Dividend per share (c) |
6.9 |
4.8 |
5.5 |
5.5 |
||
Gross Margin (%) |
34.7 |
26.9 |
40.3 |
42.7 |
||
EBITDA Margin (%) |
27.5 |
18.3 |
33.5 |
39.3 |
||
Operating Margin (before GW and except.) (%) |
20.9 |
11.5 |
27.9 |
34.3 |
||
BALANCE SHEET |
||||||
Fixed Assets |
|
|
34,736 |
49,276 |
63,806 |
77,995 |
Intangible Assets |
0 |
0 |
0 |
0 |
||
Tangible Assets |
34,736 |
49,276 |
63,806 |
77,995 |
||
Investments |
0 |
0 |
0 |
0 |
||
Indigenisation receivable |
0 |
0 |
0 |
0 |
||
Current Assets |
|
|
31,743 |
23,562 |
18,860 |
23,539 |
Stocks |
6,512 |
6,091 |
2,456 |
4,247 |
||
Debtors |
1,850 |
4,236 |
5,079 |
6,171 |
||
Cash |
23,082 |
12,568 |
10,658 |
12,454 |
||
Other |
299 |
667 |
667 |
667 |
||
Current Liabilities |
|
|
(4,972) |
(8,397) |
(5,030) |
(7,332) |
Creditors |
(4,972) |
(6,709) |
(5,030) |
(7,332) |
||
Short term borrowings |
` |
0 |
(1,688) |
0 |
0 |
|
Long Term Liabilities |
|
|
(11,164) |
(14,080) |
(16,601) |
(16,601) |
Long term borrowings |
0 |
0 |
0 |
0 |
||
Other long term liabilities |
(11,164) |
(14,080) |
(16,601) |
(16,601) |
||
Net Assets |
|
|
50,343 |
50,361 |
61,035 |
77,601 |
Minority interests |
|
|
(693) |
(1,504) |
(3,771) |
(6,778) |
Shareholder equity |
|
|
49,650 |
48,857 |
57,264 |
70,823 |
CASH FLOW |
||||||
Operating Cash Flow |
|
|
15,477 |
8,331 |
22,189 |
27,034 |
Net Interest |
0 |
0 |
251 |
213 |
||
Tax |
(4,526) |
(1,462) |
(1,779) |
(4,569) |
||
Capex |
(6,150) |
(16,567) |
(18,000) |
(18,000) |
||
Acquisitions/disposals |
0 |
0 |
0 |
0 |
||
Management Fees |
0 |
0 |
0 |
0 |
||
Dividends |
(3,620) |
(2,504) |
(2,883) |
(2,883) |
||
Net Cash Flow |
1,181 |
(12,202) |
(222) |
1,795 |
||
Opening net debt/(cash) |
|
|
(21,892) |
(23,082) |
(10,880) |
(10,658) |
HP finance leases initiated |
0 |
0 |
0 |
0 |
||
Other |
9 |
0 |
(0) |
(0) |
||
Closing net debt/(cash) |
|
|
(23,082) |
(10,880) |
(10,658) |
(12,454) |
Source: Caledonia Mining accounts, Edison Investment Research
|
|