Last close As at 05/08/2026
—
— 0.00 (0.00%)
Market capitalisation
—
Research: Financials
OTC Markets Group (OTCM) continues to gain regulatory recognition for its premium markets, working with state regulators and their national association, while encouraging corporate transparency and facilitating data availability. Management believes that these initiatives will assist it in attracting issuers to its service offerings while enhancing the reputation of the market as a whole. Market Data Licensing is expanding the reach of its diverse range of products, including compliance analytics products. OTC Link ECN continues to add to broker dealer subscribers.
Written by
OTC Markets Group |
Building the base for long-term growth |
Q118 results |
Financial services |
29 May 2018 |
Share price performance
Business description
Next events
Analysts
OTC Markets Group is a research client of Edison Investment Research Limited |
|||||||||||||||||||||||||||||||||||||||||||||||
OTC Markets Group (OTCM) continues to gain regulatory recognition for its premium markets, working with state regulators and their national association, while encouraging corporate transparency and facilitating data availability. Management believes that these initiatives will assist it in attracting issuers to its service offerings while enhancing the reputation of the market as a whole. Market Data Licensing is expanding the reach of its diverse range of products, including compliance analytics products. OTC Link ECN continues to add to broker dealer subscribers.
Year end |
Revenue ($m) |
PBT |
EPS* |
DPS** |
P/E |
Yield |
12/16 |
50.9 |
16.9 |
0.90 |
1.16 |
29.3 |
4.4 |
12/17 |
54.7 |
18.4 |
1.06 |
1.16 |
25.0 |
4.4 |
12/18e |
57.3 |
19.2 |
1.29 |
1.19 |
20.6 |
4.5 |
12/19e |
60.1 |
20.5 |
1.35 |
1.24 |
19.7 |
4.7 |
Note: *Fully diluted and calculated after restricted stock award allocation. **Including special declared dividends of $0.60 for 2016 and 2017, and an estimated $0.63 and $0.68 for 2018 and 2019, respectively.
Q118 results
First quarter gross revenues increased by 7% versus Q117, with the strongest growth (+10%) seen in the Corporate Services segment, with contributors including the higher number of OTCQB clients (+2.5%), pricing and accelerated revenue recognition relating to departing OTCQX clients (21 graduated to a national securities exchange vs 11). Market Data Licensing was 7% up, reflecting price increases and take-up of compliance data products; the number of professional data users was little changed. These two divisions account for more than 80% of revenues. The group operating margin was maintained at 33% and pre-tax profits increased by 7%. After a sharply lower tax charge (of 18% vs 28%), fully diluted EPS were up 19% to $0.31 while a maintained quarterly dividend of $0.14 was announced.
Market background and outlook
Equity market levels have rallied since the spike in volatility early in the year, while GDP expectations remain resilient. The background for corporate activity therefore remains favourable and this should be supportive for potential corporate clients of OTCM. Broker-dealers do still face challenging conditions but at least there has been a stabilisation in the number of participants on OTC Link ATS in the recent quarters, and the launch of OTC Link ECN has put in place an alternative option to address potential competition. On a longer view, the continued increase in the number of states granting Blue Sky recognition to OTCQX and OTCQB (now 30 and 27, respectively) is encouraging, even if it does not have a direct linkage with client signings or revenue.
Valuation: EPS estimates and valuation maintained
Our earnings estimates are effectively unchanged and our valuation, set with reference to a peer valuation comparison and DCF model, is also unchanged at c $29 (page 6).
Q118 results analysis
OTC Markets’ first quarter results showed gross revenues 7% ahead of the same period last year Expenses increased at a similar pace, allowing pre-tax profits to rise in line. Price increases were a factor in the 7% revenue increase for Market Data Licensing, while Corporate Services (+10%) benefited from the increase in corporate clients on OTCQB and the accelerated revenue from departing OTCQX companies referenced earlier. Encouragingly, OTC Link recorded a small increase rather than decrease in revenue, reflecting a pick-up in messaging-related revenue that offset the headwind created by the year-on-year contraction among broker-dealer subscribers. The tax rate was lower than we expected (at 18%) and diluted earnings per share increased by 19%. A quarterly dividend of $0.14 is to be paid, the thirteenth at this level. A P&L summary is shown in Exhibit 1 and more detailed revenue analysis in Exhibit 2. Other highlights from the quarter included:
■
OTCM continues to focus its efforts on gaining regulatory recognition of its markets with measures to increase transparency. In Q118 stock promotion and shell risk flags were introduced to alert investors to risks associated with misleading promotional activities and shell companies.
■
The Transfer Agent Verification programme, which gives current information on share capital, at 1 May had 18 agents participating and covered c 64% of companies on the US OTC market (three agents added since FY17 report).
■
A further state, Connecticut, was added to the list of those granting Blue Sky recognition to OTCQX or OTCQB, taking the total to 30 (see additional comments below).
■
OTC Link ECN, which was launched in December 2017 and offers broker dealers the option of an anonymous order matching and routing system, has signed up 22 existing and six new subscribers. Gross revenue at this very early stage was $28,000. Market share for competitor Global OTC ATS has recently been around 10%, not significantly different from its level over the last two years.
■
OTCM recorded a further quarter of 100% uptime in its core IT systems, extending this record to over three years.
Exhibit 1: Q118 results summary
Q117 |
Q317 |
Q417 |
Q118 |
y-o-y (%) |
q-o-q (%) |
|
OTC Link ATS |
2,618 |
2,413 |
2,546 |
2,651 |
1.3 |
4.1 |
Market Data Licensing |
5,450 |
5,505 |
5,445 |
5,842 |
7.2 |
7.3 |
Corporate Services |
5,308 |
5,704 |
5,898 |
5,849 |
10.2 |
(0.8) |
Gross revenues |
13,376 |
13,622 |
13,889 |
14,342 |
7.2 |
3.3 |
Re-distribution fees and rebates |
(624) |
(584) |
(646) |
(629) |
0.8 |
(2.6) |
Net revenue |
12,752 |
13,038 |
13,243 |
13,713 |
7.5 |
3.5 |
Operating expenses |
(8,514) |
(8,448) |
(8,591) |
(9,163) |
7.6 |
6.7 |
Income from operations |
4,238 |
4,590 |
4,652 |
4,550 |
7.4 |
(2.2) |
Other income / net interest |
14 |
5 |
6 |
17 |
21.4 |
183.3 |
Income before provision for income taxes |
4,252 |
4,595 |
4,658 |
4,567 |
7.4 |
(2.0) |
Taxes |
(1,202) |
(1,107) |
(1,742) |
(820) |
(31.8) |
(52.9) |
Net income |
3,050 |
3,488 |
2,916 |
3,747 |
22.9 |
28.5 |
Diluted EPS $ |
0.26 |
0.29 |
0.24 |
0.31 |
19.2 |
28.6 |
Operating margin |
33% |
35% |
35% |
33% |
||
Tax rate |
28% |
24% |
37% |
18% |
Source: OTCM, Edison Investment Research
Exhibit 2 shows a further revenue analysis based on OTCM’s discussion of percentage changes in some of the subsegmental components in the group. The inferred figures are approximate but give additional indications of trends and relative size. Looking down these figures we can see the benefit of the increase in messaging revenues within OTC Link ATS and the pricing, client count and accelerated revenue recognition effects as mentioned above for OTCQB and OTCQX.
Exhibit 2: Further revenue analysis
$000s |
Q117 |
Q118 |
Change |
% of group |
OTC Link ATS |
||||
Trade messages |
815 |
921 |
13% |
6% |
Other |
1,803 |
1,730 |
-4% |
12% |
Total |
2,618 |
2,651 |
1% |
18% |
Market Data Licensing |
5,450 |
5,842 |
7% |
41% |
Corporate services |
||||
OTCQB |
2,564 |
2,846 |
11% |
20% |
OTCQX |
1,675 |
1,809 |
8% |
13% |
Disclosure and news service |
908 |
1,026 |
13% |
7% |
Other |
162 |
169 |
4% |
1% |
Total |
5,308 |
5,849 |
10% |
41% |
Group gross revenues |
13,376 |
14,342 |
7% |
100% |
Source: OTCM, Edison Investment Research. Note: Subsegment figures are inferred from rounded % changes reported so the figures shown are only approximate.
Our next table collates operating and related revenue data by segment. For OTC Link ATS the number of broker-dealer participants has been unchanged for two quarters, suggesting that the erosion seen previously (reflecting consolidation, competitive conditions, margin pressure and regulatory costs) could be easing. The corporate client count was down modestly for OTCQX with contributing factors being a marked increase in the number of graduates to national securities exchanges, some increase in those downgraded for compliance reasons and a slightly lower retention rate for calendar 2018 (91% versus 93%). For Market Data Licensing both professional and non-professional users were down year-on-year, but sequentially there was a small increase in professional users, which may be a more positive indicator for the future. Non-professional users have increased over the longer term but have shown quarterly fluctuations, as evidenced in the periods shown.
Exhibit 3: Operating and related revenue data
Q117 |
Q317 |
Q417 |
Q118 |
% change |
% change |
|
OTC Link ATS |
||||||
Number of securities quoted |
9,638 |
9,991 |
10,286 |
10,448 |
8.4 |
1.6 |
Number of active participants |
99 |
94 |
94 |
94 |
(5.1) |
0.0 |
Revenue per security quoted ($) |
272 |
242 |
248 |
254 |
(6.6) |
2.5 |
Revenue per average active participant ($) |
25,793 |
25,267 |
27,085 |
28,202 |
9.3 |
4.1 |
Corporate Services |
||||||
Number of corporate clients |
||||||
OTCQX |
363 |
355 |
366 |
358 |
(1.4) |
(2.2) |
OTCQB |
928 |
923 |
938 |
951 |
2.5 |
1.4 |
Pink |
676 |
727 |
755 |
756 |
11.8 |
0.1 |
Total |
1,967 |
2,005 |
2,059 |
2,065 |
5.0 |
0.3 |
Revenue per client ($) |
2,699 |
2,845 |
2,864 |
2,832 |
5.0 |
(1.1) |
Graduates to a national securities exchange |
11 |
12 |
24 |
21 |
90.9 |
(12.5) |
Market Data Licensing |
||||||
Market data professional users |
20,700 |
20,512 |
20,390 |
20,557 |
(0.7) |
0.8 |
Market data non-professional users |
16,022 |
14,012 |
14,801 |
15,726 |
(1.8) |
6.2 |
Revenue per terminal (total) |
148 |
159 |
155 |
161 |
8.5 |
4.1 |
Source: OTCM, Edison Investment Research
The progression in the number of corporate clients for OTCQX and OTCQB since Q216 is shown in Exhibit 4. From the beginning of 2017 the number of OTCQX companies has been broadly stable, while the OTCQB number has shown a modest increase driven by stronger sales and fewer compliance downgrades. Clearly there is some offset between the move to raise the quality of the OTCQX market and the number of corporate clients or potential clients. Prospectively, achieving national Blue Sky recognition could more than compensate for this effect as it would be likely to substantially raise the profile of the market, attracting new US and overseas clients. In the meantime, OTCM has been able to implement price increases that have contributed to increase revenues.
As noted above, Connecticut granted Blue Sky recognition to OTCQX and OTCQB during the first quarter. This takes the total number of states to 30 for OTCQX and 27 for OTCQB. A further three states, Michigan, Oklahoma and Missouri, have rule proposals that could lead to recognition of both markets in due course. The sustained increase in the number of states recognising OTCQX since OTCM began working to this end is shown in Exhibit 5 (over the period between one and three of these states only recognised OTCQX).
|
Exhibit 4: OTCQX & OTCQB corporate client numbers |
Exhibit 5: Blue Sky recognition |
|
|
|
Source: OTCM |
Source: OTCM. Note: Figures for OTCQX. |
|
Exhibit 4: OTCQX & OTCQB corporate client numbers |
|
|
Source: OTCM |
|
Exhibit 5: Blue Sky recognition |
|
|
Source: OTCM. Note: Figures for OTCQX. |

Current trading environment and outlook
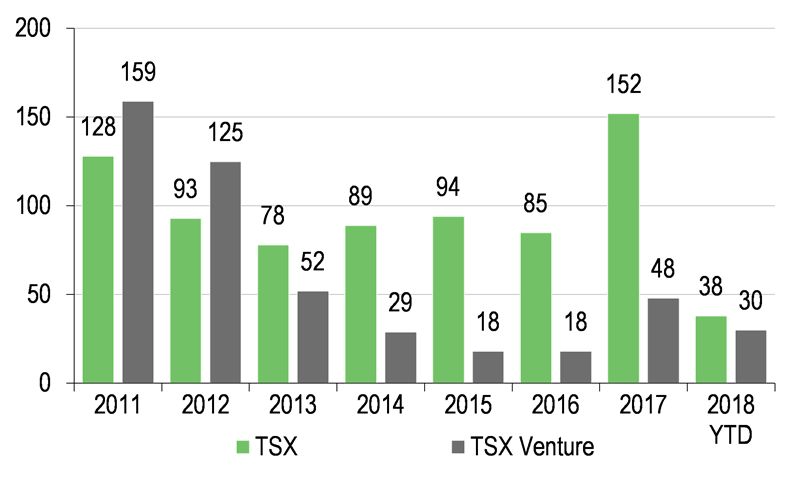
We have updated our charts showing the number of IPOs on Nasdaq, the Canadian TSX and TSX Venture exchanges as an indicator of corporate activity levels in these equity markets. The run rate for Nasdaq and TSX Venture has been well ahead of the same period last year, although the TSX is running at a markedly lower level.
|
Exhibit 6: Nasdaq – number of IPOs |
Exhibit 7: TSX and TSX Venture – number of IPOs |
|
|
|
Source: Nasdaq |
Source: TMX. Note: Year to date 2018 is to end April. |
|
Exhibit 6: Nasdaq – number of IPOs |
|
|
Source: Nasdaq |
|
Exhibit 7: TSX and TSX Venture – number of IPOs |
|
|
Source: TMX. Note: Year to date 2018 is to end April. |
The one-year performance of the S&P 500, Nasdaq Composite, S&P TSX Venture and OTCQX Composite have all been positive with equity markets rallying from a period of increased volatility earlier in the year. US and global economic growth has also been sustained, suggesting the background for prospective corporate activity and IPOs should be broadly supportive.
OTCM’s corporate segment should benefit from this background with other more specific factors coming into play, including the number of international corporates seeking US market exposure and the traction of OTCM’s own marketing initiatives.
Within Market Data Licensing wider take-up of newer products such as compliance data, together with the continued benefit of price increases compared with the prior year period, should allow revenue progress even if the number of professional users remains at a similar level.
OTC Link ATS is likely to continue to be affected by the challenging background for its broker-dealer customers. However, development of OTC Link ECN and work on adding functionality to both the ATS and ECN should help OTCM’s competitive position and potentially generate incremental revenue.
On a longer view, OTCM’s relatively low cost for corporate clients should put it in a strong position to act as a venue for secondary trading of equities issued through online capital-raising (under Regulation A+ and facilitated by JOBS Act). OTCM has joined others in supporting legislation which, if enacted, would broaden the pool of companies that could employ this form of funding to those that are SEC reporting.
Among the sensitivities to consider for OTCM are the risk that a competitor adopts more aggressive behaviour, that there is an adverse regulatory development that could affect the number of broker-dealer participants and data licence revenue, and that the momentum in gaining Blue Sky recognitions slows. Conversely, a higher level of net new corporate client signings, paired with broader Blue Sky recognition, would help create the conditions for a virtuous circle benefiting all parts of the business and generating positive earnings surprises.
Financials
We have made limited changes to our estimates following the first quarter, with a marginal reduction in estimated revenue, modestly lower pre-tax profit numbers and essentially unchanged earnings estimates on a slightly lower assumed tax rate.
Exhibit 8: Estimate revisions
|
Gross revenue ($m) |
PBT ($m) |
EPS ($) |
Dividend ($) |
||||||||
|
Old |
New |
Change (%) |
Old |
New |
Change (%) |
Old |
New |
Change (%) |
Old |
New |
Change (%) |
2018e |
57.7 |
57.3 |
(0.7) |
20.1 |
19.2 |
(4.2) |
1.29 |
1.29 |
0.0 |
1.19 |
1.19 |
0.0 |
2019e |
60.2 |
60.1 |
(0.2) |
21.1 |
20.5 |
(2.7) |
1.34 |
1.35 |
0.0 |
1.24 |
1.24 |
0.0 |
Source: Edison Investment Research. Note: For 2017 “old “numbers are estimates and “new” actual reported.
The end-March cash position, including $0.5m of restricted cash held as clearing collateral, stood at $23.4m compared with $24.4m at end 2017 and $23.7m for Q117. The first half tends to see weaker cash flows reflecting the incidence of bonus payments and other annual costs. Dividends and share buybacks and absorbed $2.6m (compared with $3.0m for Q117 and $15.4m for FY17).
Valuation
Our comparative P/E table includes global exchanges and information providers, MSCI and Markit, as they can be seen as having something in common with OTCM’s subscription-based fees and market data income (Exhibit 9). OTCM continues to trade on multiples below or similar to the consensus averages for the exchanges and information providers. While OTCM’s relatively small scale in relation to these businesses could be seen as a reason for this rating discount, the flip side is the potential for the business to generate positive surprises if it continues to secure increased regulatory recognition and this feeds through into increased client wins.
Exhibit 9: OTCM comparative multiples
Estimated P/E ratios (x) |
||
FY18e |
FY19e |
|
MSCI |
30.1 |
26.1 |
Markit |
22.3 |
19.6 |
Average information providers |
26.2 |
22.9 |
Average global exchanges |
23.1 |
20.6 |
S&P 500 |
17.2 |
15.6 |
OTCM |
20.6 |
19.7 |
Source: Bloomberg, Edison Investment Research. Note: Prices as at 25 May 2018.
Flexing our discounted cash flow model assumptions to match the current share price ($26.50, 25 May 2018), one combination producing this value is a discount rate of 10%, a long-term growth rate of 3.5% and a terminal operating cash flow multiple of 16.0x (compares with a current year value of 17.1x). These assumptions do not seem aggressive and, with broadly stable estimates at this stage, we maintain our fair value estimate at c $29. Exhibit 10 shows the sensitivity of our valuation to discount rate and growth assumptions.
Exhibit 10: Discounted cash flow valuation sensitivity ($ per share)
Discount rate (right) |
7% |
8% |
9% |
10% |
11% |
3% |
31.7 |
29.5 |
27.5 |
25.8 |
24.1 |
4% |
33.6 |
31.3 |
29.2 |
27.3 |
25.5 |
5% |
35.7 |
33.2 |
30.9 |
28.9 |
27.0 |
6% |
38.0 |
35.3 |
32.8 |
30.6 |
28.6 |
Source: Edison Investment Research
Exhibit 11: Financial summary
$000s |
2015 |
2016 |
2017 |
2018e |
2019e |
||
Year-end 31 December |
|||||||
PROFIT & LOSS |
|||||||
OTC Link ATS |
11,796 |
10,573 |
10,074 |
10,074 |
9,973 |
||
Market Data Licensing |
20,610 |
21,054 |
21,922 |
23,413 |
24,583 |
||
Corporate Services |
17,503 |
19,254 |
22,660 |
23,793 |
25,577 |
||
Revenue |
49,909 |
50,881 |
54,656 |
57,280 |
60,134 |
||
Re-distribution fees and rebates |
(2,379) |
(2,317) |
(2,480) |
(2,635) |
(2,766) |
||
Net revenue |
|
|
47,530 |
48,564 |
52,176 |
54,645 |
57,368 |
Operating expenses |
(28,972) |
(30,032) |
(32,511) |
(34,462) |
(35,840) |
||
EBITDA |
|
|
18,558 |
18,532 |
19,665 |
20,183 |
21,528 |
Depreciation |
(1,692) |
(1,606) |
(1,361) |
(1,000) |
(1,030) |
||
Operating profit (before amort. and except). |
16,866 |
16,926 |
18,304 |
19,183 |
20,498 |
||
Net interest |
27 |
9 |
47 |
38 |
40 |
||
Profit Before Tax (norm) |
|
|
16,893 |
16,935 |
18,351 |
19,221 |
20,538 |
Tax |
(6,635) |
(6,407) |
(5,792) |
(3,844) |
(4,313) |
||
Profit after tax |
10,258 |
10,528 |
12,559 |
15,377 |
16,225 |
||
Profit after tax and allocation to RSAs |
9,971 |
10,252 |
12,241 |
15,059 |
15,907 |
||
Average Number of Shares Outstanding (m) |
11.3 |
11.3 |
11.6 |
11.7 |
11.8 |
||
EPS - normalised (c) |
|
|
90.6 |
92.4 |
109.9 |
131.6 |
137.4 |
Fully diluted EPS (c) |
|
|
88.3 |
90.4 |
105.8 |
128.8 |
134.5 |
Dividend per share (c) |
108.0 |
116.0 |
116.0 |
119.0 |
124.0 |
||
EBITDA Margin (%) |
39 |
38 |
38 |
37 |
38 |
||
Operating profit margin (%) |
35 |
35 |
35 |
35 |
36 |
||
BALANCE SHEET |
|||||||
Non-current assets |
|
|
|
|
|
||
Intangible assets |
291 |
291 |
362 |
401 |
501 |
||
Property and other |
4,187 |
3,267 |
3,506 |
3,356 |
3,226 |
||
Current assets |
|
|
|
|
|
||
Debtors |
6,082 |
6,262 |
6,450 |
6,450 |
6,450 |
||
Cash & cash investments |
23,925 |
25,034 |
23,683 |
26,613 |
30,252 |
||
Other current assets |
1,729 |
1,789 |
2,316 |
2,316 |
2,316 |
||
Current liabilities |
|
|
|
|
|
||
Deferred revenues |
(12,737) |
(14,664) |
(15,531) |
(16,000) |
(16,000) |
||
Other current liabilities |
(5,063) |
(5,372) |
(5,644) |
(5,644) |
(5,644) |
||
Long-term liabilities |
|
|
|
|
|
||
Tax, rent and other |
(867) |
(1,101) |
(1,351) |
(1,351) |
(1,351) |
||
Net assets |
|
|
17,547 |
15,506 |
13,791 |
16,141 |
19,750 |
NAV per share ($) |
|
|
1.55 |
1.36 |
1.21 |
1.40 |
1.70 |
CASH FLOW |
|||||||
Operating cash flow |
|
|
22,400 |
21,752 |
21,629 |
22,326 |
23,228 |
Net Interest |
27 |
9 |
47 |
38 |
40 |
||
Tax |
(5,320) |
(6,021) |
(5,193) |
(3,844) |
(4,313) |
||
Capex / intangible investment |
(940) |
(415) |
(1,165) |
(750) |
(800) |
||
Financing / investments |
(420) |
(1,157) |
(3,407) |
(1,221) |
(200) |
||
Dividends |
(12,094) |
(13,059) |
(13,262) |
(13,619) |
(14,315) |
||
Net cash flow |
3,653 |
1,109 |
(1,351) |
2,930 |
3,639 |
||
Opening net (debt)/cash |
|
|
20,272 |
23,925 |
25,034 |
23,683 |
26,613 |
Closing net (debt)/cash |
|
|
23,925 |
25,034 |
23,683 |
26,613 |
30,252 |
Source: OTC Markets Group accounts, Edison Investment Research
|
|
Pointer Telocation has announced a new collaboration with Microsoft Israel to create an AI-powered driver monitoring and prediction tool. We see the potential for this to give Pointer an important edge in the driver monitoring space in which it is already competing strongly. Q118 results showed a recovery in product sales from Q4 (up 29% q-o-q), but only 5.6% y-o-y growth arising from low demand for non-LTE enabled devices and Latin American (Latam) currency declines. Nevertheless, the group continued to deliver on local currency service revenues, margin gains and cash flow generation but, with Latam currencies continuing to weaken in Q2, despite expected boosts to sales later in the year, we have trimmed our current year EBITDA and EPS forecasts by 10% and 22%, respectively giving rise to a peer-based valuation of $19.1/NIS68.3, and DCF value of $18.1/share or NIS64.6/share.