Pointer Telocation has announced a new collaboration with Microsoft Israel to create an AI-powered driver monitoring and prediction tool. We see the potential for this to give Pointer an important edge in the driver monitoring space in which it is already competing strongly. Q118 results showed a recovery in product sales from Q4 (up 29% q-o-q), but only 5.6% y-o-y growth arising from low demand for non-LTE enabled devices and Latin American (Latam) currency declines. Nevertheless, the group continued to deliver on local currency service revenues, margin gains and cash flow generation but, with Latam currencies continuing to weaken in Q2, despite expected boosts to sales later in the year, we have trimmed our current year EBITDA and EPS forecasts by 10% and 22%, respectively giving rise to a peer-based valuation of $19.1/NIS68.3, and DCF value of $18.1/share or NIS64.6/share.
Written by
Pointer Telocation |
New Microsoft AI collaboration |
Q118 results and Microsoft collaboration |
Tech hardware & equipment |
29 May 2018 |
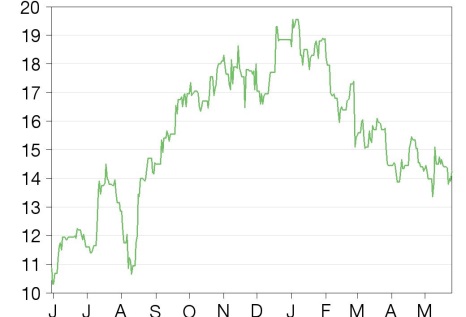
Share price performance
Business description
Next events
Analysts
|
||||||||||||||||||||||||||||||||||||||||||||||||||||
Pointer Telocation has announced a new collaboration with Microsoft Israel to create an AI-powered driver monitoring and prediction tool. We see the potential for this to give Pointer an important edge in the driver monitoring space in which it is already competing strongly. Q118 results showed a recovery in product sales from Q4 (up 29% q-o-q), but only 5.6% y-o-y growth arising from low demand for non-LTE enabled devices and Latin American (Latam) currency declines. Nevertheless, the group continued to deliver on local currency service revenues, margin gains and cash flow generation but, with Latam currencies continuing to weaken in Q2, despite expected boosts to sales later in the year, we have trimmed our current year EBITDA and EPS forecasts by 10% and 22%, respectively giving rise to a peer-based valuation of $19.1/NIS68.3, and DCF value of $18.1/share or NIS64.6/share.
Year end |
Revenue ($m) |
PBT* |
EPS* |
DPS |
EV/EBITDA |
P/E |
Yield |
12/16 |
64.4 |
6.6 |
81 |
0.0 |
11.9 |
17.6 |
N/A |
12/17 |
78.2 |
10.4 |
116 |
0.0 |
8.4 |
12.3 |
N/A |
12/18e |
83.6 |
10.4 |
113 |
0.0 |
8.1 |
12.6 |
N/A |
12/19e |
94.0 |
12.4 |
133 |
33.4 |
7.0 |
10.7 |
2.3 |
Note: *PBT and EPS (FD) are normalised, excluding amortisation of acquired intangibles, exceptional items and share-based payments.
Strategy on track for margin gains
Pointer Telocation’s strategy continued to yield results in Q118, with the normalised EBITDA margin expanding 60bp from Q417 to 17.6%. We see this as putting the group on track to achieve its target of a 20%+ EBITDA margin in 2020 (as part of its overall three- to five-year target of a 25% EBITDA margin). Management is actively pursuing acquisition targets principally in the US and other existing markets, which should further feed into expanded margins via the group’s high operating leverage.
LTE a short-term problem but long-term opportunity
Since Q417, US product sales have been affected by Pointer not having launched its own LTE-enabled devices (this should happen in Q418) The situation should improve substantially once this happens and Pointer can take advantage of US customers refitting their fleets with these devices. The planned launch of a new telematics unit for the Indian passenger transit market around Q318, which is compliant with new regulations, is also likely to feed into higher H2 sales.
Valuation: Share price weakness exposes good value
Pointer’s shares have lost c 30% since their high of $19.55 at the start of the year. We believe they represent good value at present, trading at a c 28% discount to the sector on current year EV/EBITDA, despite having a high degree of exposure to fast-growth segments of the market such as connected car, IoT, driver safety and emerging markets. Based on an average of FY1 and FY2 valuations derived from parity EV/EBITDA multiples, we value the shares at of $19.1/NIS68.3. Our DCF valuation of $18.1/share or NIS64.6/share still indicates 27% upside potential.
Microsoft AI cooperation: Ready to be monetised
The addition of AI will bring driver monitoring to the next level: in recent days Microsoft Israel and Pointer’s management have announced a new cooperation agreement to work together to create an AI system for modelling and understanding driver behaviour. Pointer Telocation’s management is looking to base the system on the large volume of data already collected and being collected on an ongoing basis by the group’s devices currently deployed across multiple fleets of commercial and passenger vehicles. This, together with environmental data such as speed limits, weather conditions and road types, will be used to analyse driver behaviour and create a highly enriched predictive system which should have the ability to forecast which drivers are most likely to have accidents based on their driving history. It will also be used real-time to provide drivers with tips to improve their safety.
The collaboration brings together Pointer’s expertise in fleets, driver behaviour and data collection via its IoT and telocation systems and Microsoft Azure’s cloud-based AI system.
Pointer already has the market and clients ready to adopt this technology: we believe that Pointer is in a strong position to develop this technology rapidly, based on the existing data at hand and its already high level of expertise in driver monitoring. Perhaps more importantly we expect Pointer to be able to rapidly monetise this new technology already being a major player in driver monitoring and assessment systems, with the service an important component of its commercial fleet offering. Last year the group extended its market reach into the ride-hail market with the winning (together with Mobileye) of a driver monitoring contract for ride-hail firms in New York. The ability to offer cutting-edge technology to passenger fleets – where safety is a key potential service differentiator – should provide a strong edge to help gain new contracts.
Pointer is undoubtedly not alone in work to incorporate AI into its driver monitoring systems, but to the extent that the use of AI enriched systems is likely to make current systems obsolete, we see this step likely to lead to expanding market share in the short term and as a key to maintaining growth in the longer term.
First-quarter results summary
Q118 affected by FX weakness and impending LTE switch
EBITDA and revenues reported in the first quarter were slightly below expectation at 23.8% and 23.0%, respectively, of our full-year expectations. The key influences on earnings were as follows:
Sluggish product revenues arising from the planned switch over from 3G to LTE (4G) in the US. The upcoming switch to LTE/4G networks in the US is leading fleets to either buy directly from vendors selling LTE-enabled telematics devices or delay purchases of new equipment until LTE devices are available from their preferred vendor (as in the case with Pointer, which does not expect to have its LTE-enabled devices ready until Q418). Concerns that 3G systems may be switched off in the next year or two by carriers in the US is driving a strong downturn in demand for existing 3G enabled equipment, that otherwise would still be saleable at a discount to LTE equipment. This follows speculation that carriers are preparing to switch off their 3G networks – with AT&T preventing new 3G devices from being certified as long ago as June last year.
Currency weakness affected dollar revenues. Q1 saw considerable weakness in Latam currencies, particularly the Argentinian peso. This had a negative effect on dollar-denominated service ARPUs, which fell 3% y-o-y in the first quarter. Over the first quarter the Argentinian and Mexican currencies weakened 7.5% and 7.3% (with the Brazilian real remaining flat).
Exhibit 1: Quarterly results summary
$m |
Q118 |
Q117 |
Change y-o-y (%) |
Q417 |
2018e |
2017 |
Change y-o-y (%) |
Product revenues |
7.06 |
6.68 |
5.6 |
5.46 |
28.30 |
26.18 |
8.1 |
Change (%) |
5.6 |
21.3 |
N/A |
(6.5) |
8.1 |
14.9 |
N/A |
Services revenues |
13.82 |
12.35 |
11.9 |
13.39 |
55.30 |
51.97 |
6.4 |
Change (%) |
11.9 |
32.5 |
N/A |
15.8 |
6.4 |
25.0 |
N/A |
Revenue |
20.88 |
19.03 |
9.7 |
18.85 |
83.60 |
78.16 |
7.0 |
Change (%) |
9.7 |
28.4 |
N/A |
8.4 |
7.0 |
21.4 |
N/A |
Cost of products |
(4.22) |
(4.28) |
(1.2) |
(3.24) |
(17.60) |
(16.07) |
9.5 |
Gross profit products |
2.84 |
2.41 |
17.8 |
2.22 |
10.70 |
10.11 |
5.8 |
Gross margin products (%) |
40.2 |
36.0 |
N/A |
40.6 |
37.8 |
38.6 |
N/A |
Cost of services |
(5.71) |
(5.36) |
6.5 |
(5.62) |
(22.86) |
(21.91) |
4.3 |
Gross profit services |
8.11 |
6.99 |
16.1 |
7.77 |
32.44 |
30.06 |
7.9 |
Gross margin services (%) |
58.7 |
56.6 |
N/A |
58.0 |
58.7 |
57.8 |
N/A |
Cost of sales |
(9.94) |
(9.64) |
3.1 |
(8.86) |
(40.46) |
(37.99) |
6.5 |
Gross profit |
10.95 |
9.39 |
16.6 |
9.99 |
43.14 |
40.17 |
7.4 |
Gross margin (%) |
52.4 |
49.4 |
N/A |
53.0 |
51.6 |
51.4 |
N/A |
Research and development |
(1.24) |
(0.97) |
27.5 |
(1.03) |
(4.78) |
(4.05) |
18.0 |
Selling and marketing |
(3.87) |
(3.31) |
17.0 |
(3.68) |
(15.55) |
(14.04) |
10.8 |
General and administrative |
(2.89) |
(2.75) |
5.0 |
(2.81) |
(11.94) |
(11.28) |
5.9 |
EBITDA (norm./continuing operations) |
3.67 |
3.22 |
14.2 |
3.20 |
14.40 |
13.89 |
3.7 |
EBITDA margin |
17.6% |
16.9% |
N/A |
17.0% |
17.2% |
17.8% |
N/A |
Operating profit normalised |
3.10 |
2.48 |
25.0 |
2.55 |
11.25 |
11.43 |
(1.6) |
Operating margin normalised |
14.8% |
13.0% |
N/A |
13.5% |
13.5% |
14.6% |
N/A |
One-off items |
(0.26) |
0.00 |
N/A |
(0.03) |
(0.36) |
(0.03) |
1,031.3 |
Operating profit |
2.57 |
2.26 |
13.8 |
2.31 |
10.10 |
10.31 |
(2.1) |
Operating margin (%) |
12.30 |
11.85 |
N/A |
12.27 |
12.08 |
13.19 |
N/A |
Net finance costs |
(0.33) |
(0.16) |
108.8 |
(0.30) |
(0.81) |
(1.00) |
(19.7) |
Other expenses |
(0.02) |
0.00 |
N/A |
(0.01) |
0.00 |
(0.01) |
(100.0) |
PBT normalised |
2.75 |
2.32 |
18.5 |
2.25 |
10.45 |
10.42 |
0.2 |
PBT |
2.22 |
2.10 |
5.8 |
2.01 |
9.29 |
9.30 |
(0.1) |
Reported tax |
(0.45) |
(0.53) |
(15.1) |
9.10 |
(2.04) |
7.22 |
(128.3) |
Profit after tax reported |
1.77 |
1.57 |
12.9 |
11.11 |
7.25 |
16.52 |
(56.1) |
Profit after tax normalised (continuing ops) |
2.30 |
1.79 |
28.4 |
3.13 |
9.40 |
9.43 |
(0.3) |
EPS - basic ($) |
0.22 |
0.20 |
10.8 |
1.38 |
0.90 |
2.07 |
(56.5) |
EPS - diluted ($) |
0.21 |
0.20 |
9.3 |
1.35 |
0.87 |
2.03 |
(57.0) |
EPS - basic normalised ($) |
0.29 |
0.23 |
26.0 |
0.39 |
1.17 |
1.18 |
(1.1) |
EPS - diluted normalised ($) |
0.28 |
0.22 |
24.3 |
0.38 |
1.13 |
1.16 |
(2.3) |
Source: Pointer Telocation, Edison Investment Research
Despite FX headwinds service revenues still grew 12% on 15% y-o-y subscriber growth Management reported overall positive conditions across its markets, including South Africa and this was reflected in strong service revenue growth. A 15% y-o-y increase in subscribers compared with Q117 helped Q118 service revenues grow 11.7% y-o-y despite the FX headwinds. With no acquisitions during the quarter, net subscriber additions of 7,000 in the first quarter (down 22.2% y-o-y) represented lower annualised growth of 11%.
Gross margins on products were affected by weaker sales growth. The gross margin on product sales fell from 40.6% in Q417 to 40.2% in the first quarter. The gross margin on services expanded from 58.0% in Q4 to 58.7% in Q1 helped by 12% y-o-y sales growth and ongoing operating leverage (new customers having much higher margins than existing due to their low marginal fixed costs).
Opex affected by rising R&D and S&M costs, and one-time expensed acquisition costs. Management undertook an increase in R&D (up 28% y-o-y) and marketing expenses (up 17% y-o-y) in Q118 to pursue growth objectives, the results of which should be seen in product releases and increased sales in Q3 and Q4, as discussed above. The group also incurred one-time acquisition costs of $262,000, which arose from undertaking due diligence on a target, but pulling out of the deal when conditions proposed rendered it unattractive.
Exhibit 2: Key data
$m |
Q118 |
Q117 |
Change y-o-y (%) |
Q417 |
2018e |
2017 |
Change y-o-y (%) |
MRM subscribers (including CC* subs) |
265,000 |
231,000 |
14.7 |
258,000 |
292,600 |
258,000 |
13.4 |
Net additions |
7,000 |
9,000 |
(22.2) |
9,000 |
34,600 |
36,000 |
(3.9) |
of which subscriber acquisitions |
0 |
0 |
N/A |
2,400 |
0 |
2,400 |
(100.0) |
Avg. service rev. per MRM subscriber ($/mth) |
17.6 |
18.2 |
(3.0) |
17.6 |
16.7 |
18.0 |
(7.2) |
Cash flow/balance sheet summary |
|||||||
Operating cash flow |
2.32 |
1.51 |
54.1 |
0.00 |
12.61 |
9.70 |
30.0 |
Cash conversion (operating CF to op. profit, %) |
90.3 |
66.7 |
N/A |
0.0 |
124.9 |
94.1 |
N/A |
Cash flows from investment |
(0.93) |
(0.75) |
24.1 |
0.00 |
(4.79) |
(3.15) |
52.1 |
Purchases of property, plant and equipment |
(0.96) |
(0.77) |
24.7 |
0.00 |
(4.99) |
(3.03) |
64.7 |
Cash & cash equivalents |
7.77 |
5.75 |
35.0 |
7.38 |
10.37 |
7.38 |
40.6 |
Net debt/(cash)($m) |
1.08 |
8.06 |
(86.6) |
2.74 |
(4.27) |
2.74 |
(255.9) |
Net debt/(cash)/equity (%) |
1.65 |
17.20 |
N/A |
4.32 |
(5.97) |
4.32 |
N/A |
Current ratio |
1.44 |
1.32 |
N/A |
1.44 |
1.63 |
1.44 |
N/A |
Quick ratio |
1.16 |
1.05 |
N/A |
1.13 |
1.31 |
1.13 |
N/A |
Source: Pointer Telocation, Edison Investment Research. Note: *Connected car.
Outlook
Various headwinds, and most particularly ongoing currency weakness in Latam markets, have led us to cut our earnings forecasts for 2018 and 2019 as per Exhibit 3. We believe that FX weakness and the lack of LTE-enabled products in the US will continue to exert a negative influence in Q2, but depending on the ongoing currency direction, the trend should improve from late Q3 and through Q418 as a number of factors come together to improve revenues and earnings, as discussed below.
Exhibit 3: Pointer Telocation change in earnings forecasts
$m |
Revenues ($m) |
EBITDA* ($m) |
EPS (c)** |
||||||
|
Old |
New |
% chg. |
Old |
New |
% chg. |
Old |
New |
% chg. |
2017 |
N/A |
78.2 |
N/A |
N/A |
13.9 |
N/A |
N/A |
116.0 |
N/A |
2018e |
87.7 |
83.6 |
-4.7 |
16.0 |
14.4 |
-10.0 |
144.5 |
113.3 |
-21.6 |
2019e |
98.6 |
94.0 |
-4.7 |
18.5 |
16.6 |
-10.1 |
169.2 |
133.4 |
-21.1 |
Source: Edison Investment Research. Note: *Normalised, continuing operations. **Diluted normalised.
Currency weakness will almost certainly continue to affect US dollar denominated earnings in Q2 and likely Q3, also. As mentioned above both the Argentinean and Mexican pesos fell 9% against the dollar over the course of the first quarter. Since the end of Q118 they have fallen a further 20% and 9%, respectively with the Brazilian real adding its own 9% decline after having firmed 1% in the first quarter. We expect this weakness to feed through into an 8.5% y-o-y decline in service ARPUs (average revenues per user) in Q218 to $16.7 after the 3% y-o-y decline to $17.6 in Q1. Quarter to date (to 22 May 2018), the Argentinean, Brazilian and Mexican currencies are down 27%, 8% and 2% vs Q217 while the NIS is up 0.8%. As a result we have cut our forecast of Q2 annualised revenue growth to 4.9% after 9.7% in Q1. The impact on EBITDA should be diminished by the positive impact of FX weakness on local expenses.
|
Exhibit 4: Average quarterly FX rates to US$ rebased to 100 at Q316 |
|
|
Source: Bloomberg |
We expect the revenue situation to improve later in the year, however. Sales of Pointer’s internet of things tracking device, CelloTrack Nano should grow more rapidly from Q318 as deliveries should begin under the recurring $2-3m per year contract announced in 2017. The group plans to launch LTE enabled devices in Q3 which should increase US sales, with complete migration of the products to an updated platform by Q4.
We expect sales of LTE/4G-enabled telematics products to also recover significantly after the planned launch of Pointer’s product in late Q3/early Q418, with the potential double-positive of increased sales of replacement products to fleet managers looking to future-proof their fleets for the eventual switch-off of 3G systems.
In India, the introduction of regulation AIS140 under the government’s Intelligent Transportation System programme will require the installation of new telematics units in all passenger transit vehicles. These will transmit data to the government and to the service provider. Pointer, which has operations in India and already supplies telematics to the passenger transit segment, is hoping to be the one of the first companies to bring the product to market and to start generating sales from Q3.
We also expect the group to make a substantial increase in sales of connected car products this year. Sales from the contracts with car importers in Israel as well as Nissan India commenced in India in Q317 and Israel in Q417. We estimate that they contributed $0.1-0.3m to 2017 revenues. We forecast this to increase to $1.1m this year based on a full year of operation in both cases.
We also introduced a normalised tax rate of 10.0% for FY18 and FY19 to bring it into line with the Q118 figure of 10.1%. This has a negative impact on the adjusted EPS forecast, but otherwise has no impact on the company’s underlying value.
We believe that further acquisitions are likely this year. The group is pursuing several acquisition targets, particularly in North America as well as in other existing markets, including India. In addition, management is hoping to secure major contracts in areas such as the ride-hail market, which could provide a further boost to margins and profits.
Valuation
Peer valuation
We have updated our peer-based valuation for Pointer Telocation to include the downward revision in our earnings forecasts and note that there have been increases in sector multiples since our last update. Based on the application of an average of the FY1 and FY2 valuations derived from the application of the peer EV/EBTIDA multiples to Pointer’s EBITDA and net debt data, we calculate the fair value of the shares at $19.1 (NIS68.3) down from a previous $20.8/share (NIS71.8/share).
Exhibit 5: Peer valuation
Main focus |
Share price (LC) |
Market cap ($m) |
Sales FY1 ($m) |
EV/Sales FY1 (x) |
EV/EBITDA FY1 (x) |
EV/EBITDA FY2 (x) |
P/E |
P/E |
Last div yield (%) |
|
Pointer Telocation |
Israel, Latam, SA, US |
13.8 |
111 |
84 |
1.3 |
7.8 |
6.7 |
12.1 |
10.3 |
0.0 |
CalAmp |
NAM |
21.0 |
752 |
388 |
1.9 |
12.5 |
10.7 |
16.6 |
14.6 |
0.0 |
ID Systems |
NAM |
5.9 |
104 |
54 |
1.8 |
67.3 |
16.6 |
69.4 |
16.4 |
0.0 |
Ituran Location and Control |
Isr,,Brzl,Arg |
31.3 |
655 |
262 |
2.4 |
8.1 |
7.4 |
14.5 |
12.7 |
3.0 |
MiX Telematics |
SA |
242.5 |
463 |
1,839 |
3.1 |
10.8 |
9.5 |
813.6 |
650.0 |
N/A |
ORBCOMM |
US/Europe |
9.6 |
751 |
296 |
3.3 |
17.0 |
11.8 |
(40.0) |
162.2 |
0.0 |
Sierra Wireless |
NAM |
17.6 |
631 |
793 |
0.8 |
10.8 |
8.2 |
20.1 |
14.0 |
0.0 |
Trakm8 Holdings |
UK |
0.9 |
43 |
32 |
1.1 |
7.0 |
5.7 |
12.6 |
9.1 |
0.0 |
QUALCOMM |
NAM |
57.4 |
85,088 |
22,007 |
3.1 |
10.7 |
8.1 |
17.9 |
16.4 |
3.8 |
Quartix Holdings |
UK |
3.8 |
242 |
25 |
6.9 |
23.2 |
26.4 |
30.4 |
34.5 |
1.8 |
Telit |
IoT, Global |
2.0 |
263 |
411 |
0.7 |
8.1 |
6.2 |
0.4 |
0.2 |
0.0 |
Median |
463 |
296 |
1.9 |
10.8 |
8.2 |
16.6 |
14.6 |
0.0 |
||
Average/Median MCAP<$300m |
173 |
336 |
1.6 |
12.3 |
8.6 |
21.5 |
13.3 |
0.0% |
||
Pointer premium/(discount) to peers |
(30.8) |
(27.9) |
(17.4) |
(26.8) |
(29.3) |
N/A |
||||
Source: Bloomberg, Edison Investment Research. Note: Priced at 15 May 2018.
DCF valuation
Our DCF valuation has fallen 13% to $18.1/share (NIS64.6) per share following the rolling forward of the model and the reduction in our forecasts. We note that the above-mentioned peer valuation of $19.4/share can be achieved with an increase in the TV growth assumption from 2.5% to 3.2% or a reduction in the WACC from the current 10.1% to 9.7%.
Exhibit 6: Pointer Telocation DCF sensitivity
Terminal growth rate |
||||||
20.797 |
1.50% |
2.00% |
2.50% |
3.00% |
3.50% |
|
WACC |
13.0% |
12.3 |
12.5 |
12.8 |
13.1 |
13.5 |
12.0% |
13.6 |
13.9 |
14.3 |
14.7 |
15.2 |
|
11.0% |
15.1 |
15.6 |
16.1 |
16.6 |
17.3 |
|
10.1% |
16.8 |
17.4 |
18.1 |
18.8 |
19.7 |
|
9.0% |
19.5 |
20.3 |
21.3 |
22.4 |
23.8 |
|
8.0% |
22.7 |
23.9 |
25.3 |
27.1 |
29.2 |
|
7.0% |
27.0 |
28.9 |
31.2 |
34.0 |
37.7 |
|
6.0% |
33.3 |
36.4 |
40.4 |
45.6 |
53.0 |
|
5.0% |
43.3 |
48.9 |
56.9 |
68.8 |
88.6 |
|
4.0% |
61.1 |
74.0 |
95.4 |
138.2 |
266.8 |
|
Source: Edison Investment Research
Exhibit 7: Financial summary
$m |
2015 |
2016 |
2017 |
2018e |
2019e |
2020e |
||
31 December |
US GAAP |
US GAAP |
US GAAP |
US GAAP |
US GAAP |
US GAAP |
||
INCOME STATEMENT |
||||||||
Revenue |
|
|
60.57 |
64.35 |
78.16 |
83.60 |
93.97 |
105.74 |
Cost of Sales |
(31.31) |
(32.58) |
(37.99) |
(40.46) |
(45.39) |
(50.91) |
||
Gross Profit |
29.25 |
31.78 |
40.17 |
43.14 |
48.58 |
54.84 |
||
EBITDA |
|
|
8.80 |
9.76 |
13.89 |
14.40 |
16.61 |
19.17 |
Normalised operating profit |
|
|
7.10 |
7.64 |
11.43 |
11.25 |
12.87 |
14.80 |
Amortisation of acquired intangibles |
(0.54) |
(0.47) |
(0.46) |
(0.41) |
(0.36) |
(0.33) |
||
Exceptionals |
(0.91) |
(0.60) |
(0.28) |
(0.36) |
0.00 |
0.00 |
||
Share-based payments (incl. in COGS) |
(0.31) |
(0.32) |
(0.38) |
(0.39) |
(0.40) |
(0.40) |
||
Reported operating profit |
5.34 |
6.25 |
10.31 |
10.10 |
12.11 |
14.07 |
||
Net Interest |
(0.73) |
(1.05) |
(1.00) |
(0.81) |
(0.51) |
(0.34) |
||
Joint ventures & associates (post tax)/other |
(0.01) |
(0.01) |
(0.01) |
0.00 |
0.00 |
0.00 |
||
Exceptionals |
0.00 |
0.00 |
0.00 |
0.00 |
0.00 |
0.00 |
||
Profit before tax (norm) |
|
|
6.36 |
6.59 |
10.42 |
10.45 |
12.37 |
14.47 |
Profit before tax (reported) |
|
|
4.60 |
5.19 |
9.30 |
9.29 |
11.61 |
13.73 |
Reported tax |
(1.13) |
(1.85) |
7.22 |
(2.04) |
(2.55) |
(3.02) |
||
Profit after tax (norm) |
5.23 |
6.46 |
9.43 |
9.40 |
11.13 |
13.02 |
||
Profit after tax (reported) |
3.47 |
3.35 |
16.52 |
7.25 |
9.05 |
10.71 |
||
Minority interests |
0.08 |
(0.02) |
0.00 |
0.00 |
0.00 |
0.00 |
||
Discontinued operations |
0.33 |
0.15 |
0.00 |
0.00 |
0.00 |
0.00 |
||
Net income (normalised) |
5.30 |
6.44 |
9.43 |
9.40 |
11.13 |
13.02 |
||
Net income (reported) |
3.87 |
3.48 |
16.52 |
7.25 |
9.05 |
10.71 |
||
Basic average number of shares outstanding (m) |
7.73 |
7.82 |
8.00 |
8.06 |
8.07 |
8.07 |
||
EPS – basic normalised ($) |
|
|
0.69 |
0.82 |
1.18 |
1.17 |
1.38 |
1.61 |
EPS – diluted normalised ($) |
|
|
0.67 |
0.81 |
1.16 |
1.13 |
1.33 |
1.55 |
EPS – basic reported ($) |
|
|
0.50 |
0.44 |
2.07 |
0.90 |
1.12 |
1.33 |
Dividend ($) |
0.00 |
0.00 |
0.00 |
0.00 |
0.33 |
0.39 |
||
Revenue growth (%) |
N/A |
6.25 |
21.45 |
6.96 |
12.41 |
12.53 |
||
Gross margin (%) |
48.30 |
49.38 |
51.40 |
51.60 |
51.69 |
51.86 |
||
EBITDA margin (%) |
14.52 |
15.16 |
17.78 |
17.23 |
17.68 |
18.13 |
||
Normalised operating margin (%) |
11.71 |
11.87 |
14.63 |
13.46 |
13.70 |
14.00 |
||
BALANCE SHEET |
||||||||
Fixed assets |
|
|
68.78 |
51.61 |
64.01 |
64.72 |
65.08 |
65.16 |
Intangible assets |
31.83 |
40.29 |
42.95 |
42.74 |
42.58 |
42.25 |
||
Tangible assets |
3.28 |
5.61 |
5.85 |
7.52 |
8.95 |
10.46 |
||
Investments & other |
33.67 |
5.71 |
15.22 |
14.47 |
13.56 |
12.46 |
||
Current assets |
|
|
34.66 |
25.28 |
30.45 |
34.91 |
46.39 |
57.46 |
Stocks |
4.70 |
5.24 |
6.55 |
6.98 |
7.83 |
8.78 |
||
Debtors |
9.49 |
11.46 |
13.66 |
14.61 |
16.42 |
18.48 |
||
Cash & cash equivalents |
7.25 |
6.07 |
7.38 |
10.37 |
19.10 |
27.06 |
||
Other |
13.21 |
2.50 |
2.87 |
2.95 |
3.04 |
3.13 |
||
Current liabilities |
|
|
(30.45) |
(19.83) |
(21.20) |
(21.36) |
(23.48) |
(25.88) |
Creditors |
(9.82) |
(13.96) |
(15.21) |
(16.33) |
(18.33) |
(20.59) |
||
Short-term borrowings |
(4.82) |
(4.84) |
(5.10) |
(4.08) |
(4.08) |
(4.08) |
||
Other |
(15.81) |
(1.04) |
(0.89) |
(0.95) |
(1.07) |
(1.21) |
||
Long-term liabilities |
|
|
(17.95) |
(14.36) |
(9.85) |
(7.05) |
(7.26) |
(7.48) |
Long-term borrowings |
(8.39) |
(10.18) |
(5.02) |
(2.02) |
(2.02) |
(2.02) |
||
Other long-term liabilities |
(9.57) |
(4.18) |
(4.83) |
(5.03) |
(5.24) |
(5.46) |
||
Net assets |
|
|
55.04 |
42.69 |
63.42 |
71.22 |
80.74 |
89.26 |
Minority interests |
1.07 |
(0.16) |
(0.28) |
(0.28) |
(0.28) |
(0.28) |
||
Shareholders' equity |
|
|
56.10 |
42.53 |
63.13 |
70.94 |
80.45 |
88.97 |
CASH FLOW |
||||||||
Operating cash flow before WC and tax |
8.80 |
10.23 |
14.36 |
14.81 |
16.98 |
19.50 |
||
Working capital |
0.77 |
0.41 |
(2.14) |
(0.28) |
(0.63) |
(0.70) |
||
Exceptional & other |
3.12 |
(0.43) |
(0.71) |
(0.77) |
(0.36) |
(0.33) |
||
Tax |
0.18 |
(0.12) |
(0.80) |
(1.14) |
(1.37) |
(1.60) |
||
Net operating cash flow |
|
|
12.87 |
10.08 |
10.71 |
12.61 |
14.61 |
16.86 |
Capex |
(3.62) |
(4.13) |
(3.03) |
(4.99) |
(5.62) |
(6.38) |
||
Acquisitions/disposals |
0.00 |
(8.65) |
(0.23) |
(0.20) |
(0.20) |
0.00 |
||
Net interest |
(0.89) |
(1.05) |
(1.00) |
(0.81) |
(0.51) |
(0.34) |
||
Equity financing |
0.02 |
0.10 |
0.39 |
0.00 |
0.00 |
0.00 |
||
Dividends |
0.00 |
0.00 |
0.00 |
0.00 |
0.00 |
(2.69) |
||
Other, incl.PPE sales |
1.26 |
1.11 |
(0.10) |
0.40 |
0.45 |
0.51 |
||
Net cash flow |
9.63 |
(2.54) |
6.74 |
7.01 |
8.73 |
7.96 |
||
Opening net debt/(cash) |
|
|
11.90 |
5.95 |
8.95 |
2.74 |
(4.27) |
(13.01) |
FX |
(0.71) |
(0.46) |
(0.53) |
0.00 |
0.00 |
0.00 |
||
Other non-cash movements |
(2.97) |
0.00 |
0.00 |
0.00 |
0.00 |
0.00 |
||
Closing net debt/(cash) |
|
|
5.95 |
8.95 |
2.74 |
(4.27) |
(13.01) |
(20.97) |
Source: Company data, Edison Investment Research
|
|
In April 2018, Pluristem announced that the FDA had given two pipeline programs IND clearance: PLX-PAD for femoral neck fracture (FNF) healing and PLX-R18 for acute radiation syndrome (ARS). The company plans to initiate the Phase III trial investigating PLX-PAD for FNF healing later this year. IND approval of the PLX-R18 program allows for potential use of the product in the event of radiological emergencies for investigational purposes, which could provide in-human data.