Last close As at 05/08/2026
—
— 0.00 (0.00%)
Market capitalisation
—
Research: Investment Companies
Fidelity China Special Situations (FCSS) invests in a diversified portfolio of Chinese equities, seeking exposure to higher-quality companies, primarily in faster growing, consumer-orientated areas of the economy. FCSS provides actively managed exposure to the Chinese market, following a bottom-up investment approach, unconstrained by index weightings, and currently has no holdings in banks or property, which are considered to be higher-risk sectors. FCSS has achieved a 14.5% pa NAV total return since its launch in April 2010, and its performance is considerably ahead of the MSCI China index and the world market over three and five years.
Fidelity China Special Situations |
Attractive valuations and growth prospects |
Investment trusts |
15 September 2017 |
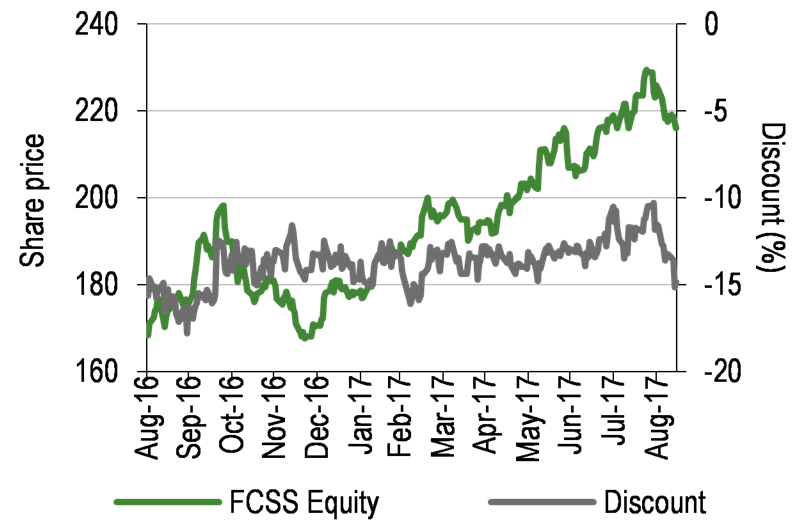
Share price/discount performance
Three-year performance vs index
Gearing
Analysts
|
|||||||||||||||||||||||||||||||||||||||||||||||||||||||||||||||||||||||||||||||||||||||||||||
Fidelity China Special Situations (FCSS) invests in a diversified portfolio of Chinese equities, seeking exposure to higher-quality companies, primarily in faster growing, consumer-orientated areas of the economy. FCSS provides actively managed exposure to the Chinese market, following a bottom-up investment approach, unconstrained by index weightings, and currently has no holdings in banks or property, which are considered to be higher-risk sectors. FCSS has achieved a 14.5% pa NAV total return since its launch in April 2010, and its performance is considerably ahead of the MSCI China index and the world market over three and five years.
12 months ending |
Share price |
NAV |
MSCI China |
MSCI World |
FTSE All-Share |
31/08/13 |
29.5 |
37.0 |
17.5 |
21.5 |
18.9 |
31/08/14 |
26.1 |
29.2 |
9.8 |
13.4 |
10.3 |
31/08/15 |
6.3 |
10.8 |
(1.9) |
4.1 |
(2.3) |
31/08/16 |
41.7 |
42.8 |
27.2 |
26.0 |
11.7 |
31/08/17 |
35.1 |
29.4 |
37.5 |
18.8 |
14.3 |
Source: Thomson Datastream. Note: All % on a total return basis in GBP.
Investment strategy: Selecting for quality and value
The manager follows a bottom-up investment approach to maintain a diversified portfolio of 130-140 holdings, with a bias to small- and mid-cap stocks, which tend to be under-researched and hence more frequently mispriced. There is a focus on faster growing, consumer-orientated companies with robust cash flows and capable management teams. Fidelity analysts provide in-depth stock coverage, with site visits and company meetings considered essential to the process, and risk management is viewed as a priority. FCSS has US$150m of borrowing and uses futures, options and contracts for difference (CFDs) to add gearing, as well as to take short positions. Unlisted securities may comprise up to 10% of the portfolio.
Market outlook: Positive fundamentals
Despite valuations rising over the last year, China’s ‘H’ share market trades at a 7.2x forward P/E multiple compared with 15.6x for the world market. Corporate earnings growth remains strong, reflecting China’s superior GDP growth. Historical market volatility provides grounds for caution, but investors with a long-term view may be attracted by China’s robust growth and discounted market valuation. The inclusion of China ‘A’ shares in MSCI emerging market indices from June 2018 may further encourage interest. A fund with a bottom-up approach, focusing on faster growing segments of China’s economy, may appeal as a route to gain exposure.
Valuation: Narrowing discount; rising dividend
FCSS’s share price discount to NAV cum income has followed a narrowing trend for more than one year, moving from 19.5% in July 2016 to 14.9% currently, which compares to its 11.8% five-year average. FCSS has traded at a premium as high as 13.2% since its launch in 2010, suggesting significant scope for further narrowing. A reallocation of expenses will raise the proportion of revenue returns from FY17, resulting in higher dividend distributions than otherwise (see page 7).
Exhibit 1: Trust at a glance
Investment objective and fund background |
Recent developments |
|||||||||||||||||||||||||||||||||||||||||||||||||||||||||||||||||||||||||||||||||||||||||||||||||||||||||||
Fidelity China Special Situations aims to achieve long-term capital growth from an actively managed portfolio made up primarily of securities issued by companies listed in China or Hong Kong and Chinese companies listed elsewhere. It may also invest in listed companies with significant interests in China and Hong Kong. Futures, options and contracts for difference (CFDs) are used to provide gearing, as well as to take short positions. |
■ 12 June 2017: FY17 results to 31 March 2017 – NAV TR +38.8% versus benchmark TR +37.6%; share price TR +45.8%. ■ 14 February 2017: Entered into new US$150m three-year revolving credit facility with Scotiabank Europe. ■ 21 November 2016: Interim results to 30 September 2016. NAV TR +29.1% versus benchmark TR +26.2%. Share price TR +30.8%. |
|||||||||||||||||||||||||||||||||||||||||||||||||||||||||||||||||||||||||||||||||||||||||||||||||||||||||||
Forthcoming |
Capital structure |
Fund details |
||||||||||||||||||||||||||||||||||||||||||||||||||||||||||||||||||||||||||||||||||||||||||||||||||||||||||
AGM |
July 2018 |
Ongoing charges |
1.16% (FY17) |
Group |
Fidelity International |
|||||||||||||||||||||||||||||||||||||||||||||||||||||||||||||||||||||||||||||||||||||||||||||||||||||||
Interim results |
November 2017 |
Net market gearing* |
16.6% |
Manager |
Dale Nicholls |
|||||||||||||||||||||||||||||||||||||||||||||||||||||||||||||||||||||||||||||||||||||||||||||||||||||||
Year end |
31 March |
Annual mgmt fee |
1.0% of net assets |
Address |
Beech Gate, Millfield Lane, Lower Kingswood, Tadworth, KT20 6RP |
|||||||||||||||||||||||||||||||||||||||||||||||||||||||||||||||||||||||||||||||||||||||||||||||||||||||
Dividend paid |
July |
Performance fee |
15% above benchmark +2% (cap: 1.0% of average net assets) |
|||||||||||||||||||||||||||||||||||||||||||||||||||||||||||||||||||||||||||||||||||||||||||||||||||||||||
Launch date |
April 2010 |
Trust life |
Indefinite |
Phone |
0800 41 41 10 |
|||||||||||||||||||||||||||||||||||||||||||||||||||||||||||||||||||||||||||||||||||||||||||||||||||||||
Continuation vote |
No |
Loan facilities |
US$150m revolving |
Website |
||||||||||||||||||||||||||||||||||||||||||||||||||||||||||||||||||||||||||||||||||||||||||||||||||||||||
Dividend policy and history (financial years) |
Share buyback policy and history (financial years) |
|||||||||||||||||||||||||||||||||||||||||||||||||||||||||||||||||||||||||||||||||||||||||||||||||||||||||||
Although focused on capital growth, as an investment trust FCSS pays out at least 85% of income received as an annual dividend. |
FCSS has annually renewed authority to buy back up 14.99% of its shares at a discount to NAV and allot up to 10% of issued capital at a premium to NAV. There is no rigid discount control mechanism. |
|||||||||||||||||||||||||||||||||||||||||||||||||||||||||||||||||||||||||||||||||||||||||||||||||||||||||||
|
|
|||||||||||||||||||||||||||||||||||||||||||||||||||||||||||||||||||||||||||||||||||||||||||||||||||||||||||
Shareholder base (as at 10 September 2017) |
Portfolio exposure by market cap (as at 31 July 2017) |
|||||||||||||||||||||||||||||||||||||||||||||||||||||||||||||||||||||||||||||||||||||||||||||||||||||||||||
|
|
|||||||||||||||||||||||||||||||||||||||||||||||||||||||||||||||||||||||||||||||||||||||||||||||||||||||||||
Top 10 holdings (as at 31 July 2017) |
||||||||||||||||||||||||||||||||||||||||||||||||||||||||||||||||||||||||||||||||||||||||||||||||||||||||||||
|
||||||||||||||||||||||||||||||||||||||||||||||||||||||||||||||||||||||||||||||||||||||||||||||||||||||||||||
Source: Fidelity China Special Situations, Edison Investment Research, Bloomberg, Morningstar. Note: *Gearing net of short positions. **N/A where not in July 2016 top 10.
Market outlook: Attractive fundamentals
As illustrated in Exhibit 2 (left-hand chart), China’s ‘H’ share market valuation has been relatively stable over the past year and the current 7.2x forward P/E multiple represents a discount of 53.9% to the world market’s 15.6x multiple. This discounted valuation contrasts sharply with Chinese corporate earnings growth prospects, which reflect China’s superior medium-term economic growth projections. Fears over China’s slowing economic growth may be tempered by the recent stability of GDP data, and China’s medium-term GDP growth forecasts remain considerably above projections for advanced economies and other emerging market economies (see Exhibit 2 right-hand chart).
|
Exhibit 2: Market performance and valuation |
|
Datastream China ‘H’ index forward P/E vs World index over five years |
Average % real GDP growth – China vs emerging and advanced economies |
|
|
|
Source: Thomson Datastream, Edison Investment Research, IMF WEO April 2017. Note: Valuation data as at 14 September 2017. |
|
The Chinese stock market can be volatile, as seen in 2015 when there was a 30% correction, triggered by economic slowdown and exacerbated by stock suspensions and forced selling by retail investors funded by margin lending. However, investors with a longer-term view may be attracted by the combination of China’s growth prospects and discounted market valuation. A diversified fund with a bottomup investment approach, focusing on faster growing, consumer-driven segments of the economy, may appeal as a route to gain exposure. The first inclusion of China ‘A’ shares in MSCI emerging markets indices from June 2018 at a 5% partial inclusion factor and the potential for this weighting to increase over the medium term may provide further appeal.
Fund profile: Differentiated Chinese equity exposure
FCSS is an LSE-listed investment trust, which aims to generate long-term capital growth from an actively managed diversified portfolio, primarily comprising companies listed in China or Hong Kong and Chinese companies listed on other recognised exchanges. The portfolio may also include non-Chinese listed companies with significant operations in China and Hong Kong. Performance is benchmarked against the MSCI China index (sterling adjusted), but sector allocations are not constrained by index weightings. FCSS has been managed by Fidelity International since its launch in April 2010, with Dale Nicholls acting as portfolio manager since April 2014. Based in Hong Kong, Nicholls has 23 years’ investment experience and has managed Asian equity portfolios at Fidelity since 2003. As well as FCSS, he currently manages the Fidelity Funds Pacific Fund.
Individual holdings are limited to 15% of the portfolio at the time of investment, with unlisted investments allowed up to 10% in total. Derivatives are used for efficient portfolio management and hedging, with total short exposure restricted to 15% of gross assets. FCSS may borrow up to 25% of net assets, with total gearing from borrowings and derivatives limited to 30% of net assets. FCSS invests in China ‘A’ shares using Fidelity’s Qualified Foreign Institutional Investor (QFII) licence, as well as through brokers who hold a QFII.
The fund manager: Dale Nicholls
The manager’s view: Valuations remain compelling
Nicholls views Chinese stock market valuations as compelling relative to history and other markets, given strong corporate earnings growth prospects, despite the marked rise in P/E and price/book multiples over the last year. He highlights the 15.3% forecast EPS growth for the MSCI China index in 2017 compared to 10.3% for the US S&P 500 index, and notes that forecast EPS growth for the MSCI China index excluding banks is 27.5%. As well as avoiding banks, where Nicholls expects to see earnings growth limited by rising non-performing loan provisions, FCSS has no holdings in the residential property sector, where tightening measures have considerably slowed price growth.
Nicholls maintains a consistent focus on companies with superior long-term growth prospects and has not been distracted by the cyclical stock rally that has seen the MSCI China index outperform FCSS over recent months. However, he notes that the market rally has created opportunities to take short positions, and these are reflected in FCSS’s net gearing declining to 16.6% at end-July 2017, down from 21.1% at end-May 2017. At end-March 2017, index hedges totalled 4.3% of net assets and seven short positions amounted to 2.6%; these have been added to in recent months.
FCSS’s sizeable positions in Tencent and Alibaba contributed strong absolute returns over the last year, although the trust’s underweight exposure in both stocks detracted from relative performance. Nicholls notes that the 2017 market rally has been led by large-cap stocks and FCSS’s bias to small and mid-caps has been a major contributor to recent underperformance of the index. Among the leading contributors to performance versus the index were AIM-listed biopharmaceutical company, Hutchison China MediTech, and car dealership, China MeiDong Auto, which is focused on growing its service business and covers mid- to high-end brands including BMW and Porsche.
While FCSS has achieved a strong NAV total return of c 30% over the last year, Nicholls highlights that performance has been held back by short sellers targeting portfolio holdings CT Environmental and Sinosoft Technology. The Fidelity team’s in-depth analysis supports the manager’s continued confidence in the long-term prospects of both companies, and Nicholls has taken advantage of the share price falls to add to FCSS’s holdings.
Nicholls retains a positive view on the insurance sector, despite recent regulatory scrutiny and concerns over property and casualty business performance, and has added to FCSS’s holding in China Life Insurance, which has moved into the top 10 holdings, alongside China Pacific Insurance. A positive outlook is also maintained for each of FCSS’s four unlisted investments, Didi Chuxing, China Internet Plus, Yiguo and Aurora Mobile, which together account for c 4% of the portfolio.
Asset allocation
Investment process: Consumer-focused, bottom-up selection
FCSS adopts a bottom-up investment approach, seeking to invest primarily in companies operating in industries with above-average growth prospects, which are strongly cash generative and run by capable management teams. There is a bias to mid- and small-caps, where greater opportunity is seen to identify companies with long-term growth potential that is not reflected in their share prices. Companies are analysed in detail prior to investment, with the manager drawing on the resources of Fidelity’s team of 23 analysts researching Chinese equities (based in Hong Kong, Singapore and Shanghai). Small-cap stocks often present higher risks, making risk management an important part of the investment process. Company meetings are a key element in assessing potential new investments as well as monitoring the progress of existing portfolio companies. FCSS typically holds 130-140 stocks and uses futures, options and CFDs, aiming to enhance performance.
Current portfolio positioning
Although comprising over 100 holdings, FCSS’s portfolio is relatively concentrated, with the top 10 positions accounting for 46.2% at end-July 2017, up from 38.0% a year earlier. Sector exposures are highly differentiated from the benchmark index (see Exhibit 3) – a result of the manager’s stock-picking approach and focus on faster growing, consumer-orientated sectors. Information technology has become the largest portfolio exposure over the last 12 months, dominated by top 10 holdings Tencent and Alibaba (see Exhibit 1), although FCSS is underweight in both of these stocks and the sector remains one of the most significant underweight positions. The largest active sector exposures in the portfolio are a 17.4pp overweight in consumer discretionary and a 13.0bp underweight in financials, due to FCSS not holding any Chinese bank stocks.
Exhibit 3: Portfolio sector exposure vs benchmark (% unless stated)
Portfolio end-July 2017 |
Portfolio end-July 2016 |
Change (pp) |
Index weight |
Active weight vs index (pp) |
Trust weight/ index weight (x) |
|
Information technology |
29.2 |
22.8 |
6.4 |
38.8 |
(9.5) |
0.8 |
Consumer discretionary |
27.6 |
28.6 |
(1.0) |
10.2 |
17.4 |
2.7 |
Industrials |
12.6 |
13.9 |
(1.3) |
4.7 |
7.9 |
2.7 |
Financials |
10.5 |
10.6 |
(0.0) |
23.5 |
(13.0) |
0.4 |
Consumer staples |
6.8 |
7.8 |
(1.0) |
1.7 |
5.1 |
4.0 |
Healthcare |
5.0 |
3.6 |
1.4 |
1.9 |
3.1 |
2.6 |
Energy |
2.5 |
3.6 |
(1.1) |
4.9 |
(2.4) |
0.5 |
Utilities |
1.8 |
2.2 |
(0.4) |
2.5 |
(0.7) |
0.7 |
Telecommunication services |
1.5 |
3.0 |
(1.5) |
5.9 |
(4.4) |
0.3 |
Materials |
1.4 |
3.9 |
(2.5) |
1.2 |
0.2 |
1.2 |
Real estate* |
1.0 |
N/A |
N/A |
4.7 |
(3.7) |
0.2 |
100.0 |
100.0 |
100.0 |
Source: Fidelity China Special Situations, Edison Investment Research. Note: *Real estate classified within financials sector in July 2016.
Performance: Strong absolute returns over five years
As illustrated in Exhibit 4, while FCSS underperformed its MSCI China benchmark over one year, it achieved a strong 29.4% absolute return over this period and has also delivered annual returns of more than 25% over three and five years, significantly outperforming the benchmark over these longer periods. A large part of the underperformance over one year has occurred during the last three months, which the manager attributes to a rally in cyclical stocks triggered by inflation returning after a deflationary period during the first half of 2017. This rally has seen the MSCI China Small Cap index underperform the MSCI China index by c 18% in 2017 to end-August. FCSS’s portfolio has a bias to small and mid-caps and provides highly differentiated exposure versus the benchmark (see Exhibit 3), therefore periods of diverging performance should be expected.
|
Exhibit 4: Investment trust performance to 31 August 2017 |
||||||||
Price, NAV and benchmark total return performance, one-year rebased |
Price, NAV and benchmark total return performance (%) |
|||||||
|
|
|||||||
|
Source: Thomson Datastream, Edison Investment Research. Note: Three-year, five-year and SI (since inception) performance figures annualised. Inception date is 16 April 2010. |
||||||||
|
Exhibit 5: Share price and NAV total return performance, relative to indices (%) |
||||||||
|
One month |
Three months |
Six months |
One year |
Three years |
Five years |
SI |
|
Price relative to MSCI China |
(3.3) |
(3.2) |
(1.3) |
(1.7) |
18.7 |
50.3 |
28.7 |
|
NAV relative to MSCI China |
(2.4) |
(4.8) |
(3.3) |
(5.9) |
19.4 |
63.8 |
44.5 |
|
Price relative to MSCI World |
0.6 |
9.2 |
17.2 |
13.8 |
30.7 |
54.9 |
3.8 |
|
NAV relative to MSCI World |
1.6 |
7.4 |
14.8 |
9.0 |
31.4 |
68.9 |
16.5 |
|
Price relative to FTSE All-Share |
1.7 |
12.7 |
16.2 |
18.2 |
63.2 |
103.1 |
34.9 |
|
NAV relative to FTSE All-Share |
2.7 |
10.8 |
13.8 |
13.2 |
64.1 |
121.5 |
51.4 |
|
|
Source: Thomson Datastream, Edison Investment Research. Note: Data to end-August 2017. Geometric calculation. |
||||||||
Exhibit 5 shows that FCSS’s share price and NAV total return has outperformed the MSCI World and FTSE All-Share indices over one, three and five years, and since the trust’s inception in April 2010, helped by notably strong relative performance over six months. Exhibit 6 puts the recent underperformance of the benchmark in context relative to the strong outperformance from end-2013 to mid-2016.
|
Exhibit 6: NAV total return performance relative to benchmark since launch |
|
|
Source: Thomson Datastream, Edison Investment Research |
Discount: Narrowing trend established
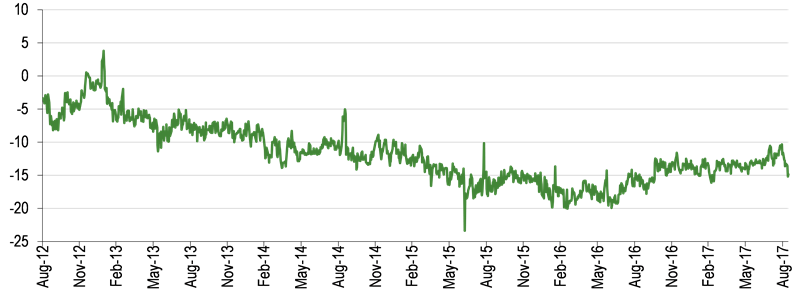
As illustrated in Exhibit 7, having gradually widened from a three-year low of 5.0% in September 2014, FCSS’s share price discount to NAV including income has established a narrowing trend over the last year, moving from 19.5% in July 2016 to its current level of 14.9%. The current discount is similar to its 14.5% three-year average but wider than its 13.7% and 11.8% one- and five-year averages. Since launch in 2010, FCSS shares have traded between a 13.2% premium and a 23.4% discount, suggesting significant scope for the discount to narrow further should investor sentiment towards Chinese equities continue to improve.
|
Exhibit 7: Share price discount/premium to NAV (including income) over five years (%) |
|
|
Source: Thomson Datastream, Edison Investment Research |
Capital structure and fees
FCSS is a conventional investment trust with a single share class and currently has 551.9m ordinary shares in issue, with a further 19.4m shares held in treasury. In February 2017, a new US$150m three-year revolving credit facility was agreed with Scotiabank Europe, and this is fully drawn down, equating to c 8% gearing. Further gearing is added using contracts for difference (CFDs) on a number of portfolio holdings, and FCSS had 24.8% gross gearing at end-July 2017, which compares to the 30% maximum permitted level.
FCSS pays management fees to its investment manager, Fidelity International, at an annual rate of 1.0% of net assets, calculated monthly (quarterly before April 2016). An annual performance fee of 15% is payable on returns more than 2.0% above the benchmark, capped at 1.0% of average net assets. Excess outperformance is not carried forward but underperformance must be recovered before any further performance fee is payable. For FY17 (to 31 March 2017), the ongoing charge (excluding performance fees) was 1.16%, slightly lower than 1.20% in FY16.
From launch, FCSS allocated management fees and finance costs equally between revenue and capital. However, capital gains have contributed the bulk of returns and this is expected to continue, leading the board to move to a 75:25 allocation of these expenses between capital and revenue, with effect from 1 April 2017. Total returns will not be affected by this change, but the proportion of revenue returns will be higher in future years, thereby increasing dividend distributions.
Dividend policy and record
Although FCSS has a capital growth objective, as an investment trust it pays out at least 85% of its revenue earnings and the annual dividend has increased every year since 2011 (see Exhibit 1). Over the last five years, the compound annual growth in the dividend is c 27%. The 2017 dividend was increased by 38.9%, a similar increase to the previous year, and the 2.50p dividend paid in July 2017 represents a 1.2% dividend yield. The 2017 dividend was 1.17x covered and FCSS has accumulated revenue reserves equating to 1.75p per share. The change in allocation of fees and expenses between revenue and capital accounts – noted above – will result in a relative increase in the level of future dividend distributions.
Peer group comparison
Exhibit 8 shows a comparison of FCSS with other funds investing in Chinese equities. JPMorgan Chinese is the only other AIC Country Specialists: Asia Pacific fund that focuses on Chinese equities, so we show averages for the AIC Asia Pacific ex-Japan sector, which has 37% aggregate exposure to China & Greater China, giving it greater relevance. We also include open-ended funds larger than £250m from the IA China/Greater China sector. Over one year, FCSS’s NAV total return is ahead of the Asia Pacific ex-Japan weighted average but lower than JPMorgan Chinese and the IA China/Greater China sector average. However, over three and five years, FCSS leads all the funds shown by a significant margin, with its NAV total return considerably ahead of both open- and closed-ended peer group averages. FCSS’s ongoing charge is similar to the AIC Asia Pacific ex-Japan sector average and appreciably lower than the IA China/Greater China sector average. FCSS employs higher than average gearing among closed-ended peers and, while its share price discount to NAV is above the Asia Pacific ex-Japan average, it is only modestly wider than the 12.2% weighted average of the AIC Country Specialists: Asia Pacific sector. FCSS’s dividend yield is below average among closed-ended peers, but higher than the average of its open-ended peers.
Exhibit 8: Funds investing in Chinese equities (as at 14 September 2017*)
% unless stated |
Market cap/ |
NAV TR |
NAV TR |
NAV TR |
Discount (ex-par) |
Ongoing charge |
Performance fee |
Net |
Dividend yield (%) |
Fidelity China Special Situations |
1,192.1 |
27.1 |
100.2 |
254.6 |
(13.4) |
1.16 |
Yes |
117 |
1.2 |
JPMorgan Chinese |
199.2 |
36.4 |
69.0 |
137.2 |
(12.8) |
1.44 |
No |
109 |
0.6 |
Asia Pacific ex-Japan weighted avg |
22.7 |
44.7 |
82.6 |
(6.1) |
1.12 |
104 |
2.2 |
||
Open-ended funds |
|||||||||
Aberdeen Global Chinese Equity |
463.4 |
19.3 |
29.1 |
44.9 |
1.99 |
No |
0.0 |
||
Allianz China Equity |
345.0 |
22.1 |
54.0 |
93.7 |
2.29 |
No |
1.3 |
||
Baring Hong Kong China |
1,524.0 |
28.9 |
59.4 |
99.7 |
1.70 |
No |
0.2 |
||
Fidelity China Focus |
3,205.1 |
29.4 |
78.6 |
130.4 |
1.91 |
No |
0.5 |
||
First State Greater China Growth |
446.9 |
23.6 |
48.5 |
95.4 |
1.84 |
No |
0.9 |
||
GAM Star China Equity |
730.7 |
28.9 |
50.6 |
119.5 |
1.09 |
No |
0.9 |
||
Henderson China Opportunities |
879.3 |
30.4 |
73.5 |
146.6 |
1.74 |
No |
0.0 |
||
HSBC GIF Chinese Equity |
1,238.1 |
33.1 |
69.1 |
111.0 |
2.40 |
No |
0.0 |
||
Invesco PRC Equity |
585.1 |
32.2 |
65.4 |
112.5 |
3.12 |
No |
0.0 |
||
Invesco Perpetual HK & China |
356.1 |
28.8 |
52.4 |
137.5 |
1.69 |
No |
0.5 |
||
JPM Greater China |
406.3 |
30.0 |
61.9 |
117.0 |
1.82 |
No |
1.3 |
||
Neuberger Berman China Equity |
902.5 |
37.5 |
|
|
2.12 |
No |
0.0 |
||
Schroder ISF Greater China |
778.5 |
31.3 |
72.6 |
122.9 |
1.87 |
No |
1.6 |
||
Templeton China |
428.9 |
29.0 |
46.0 |
65.0 |
2.47 |
No |
0.0 |
||
Open-ended funds weighted avg |
29.8 |
65.1 |
114.6 |
1.96 |
0.6 |
Source: Morningstar, Edison Investment Research. Note: *Performance data to 13 September 2017. TR = total return. Net gearing is total assets less cash and equivalents as a percentage of net assets (100 = ungeared).
The board
FCSS’s board comprises six directors, five of whom are independent of the manager. Nicholas Bull joined the board in February 2010 and assumed the role of chairman in July 2016. Elisabeth Scott (appointed November 2011) has acted as senior independent director since July 2016. The other three independent directors are David Causer (appointed February 2010), Peter Pleydell-Bouverie (appointed February 2010) and Vera Hong Wei (appointed March 2016). John Ford (appointed July 2016) is Fidelity International’s global chief investment officer, fixed income, solutions and real estate, and is therefore considered to be a non-independent director.
|
|
Investment Companies
Avon Rubber’s pre-close has confirmed that the group will meet market expectations and that performance in H217 has continued apace. With positive mix effects in Protection & Defence and continued strengthening in Dairy, we believe that the eventual revenue and margin mix may alter slightly but that our profit levels will be achieved. With CEO Paul McDonald signalling continued confidence into 2018 and with further medium-term product developments to come through in both divisions, we continue to view Avon as delivering in the short and medium term.