Last close As at 05/08/2026
CAD172.48
▲ 10.06 (6.19%)
Market capitalisation
CAD78,334m
Research: Metals & Mining
Wheaton’s (WPM’s) Q124 results exceeded both our and the market’s forecasts. It produced more (with the single exception of gold, which recorded a small negative variance in production) and sold more at higher prices than our prior expectations for the period. This led to a positive 5.6% (US$15.8m) variance in sales that was minimally counteracted by a US$0.8m negative variance in costs (including G&A costs) to result in a US$15.3m (10.3%) positive variance in pre-tax profits that, to all intents and purposes, fell straight through to the bottom line.
Wheaton Precious Metals |
A strong start to FY24 |
Q124 results |
Metals and mining |
13 May 2024 |
Share price performance
Business description
Next events
Analyst
Wheaton Precious Metals is a research client of Edison Investment Research Limited |
|||||||||||||||||||||||||||||||||||||||||||||||||||
Wheaton’s (WPM’s) Q124 results exceeded both our and the market’s forecasts. It produced more (with the single exception of gold, which recorded a small negative variance in production) and sold more at higher prices than our prior expectations for the period. This led to a positive 5.6% (US$15.8m) variance in sales that was minimally counteracted by a US$0.8m negative variance in costs (including G&A costs) to result in a US$15.3m (10.3%) positive variance in pre-tax profits that, to all intents and purposes, fell straight through to the bottom line.
Year end |
Revenue |
PBT* |
EPS* |
DPS |
P/E |
Yield |
12/22 |
1,065.1 |
505.4 |
112 |
60 |
49.9 |
1.1 |
12/23 |
1,016.0 |
533.4 |
118 |
60 |
47.3 |
1.1 |
12/24e |
1,251.8 |
712.1 |
132 |
62 |
42.2 |
1.1 |
12/25e |
1,427.1 |
711.0 |
135 |
68 |
41.4 |
1.2 |
Note: *PBT and EPS are normalised, excluding amortisation of acquired intangibles and exceptional items.
FY24 marks the start of a multi-year growth profile
Stillwater, Penasquito, Antamina, Los Filos, Neves-Corvo, Voisey’s Bay and Constancia, in particular, all outperformed our sales expectations. Salobo outperformed our slightly conservative production expectations by 4.0% (or 2,381oz Au) and our sales expectations by 3.5% (or 1,932oz). Coupled with recent moves in precious metals prices, this means that we are now forecasting double-digit EPS growth in FY24 (cf flat previously). Thereafter, we continue to forecast new production from Goose, Platreef and Blackwater in late-FY24 or early FY25, to be followed by production from Curipamba in FY26, Curraghinalt and KZK in FY27 and Cangrejos in FY29, with additional potential from Kutcho, Fenix, Toroparu and Wheaton’s other royalty interests that has yet to be fully incorporated into our financial model. As such, we expect production to grow by 51.2% from an anticipated 591.6k gold equivalent ounces (GEOs) in FY24e to 894.4koz in FY29e.
Valuation: Steady on conservative assumptions
Using a capital asset pricing model (CAPM) type method, whereby we discount cash flows at a nominal 9% per year, our ‘terminal’ valuation of WPM has increased to US$57.89 (C$79.19) in FY27, from US$52.96 per share in FY26 previously, assuming zero subsequent long-term growth in real cash flows (which we think unlikely). If we instead assume 7.4% pa long-term growth in cash flows however (ie the average compound annual growth rate in the price of gold from 1967 to 2023), our current valuation of WPM increases manyfold to US$138.94/share, or C$190.06/share. As such, at an implied rate of 5.0% per annum, Wheaton’s current share price appears to be discounting future compound annual average increases in cash flows per share from FY27 only very fractionally in excess of the long-term average rate of US dollar inflation of 4.0%. Alternatively, assuming no purchases of additional streams, we calculate a value per share for WPM of US$54.75 or C$74.89 or £43.72 in FY27, based on a historical multiple of 30.8x contemporary earnings. In the meantime, we suspect that the market has yet to fully factor in the company’s expectation that it will increase its production from c 550–620koz GEO in FY24 to in excess of 850koz GEO by FY29 (all other things being equal).
Q124 results
Wheaton’s Q124 results were released after the market close on 9 May and exceeded our forecasts, which were already at the top of the market range. In general, Wheaton produced more (with the single exception of gold, which recorded a small negative variance) and sold more at higher prices than our prior expectations for the three-month period. This resulted in a positive 5.6% (US$15.8m) variance in sales that was minimally counteracted by a US$0.8m negative variance in costs (including general & administrative costs). Other income (largely interest earned) was also US$0.4m higher, which resulted in a US$15.3m (10.3%) positive variance in profits at the pre-tax level that, to all intents and purposes, fell straight through to the bottom line. Exhibit 1, below, provides a full analysis of WPM’s results with respect to both the prior quarter and our prior expectations:
Exhibit 1: WPM Q124 actual compared to prior forecasts*
US$000s |
Q422 |
Q123 |
Q223 |
Q323 |
Q423 |
Q124e |
Q124 |
****Change |
*****Variance (%) |
Silver production (koz) |
5,352 |
4,927 |
4,417 |
3,363 |
4,208 |
4,690 |
5,476 |
30.1 |
16.8 |
Gold production (oz) |
70,099 |
73,037 |
85,083 |
105,436 |
113,359 |
95,932 |
93,370 |
-17.6 |
-2.7 |
Palladium production (oz) |
3,869 |
3,705 |
3,880 |
4,006 |
4,209 |
4,209 |
4,463 |
6.0 |
6.0 |
Cobalt production (klb) |
128 |
124 |
152 |
183 |
215 |
214 |
240 |
11.6 |
12.1 |
Silver sales (koz) |
4,935 |
3,749 |
4,437 |
2,965 |
3,175 |
3,985 |
4,067 |
28.1 |
2.1 |
Gold sales (oz) |
68,996 |
62,605 |
75,294 |
74,426 |
115,011 |
88,899 |
92,019 |
-20.0 |
3.5 |
Palladium sales (oz) |
3,396 |
2,946 |
3,392 |
4,242 |
3,339 |
3,786 |
4,774 |
43.0 |
26.1 |
Cobalt sales (klb) |
187 |
323 |
265 |
198 |
288 |
214 |
309 |
7.3 |
44.4 |
Average realised Ag price (US$/oz) |
21.52 |
22.85 |
24.13 |
23.73 |
23.77 |
23.42 |
23.77 |
0.0 |
1.5 |
Average realised Au price (US$/oz) |
1,725 |
1,904 |
1,986 |
1,944 |
2,006 |
2,038 |
2,072 |
3.3 |
1.7 |
Average realised Pd price (US$/oz) |
1,939 |
1,607 |
1,438 |
1,251 |
1,070 |
976 |
980 |
-8.4 |
0.4 |
Average realised Co price (US$/lb) |
22.62 |
15.04 |
13.23 |
13.87 |
12.92 |
13.06 |
15.49 |
19.9 |
18.6 |
|
|||||||||
Average Ag cash cost (US$/oz) |
5.00 |
5.07 |
5.01 |
5.10 |
5.02 |
4.86 |
4.77 |
-5.0 |
-1.9 |
Average Au cash cost (US$/oz) |
475 |
496 |
461 |
444 |
437 |
443 |
439 |
0.5 |
-0.9 |
Average Pd cash cost (US$/oz) |
357 |
294 |
261 |
223 |
198 |
176 |
182 |
-8.1 |
3.4 |
Average Co cash cost (US$/lb)*** |
16.52 |
3.30 |
3.20 |
2.66 |
3.14 |
2.35 |
2.96 |
-5.7 |
26.0 |
|
|||||||||
Sales |
236,051 |
214,465 |
264,972 |
223,137 |
313,471 |
281,005 |
296,806 |
-5.3 |
5.6 |
Cost of sales |
|
||||||||
Cost of sales, excluding depletion |
61,730 |
51,964 |
58,642 |
49,808 |
67,757 |
59,943 |
61,555 |
-9.2 |
2.7 |
Depletion |
53,140 |
45,000 |
54,474 |
46,435 |
68,525 |
61,585 |
63,676 |
-7.1 |
3.4 |
Total cost of sales |
114,870 |
96,964 |
113,116 |
96,243 |
136,282 |
121,527 |
125,231 |
-8.1 |
3.0 |
Earnings from operations |
121,181 |
117,501 |
151,856 |
126,894 |
177,189 |
159,477 |
171,575 |
-3.2 |
7.6 |
Expenses and other income |
|
||||||||
– General and administrative** |
19,773 |
18,874 |
16,640 |
14,678 |
17,978 |
16,240 |
13,315 |
-25.9 |
-18.0 |
– Foreign exchange (gain)/loss |
|||||||||
– Interest paid |
1,377 |
1,378 |
1,352 |
1,407 |
1,373 |
1,378 |
1,442 |
5.0 |
4.6 |
– Other (income)/expense |
(3,935) |
(7,387) |
(8,811) |
(10,688) |
(6,772) |
(6,471) |
(6,840) |
1.0 |
5.7 |
Total expenses and other income |
17,215 |
12,865 |
9,182 |
5,397 |
12,579 |
11,146 |
7,917 |
-37.1 |
-29.0 |
Earnings before income taxes |
103,966 |
104,636 |
142,675 |
121,497 |
164,610 |
148,331 |
163,658 |
-0.6 |
10.3 |
Income tax expense/(recovery) |
222 |
205 |
91 |
30 |
41 |
84 |
69 |
68.3 |
-17.9 |
Marginal tax rate (%) |
0.2 |
0.2 |
0.1 |
0.0 |
0.0 |
0.1 |
0.0 |
N/A |
-57.8 |
Net earnings |
103,744 |
104,431 |
142,584 |
121,467 |
164,569 |
148,247 |
163,589 |
-0.6 |
10.3 |
Average no. shares in issue (000s) |
452,070 |
452,370 |
452,892 |
452,975 |
453,010 |
453,010 |
453,094 |
0.0 |
0.0 |
Basic EPS (US$) |
0.229 |
0.231 |
0.315 |
0.268 |
0.363 |
0.327 |
0.361 |
-0.6 |
10.4 |
Diluted EPS (US$) |
0.229 |
0.230 |
0.314 |
0.268 |
0.363 |
0.327 |
0.361 |
-0.6 |
10.4 |
DPS (US$) |
0.15 |
0.15 |
0.15 |
0.15 |
0.15 |
0.155 |
0.155 |
3.3 |
0.0 |
Source: Wheaton Precious Metals, Edison Investment Research. Note: *Excluding impairments, impairment reversals and exceptional items (unless otherwise indicated). **Forecasts include stock-based compensation costs. ***Cobalt inventory is held on WPM’s balance sheet at the lower of cost and net realisable value; cash costs per pound of cobalt sold are therefore affected by changes in the valuation of inventory quarterly. ****Change is Q124 cf Q423. *****Variance is Q124 cf Q124e. Totals may not add up owing to rounding.
As a consequence, Wheaton’s actual EPS was 10.4% above our expectations – which were already at the top of the market range – and 24.5% above the market consensus immediately before the results were announced:
Exhibit 2: WPM Q124 prior EPS forecasts compared to actual (US$/share)
Q124e |
Q124 |
Variance (%) |
|
Edison forecasts |
0.327 |
0.361 |
+10.4 |
Mean consensus |
0.29 |
0.361 |
+24.5 |
High consensus |
0.33 |
0.361 |
+9.4 |
Low consensus |
0.25 |
0.361 |
+44.4 |
Source: Refinitiv, Edison Investment Research. Note: As at 8 May 2024.
At the level of the individual mines, Constancia, Stillwater, Penasquito, Antamina, Los Filos, Neves-Corvo and Voisey’s Bay all outperformed our expectations in terms of sales, while San Dimas (unusually) slightly underperformed. Salobo outperformed our slightly conservative production expectations by 4.0% (or 2,381oz Au) and our sales expectations by 3.5% (or 1,932oz) in a performance that was nevertheless consistent with the amount of copper that it produced during the period:
|
Exhibit 3: Salobo copper production versus gold production attributable to WPM, Q316–Q124 |
Exhibit 4: Gold production attributable to WPM from Salobo, Q412–Q424e |
|
|
|
Source: Wheaton Precious Metals, Edison Investment Research |
Source: Wheaton Precious Metals, Vale, Edison Investment Research |
|
Exhibit 3: Salobo copper production versus gold production attributable to WPM, Q316–Q124 |
|
|
Source: Wheaton Precious Metals, Edison Investment Research |
|
Exhibit 4: Gold production attributable to WPM from Salobo, Q412–Q424e |
|
|
Source: Wheaton Precious Metals, Vale, Edison Investment Research |
Also shown in Exhibit 4 is our forecast quarterly production of gold attributable to WPM from Salobo in Q2–Q424 in the light of the company’s guidance.
Ounces produced but not yet delivered
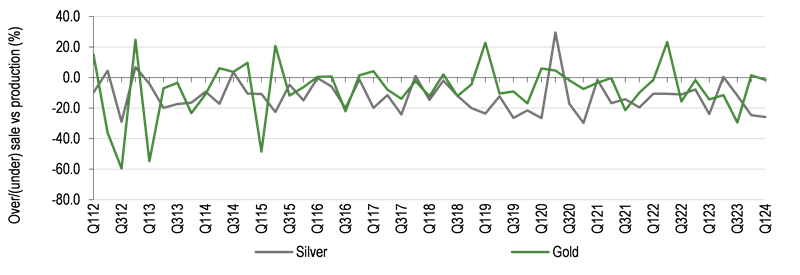
Silver sales were 1.4Moz, or 25.7%, below production, which compares with a long-term average under-sales rate of 12.1% (±11.0%). This is towards the top end of the typical range and the second quarter in succession in which sales have under-shot production by this order of magnitude. By contrast, gold sales were closely aligned with production, compared to a long-term average rate of under-sales of 7.1% per quarter (±17.6%). In this case, almost all of the relative gold sales outperformance could be attributed to Constancia, which sold 6,226oz (or 44.8%) more gold than it produced and without which Wheaton would have recorded an 8.1% (or 7,577oz) gold under-sale relative to production during the period. By contrast, Salobo’s sales were within 7.8% of production.
|
Exhibit 5: Over/(under) sale of silver and gold as a percentage of production, Q112–Q124 |
|
|
Source: Edison Investment Research, Wheaton Precious Metals. Note: As reported. |
As a result, silver ounces produced but not yet delivered (PBND) to Wheaton increased to 2.3Moz and now equate to 1.29 months of Edison’s forecast FY24 production level (cf 1.29 months of FY23 production at the end of Q423) – albeit this is still below Wheaton’s target level of two months for silver production. By contrast, gold ounces PBND decreased to 87,542oz, or 3.02 months of estimated FY24 production (cf a reported 3.18 months at the end of FY23), which compares with WPM’s target levels of two to three months of PBND for gold and palladium production.
|
Exhibit 6: WPM ounces produced but not yet delivered, Q316–Q124 (months of production) |
|
|
Source: Edison Investment Research, Wheaton Precious Metals. Note: As reported. |
General and administrative expenses
At the time of its Q423 results, WPM provided guidance for non-stock general and administrative (G&A) expenses of US$41–45m, or US$10.25–11.25m per quarter, for FY24, which represents a decline relative to US$47–50m in FY23 and US$47–49m in FY22 and on a par with guidance of US$42–44m for FY21 and US$40–43m for FY20.
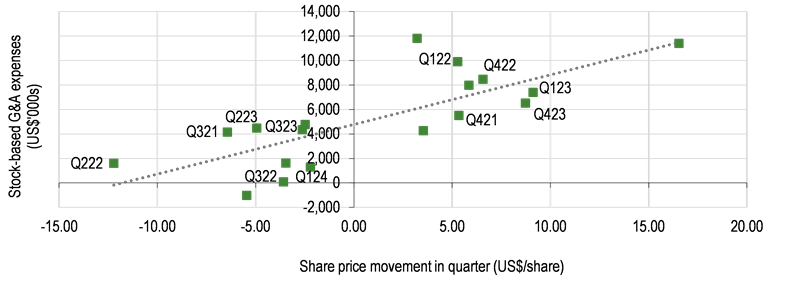
Given WPM’s share price as at the date of our last note (18 March), we forecast that the total G&A charge for WPM in Q1 would be US$16.2m, of which 80% would have been attributable to non-stock-based G&A expenses and 20% to stock-based expenses. In the event, non-stock based G&A expenses were US$1.0m less than our forecast, while stock-based G&A expenses were US$2.0m lower (albeit still within the US$2.5m error of estimation implied by the regression analysis between the two – see Exhibit 8, below), leading to a US$2.9m saving in total G&A expenses for the quarter relative to our prior expectations.
Exhibit 7: WPM general and administrative expenses, Q421–Q124 (US$000s)
Item |
Q122 |
Q222 |
Q322 |
Q422 |
Q123 |
Q223 |
Q323 |
Q423 |
Q124e |
Q124 |
G&A salaries excluding PSU and equity settled stock-based compensation |
5,345 |
5,061 |
4,629 |
4,187 |
5,021 |
4,749 |
4,591 |
4,051 |
5,365 |
|
Other (inc. depreciation, donations and professional fees) |
4,871 |
5,784 |
5,137 |
7,112 |
6,456 |
7,407 |
5,751 |
7,401 |
6,669 |
|
Non-stock based G&A |
10,216 |
10,845 |
9,766 |
11,299 |
11,477 |
12,156 |
10,342 |
11,452 |
13,000 |
12,034 |
Guidance |
11,750–12,250 |
11,750–12,250 |
11,750–12,250 |
11,750–12,250 |
11,750–12,500 |
11,750–12,500 |
11,750–12,500 |
11,750–12,500 |
10,250-11,250 |
10,250-11,250 |
PSU accrual |
8,560 |
110 |
(1,491) |
7,035 |
5,855 |
2,625 |
2,604 |
5,222 |
(317) |
|
Equity settled stock-based compensation |
1,342 |
1,498 |
1,568 |
1,439 |
1,542 |
1,859 |
1,732 |
1,305 |
1,598 |
|
Stock-based G&A |
9,902 |
1,608 |
77 |
8,474 |
7,397 |
4,484 |
4,336 |
6,527 |
3,240 |
1,281 |
Total general & administrative |
20,118 |
12,453 |
9,843 |
19,773 |
18,874 |
16,640 |
14,678 |
17,979 |
16,240 |
13,315 |
Non-stock as pct of total G&A (%) |
50.8 |
87.1 |
99.2 |
57.1 |
60.8 |
73.1 |
70.5 |
63.7 |
80.0 |
90.4 |
Source: Wheaton Precious Metals, Edison Investment Research. Note: Totals may not add up owing to rounding.
The extent to which stock-based G&A expenses were lower than we expected is clearly visible in Exhibit 8, below, given the movement in WPM’s share price in the quarter (in US dollar terms). Nevertheless, as at the end of Q124, the analysis of stock-based G&A expenses relative to the change in WPM’s share price over the previous 18 quarters continues to exhibit a close Pearson product moment (correlation) coefficient of 0.77, which can be said to be statistically significant at the 5% level for a directional hypothesis (ie there is less than a 5% probability that this relationship occurred by random chance).
|
Exhibit 8: Graph of historical share price change (US$/share) versus stock-based G&A expenses (US$000s), quarterly, Q419–Q124 |
|
|
Source: Edison Investment Research (underlying data: Bloomberg and Wheaton Precious Metals) |
FY24 and future guidance
WPM provided detailed production guidance for FY24 and beyond on 20 February, at the same time as releasing its FY23 sales and production numbers. This guidance is summarised below relative to Edison’s updated FY24 forecasts in the light of Q1 results:
Exhibit 9: WPM precious metals production – Edison forecasts compared to guidance
FY24e |
FY28e |
FY29–33 |
|
Prior Edison forecast |
|||
Silver production (Moz) |
20.0 |
||
Gold production (koz) |
370.0 |
||
Cobalt production (klb) |
856 |
||
Palladium production (koz) |
16.8 |
||
Gold equivalent (koz) |
613.9 |
806 |
835 |
Current Edison forecast |
|||
Silver production (Moz) |
19.9 |
||
Gold production (koz) |
348.4 |
||
Cobalt production (klb) |
882 |
||
Palladium production (koz) |
17.1 |
||
Gold equivalent (koz) |
591.6 |
816 |
849 |
WPM guidance |
|||
Silver production (Moz) |
18.5–20.5 |
||
Gold production (koz) |
325–370 |
||
Cobalt & palladium production (koz AuE) |
12–15 |
||
Gold equivalent (koz) |
550–620 |
>800 |
>850 |
Source: Wheaton Precious Metals, Edison Investment Research forecasts. Note: *Edison forecasts include Antamina extension from FY28.
Relative to our prior production forecasts, the main change to our FY24 numbers has been to assume a U-shaped production profile at Constancia over the course of the year to reflect anticipated patterns of high- and low-grade ore blending through the plant and therefore lower production attributable to Wheaton in Q2 and Q3 and a more slowly rising production profile at Antamina after it mined lower grades in Q1. In the longer term, relative to our last note, we have assumed that the start of production at Marathon will be delayed until late FY26 and the start of production at Santo Domingo until FY27. However, we are continuing to forecast that production will commence at Goose, Platreef and Blackwater in late-FY24 or early FY25, to be followed by production from Curipamba in FY26, Curraghinalt and KZK in FY27 and Cangrejos in FY29.
A brief summary of recent developments at WPM’s principal near-term development projects is as follows:
■
Blackwater: on 21 February, Artemis announced the results of an expansion study to optimise the timing of mine expansion by the advancement of Phase 2 at Blackwater and a final investment decision on the acceleration of the Phase 2 expansion is now expected in H224. In the meantime, on 24 April, Artemis announced that overall construction at Blackwater was c 73% complete and that construction of major site water management facilities, including the water management pond, the central diversion system and the Davidson Creek diversion, have been completed along with work on the tailings storage facility, which is progressing well. Artemis also stated that the project’s first gold pour remains on schedule for H224.
■
Platreef: on 30 April, Ivanhoe reported that construction activities for the Platreef Phase 1 concentrator are on schedule at almost 90% complete and on track for cold commissioning in Q324. An updated independent feasibility study on an optimised development plan for the acceleration of Phase 2 is planned to be completed and published in Q424. As a result of the planned acceleration of Phase 2, first feed and the ramp-up of production will be deferred until mid-2025. In addition, a preliminary economic assessment on a Phase 3 expansion is expected to be completed at the same time, increasing Platreef’s processing capacity up to c 10Mtpa, which would rank it as one of the world’s largest platinum group metal producers.
■
Goose Project: on 7 May, B2Gold announced the successful completion of the 2024 winter ice road campaign, delivering all necessary materials to complete the construction of the Goose project. B2Gold reports that, while mill construction remains on schedule, development of the open pit and underground is slightly behind owing to equipment availability, adverse weather conditions and the prioritisation of critical path construction activities. As a result, B2Gold reports that Goose’s first gold pour is now expected in Q225 with ramp up to full production in Q325, one quarter later than previously anticipated.
■
Marmato: on 15 April, Aris provided an update to the effect that the access road to the new processing facility area at the Marmato Lower Mine expansion project is now complete and earthworks in the plant area will commence soon. The contractor for the new portal and decline is reported to be fully mobilised and cutting of the portal face to have commenced.
■
Curipamba: on 22 January, Adventus announced that the Ministry of Environment, Water and Energy Transition of the Government of Ecuador had granted the environmental licence for the construction and operation of the El Domo–Curipamba project and on 30 January that the Ministry of Energy and Mines had issued a permit that grants approval for the design, construction, operation and maintenance of the tailings storage facility (TSF) for the project, which is a key condition precedent for Wheaton to make additional upfront cash payments under the Curipamba Precious Metals Purchase Agreement (PMPA). Subsequently, on 26 April, Adventus announced that Silvercorp had agreed to acquire Adventus. As reported by Silvercorp, the existing stream with Wheaton, combined with Silvercorp’s existing cash and cash equivalents of c US$200m is now more than sufficient to fully fund the Curipamba project through to production.
■
Fenix: on 8 April, Rio2 announced that its Chilean subsidiary had received the formal Environmental Qualification Resolution (RCA) for the Fenix gold project, which now allows it to advance permitting activities. There are four principal Sectorial Permits required before construction can commence, namely 1) Mining Methods, 2) Process Plant, 3) Waste Dumps & Stockpiles and 4) Closure Plan, and work on all of these is reported to be ‘well underway’. Rio2 notes that the current timing for receipt of these principal permits is by the end of July 2024.
■
Cangrejos: on 18 January, Lumina announced results from the Phase 1 mining resource conversion drilling campaign in support of its ongoing feasibility study at Cangrejos. Lumina noted that the assays from the resource infill program continue to demonstrate exceptional continuity of grade. It also noted that it is operating normally at the Cangrejos project and that, to date, its activities have not been affected by the recent civil disturbances in Ecuador.
■
Curraghinalt: subsequent to the quarter, the Planning Appeals Commission and Water Appeals Commission in Northern Ireland concluded that the water abstraction and impoundment licences relative to the Curraghinalt Project have been rescinded and that licence applications would need to be resubmitted and subsequent public inquiry referrals held. The commission noted that it has suspended arrangements for the current inquiry timetable until it is in receipt of the expected applications, at which time it will move to set directions and new dates for the submission of statements of case and rebuttals and for the opening of the re-scheduled hearing sessions in due course.
WPM’s guidance for FY24 and beyond is based on standardised pricing assumptions of US$2,000/oz gold, US$23.00/oz silver, US$1,000/oz palladium, US$1,000/oz platinum and US$13.00/lb cobalt. Of note is the implied gold/silver ratio of 87.0x, which compares with the current ratio of 83.0x (after a notably more significant move in the silver price than in the gold price over FY24 to date), but a longer-term average of 60.1x since gold was demonetised in August 1971. At the updated standardised prices indicated, our production forecast of 591.6koz gold equivalent (AuE) for FY24 is towards the middle of WPM’s guidance range of 550–620koz AuE, although our gold equivalent sales forecast of 544.5koz is more conservative (see Exhibit 10).
Otherwise, readers will note that our longer-term production forecasts are very close to WPM’s guidance for the period FY29–33. However, at the moment, these exclude any contribution from either Kutcho or Fenix (together capable of adding c 29k GEOs to production) or Toroparu or WPM’s royalty interests. Note that both our, and WPM’s, estimates necessarily exclude potential future stream acquisitions (of which we expect there to be a number, given the time horizon involved).
FY24 guidance and forecasts
In the light of Q124 results, we have updated our FY24 forecasts to those shown in Exhibit 10. Relative to our earlier numbers, the main changes in our estimates reflect the changes in anticipated mine production previously discussed, updated metals prices and lower ‘other’ income to reflect less interest earned on lower cash balances throughout the year, after a large proportion of FY24’s anticipated PMPA investments were made in Q1. As before, we also assume the imposition of global minimum tax (GMT – see our note, dated 11 March 2024) from Q224. In line with WPM’s Q423/FY23 results announcement, we have also assumed higher quarterly dividend payments throughout the year than in FY23, to reflect WPM’s new, progressive dividend policy.
Exhibit 10: WPM FY24e forecast, by quarter*
US$000s |
Q124 |
Q224e (prior) |
Q224e (current) |
Q324e (prior) |
Q324 (current) |
Q424e (prior) |
Q424e (current) |
FY24e |
FY24e (prior) |
Silver production (koz) |
5,476 |
5,097 |
4,684 |
5,099 |
4,811 |
5,102 |
4,939 |
19,909 |
19,990 |
Gold production (oz) |
93,370 |
91,641 |
83,128 |
90,386 |
81,873 |
92,041 |
90,028 |
348,399 |
370,000 |
Palladium production (oz) |
4,463 |
4.209 |
4,209 |
4.209 |
4,209 |
4.209 |
4,209 |
17,089 |
16,835 |
Cobalt production (klb) |
240 |
214 |
214 |
214 |
214 |
214 |
214 |
882 |
856 |
|
|
|
|
|
|||||
Silver sales (koz) |
4,067 |
4,344 |
3,967 |
4,346 |
4,079 |
4,993 |
4,829 |
16,942 |
17,667 |
Gold sales (oz) |
92,019 |
84,921 |
77,183 |
83,759 |
76,018 |
92,020 |
90,007 |
335,227 |
349,599 |
Palladium sales (oz) |
4,774 |
3.786 |
3,786 |
3.786 |
3,786 |
4.192 |
4,192 |
16,539 |
15,551 |
Cobalt sales (klb) |
309 |
214 |
214 |
214 |
214 |
214 |
214 |
951 |
856 |
|
|
|
|
||||||
Avg realised Ag price (US$/oz) |
23.77 |
24.96 |
27.97 |
24.96 |
28.37 |
24.96 |
28.37 |
27.17 |
24.61 |
Avg realised Au price (US$/oz) |
2,072 |
2,100 |
2,343 |
2,100 |
2,354 |
2,100 |
2,354 |
2,274 |
2,084 |
Avg realised Pd price (US$/oz) |
980 |
1,062 |
987 |
1,062 |
974 |
1,062 |
974 |
979 |
1,041 |
Avg realised Co price (US$/lb) |
15.49 |
12.95 |
13.01 |
12.95 |
12.57 |
12.95 |
12.57 |
13.62 |
12.98 |
|
|
|
|
|
|
|
|
||
Avg Ag cash cost (US$/oz) |
4.77 |
4.90 |
4.86 |
4.90 |
4.90 |
4.91 |
4.91 |
4.86 |
4.90 |
Avg Au cash cost (US$/oz) |
439 |
444 |
449 |
446 |
451 |
445 |
448 |
446 |
445 |
Avg Pd cash cost (US$/oz) |
182 |
191 |
178 |
191 |
175 |
191 |
175 |
178 |
187 |
Avg Co cash cost (US$/lb) |
2.96 |
2.33 |
2.34 |
2.33 |
2.26 |
2.33 |
2.26 |
2.51 |
2.34 |
|
|
|
|
|
|
|
|
||
Sales |
296,806 |
293,549 |
298,346 |
291,152 |
301,048 |
325,085 |
355,646 |
1,251,845 |
1,190,791 |
Cost of sales |
|
|
|
|
|
|
|
|
|
Cost of sales, excluding depletion |
61,555 |
60,255 |
55,097 |
59,855 |
55,364 |
66,815 |
65,288 |
237,304 |
246,868 |
Depletion |
63,676 |
61,516 |
57,284 |
60,086 |
56,627 |
67,830 |
67,037 |
244,624 |
251,017 |
Total cost of sales |
125,231 |
121,771 |
112,381 |
119,942 |
111,991 |
134,645 |
132,324 |
481,928 |
497,885 |
Earnings from operations |
171,575 |
171,778 |
185,965 |
171,210 |
189,057 |
190,440 |
223,321 |
769,917 |
692,905 |
Expenses and other income |
|
|
|
|
|
|
|
|
|
– General and administrative** |
13,315 |
17,951 |
19,068 |
17,951 |
15,533 |
17,951 |
15,533 |
63,449 |
70,093 |
– Foreign exchange (gain)/loss |
0 |
0 |
0 |
0 |
0 |
0 |
0 |
0 |
|
– Net interest paid/(received) |
1,442 |
1,378 |
1,378 |
1,378 |
1,378 |
1,378 |
1,378 |
5,575 |
5,510 |
– Other (income)/expense |
(6,840) |
(6,318) |
-3,188 |
(4,014) |
-1,099 |
(2,790) |
-68 |
-11,194 |
(19,592) |
Total expenses and other income |
7,917 |
13,011 |
17,258 |
15,315 |
15,811 |
16,539 |
16,842 |
57,829 |
56,011 |
Earnings before income taxes |
163,658 |
158,767 |
168,707 |
155,895 |
173,245 |
173,901 |
206,479 |
712,088 |
636,894 |
Income tax expense/(recovery) |
69 |
49,543 |
52,986 |
25,306 |
27,473 |
27,857 |
32,240 |
112,769 |
102,790 |
Marginal tax rate (%) |
0.0 |
31.2 |
31.4 |
16.2 |
15.9 |
16.0 |
15.6 |
15.8 |
16.1 |
Net earnings |
163,589 |
109,224 |
115,720 |
130,589 |
145,772 |
146,044 |
174,239 |
599,319 |
534,104 |
Average no. shares in issue (000s) |
453,094 |
453,069 |
453,094 |
453,069 |
453,094 |
453,069 |
453,094 |
453,094 |
453,069 |
Basic EPS (US$) |
0.361 |
0.241 |
0.255 |
0.288 |
0.322 |
0.322 |
0.385 |
1.323 |
1.179 |
Diluted EPS (US$) |
0.361 |
0.241 |
0.255 |
0.288 |
0.321 |
0.322 |
0.384 |
1.321 |
1.177 |
DPS (US$) |
0.155 |
0.155 |
0.155 |
0.155 |
0.155 |
0.155 |
0.155 |
0.620 |
0.620 |
Source: Wheaton Precious Metals, Edison Investment Research. Note: *Excluding impairments, impairment reversals and exceptional items (except where indicated). **Forecasts include stock-based compensation costs. Totals may not add up owing to rounding.
Our updated adjusted basic EPS forecast of US$1.323 per share for FY24 is nevertheless near to consensus, as shown below:
Exhibit 11: WPM FY24 consensus EPS forecasts (US$/share), by quarter
Q124 |
Q224e |
Q324e |
Q424e |
Sum Q1–Q424e |
FY24e |
|
Edison forecasts |
0.361 |
0.255 |
0.322 |
0.385 |
1.323 |
1.323 |
Mean consensus |
0.361 |
0.310 |
0.340 |
0.370 |
1.381 |
1.24 |
High consensus |
0.361 |
0.350 |
0.380 |
0.440 |
1.531 |
1.74 |
Low consensus |
0.361 |
0.240 |
0.290 |
0.290 |
1.181 |
0.91 |
Source: Refinitiv, Edison Investment Research. Note: As at 8 May 2024.
Valuation
Absolute
WPM is a multi-asset company that has shown a willingness and desire to buy streams in the past to maintain production and maximise shareholder returns. As a result, rather than our customary method of discounting maximum potential dividends over the life of operations back to FY24, in the case of WPM (as with Newmont and Endeavour), we discount forecast cash flows back over four years to the start of FY24 and then apply an ex-growth terminal multiple to forecast cash flows in that year (FY27 cf FY26 previously) based on the appropriate discount rate.
In this case, our estimate of WPM’s ‘terminal’ cash flow in FY27 is US$2.77/share (cf US$2.54/share in FY26 previously).
|
Exhibit 12: WPM operational cash flow and related valuation (US$/share), FY24–27 |
|
|
Source: Edison Investment Research. Note: Valuation line assumes cash flow per share growth rate of 4% pa post-FY26 in nominal terms, which equals the average US rate of CPI inflation since 1972 (ie 0% pa growth in real terms). |
Assuming 4% growth in nominal cash flows beyond FY26 (ie 0% growth in real cash flows) and applying a discount rate of 9% (being the expected long-term required nominal equity return), our ‘terminal’ valuation of the company at end-FY27 is US$57.89 per share (cf US$52.96/share in FY26 previously), or C$79.19 per share. However, it should be noted that this valuation is inherently conservative in that it assumes zero growth in (real) cash flows beyond FY27. This is inconsistent with the gold price, which has risen at a compound average annual growth rate of 7.4% per year from 1967 to 2023, a simple average annual growth rate of 9.3% per year (cf a compound average inflation rate over the same period of 4.0%) and a compound average real annual growth rate of 3.0% per year.
|
Exhibit 13: Gold price annual performance, 1968–2023 |
|
|
Source: Edison Investment Research (underlying data: US Bureau of Labor Statistics, Bloomberg, South African Chamber of Mines) |
It is also inconsistent with WPM’s longer-term historical performance, wherein operational cash flows have increased at a compound average annual growth rate of 19.6% pa for the 18 years between FY05 and FY23, while its operational cash flows per share have increased at a compound average annual growth rate of 13.2% pa.
If we instead assume that cash flows per share increase at a compound average annual growth rate of 7.4% (ie the average compound average annual growth rate in the gold price from 1967 to 2023 cf 4.0% above), then our ‘terminal’ valuation of Wheaton increases many times to US$190.48/share, or C$260.55/share and our current valuation to US$138.94/share, or C$190.06/share.
Stated alternatively, Wheaton’s current share price of C$76.39 appears to be discounting future compound annual average increases in cash flow per share of just 5.0% pa from FY27, which is only very fractionally higher than the long-term average rate of US inflation of 4.0% pa.
A summary of these valuations with respect to their cash flow growth rate assumptions is as follows:
Exhibit 14: WPM valuation with respect to long-term cash flow growth rate assumptions post-FY27
Long-term cash flow growth rate assumption (%) |
Comment |
WPM valuation (US$/share) |
WPM valuation (C$/share) |
4.0 |
Zero real growth rate; ie rate equals compound average US inflation rate, 1967–2023 |
45.02 |
61.58 |
5.0 |
Implied cash flow per share growth rate required to justify current share price |
55.85 |
76.39 |
7.4 |
Gold price compound average annual growth rate, 1967–2023 |
138.94 |
190.06 |
Source: Refinitiv, Edison Investment Research. Note: As at 8 May 2024.
Historical
Excluding FY04 (part-year), WPM’s shares have historically traded on an average P/E multiple of 30.8x current year basic underlying EPS, excluding impairments (cf 42.2x Edison and 43.5x Refinitiv consensus FY24e currently – see Exhibit 16).
|
Exhibit 15: WPM’s average historical current year P/E multiples, 2005–23 |
|
|
Source: average share price data Bloomberg, Edison Investment Research calculations |
Applying this 30.8x multiple to our EPS forecast of US$1.78 in FY27 (cf US$1.60 in FY26 previously) implies a potential value per share for WPM of US$54.75 or C$74.89 in that year.
Relative
From a relative perspective, WPM’s valuation compares as follows to its most prominent peers:
Exhibit 16: WPM comparative valuation versus a sample of operating and royalty/streaming companies
P/E (x) |
Yield (%) |
P/CF (x) |
|||||||
Year 1 |
Year 2 |
Year 3 |
Year 1 |
Year 2 |
Year 3 |
Year 1 |
Year 2 |
Year 3 |
|
Royalty companies |
|||||||||
Franco-Nevada |
38.2 |
32.5 |
32.5 |
1.1 |
1.1 |
1.2 |
27.5 |
23.5 |
23.8 |
Royal Gold |
28.7 |
22.6 |
21.3 |
1.3 |
1.3 |
1.4 |
18.2 |
14.7 |
13.5 |
Sandstorm Gold |
61.8 |
40.8 |
54.4 |
1.1 |
1.1 |
0.0 |
14.5 |
13.1 |
15.3 |
Osisko |
35.6 |
30.1 |
30.7 |
1.0 |
1.0 |
0.9 |
21.5 |
19.2 |
19.0 |
Average |
41.1 |
31.5 |
34.7 |
1.1 |
1.1 |
0.9 |
20.4 |
17.6 |
17.9 |
WPM (Edison forecasts) |
42.2 |
41.4 |
37.1 |
1.1 |
1.2 |
1.2 |
26.5 |
24.1 |
24.2 |
WPM (consensus) |
43.5 |
37.5 |
40.9 |
0.9 |
1.1 |
1.2 |
28.8 |
25.0 |
28.0 |
Source: Refinitiv, Edison Investment Research. Note: Peers and WPM (consensus) priced on 8 May 2024.
Of note are the relatively slow pace of earnings and cash flow increases implied by the market’s consensus multiples between years one and three (ie FY24 and FY26) when we anticipate that the company will have begun an aggressive upward trajectory in both GEOs produced, EPS and cash flows per share. This could be explained by the market anticipating either a slower ramp-up in production and/or that the ramp-up will be partially offset by lower metals prices. Also of note is the market’s lower forecast yields for WPM (especially in year one), which seems to imply that it believes that WPM will cut its dividend – a contingency that we would regard as highly unlikely, given its new, progressive dividend policy, except in extenuating circumstances (eg materially lower precious metals prices).
Financials: End-Q1 US$300.2m in net cash
As at 31 March, WPM had US$306.1m in cash on its balance sheet and no debt outstanding under its US$2bn revolving credit facility. As such (including a modest US$5.9m in lease liabilities), it had US$300.2m in net cash overall after generating US$219.4m in operating cash flow and investing US$463.5m (cf US$464.2m in Q423 but US$98.9m in Q323), after a high proportion of the contingent payments for FY24 were made in Q124 – in particular with respect to the Platreef project and, to a lesser extent, KZK.
Exhibit 17: WPM cash, net cash and operating cash flow, by quarter, Q420–Q124
(US$m) |
Q420 |
Q121 |
Q221 |
Q321 |
Q421 |
Q122 |
Q222 |
Q322 |
Q422 |
Q123 |
Q223 |
Q323 |
Q423 |
Q124 |
Cash/(debt) |
192.7 |
191.2 |
235.4 |
372.5 |
226.0 |
376.2 |
448.6 |
494.6 |
696.1 |
799.7 |
828.8 |
833.9 |
546.5 |
306.1 |
Net cash/(debt) |
6.0 |
187.7 |
232.1 |
369.4 |
223.2 |
373.5 |
446.2 |
492.5 |
694.1 |
797.9 |
822.3 |
827.7 |
540.3 |
300.2 |
Operating cash flow |
208.0 |
232.2 |
216.3 |
201.3 |
195.3 |
210.5 |
206.4 |
154.5 |
172.0 |
135.1 |
202.4 |
171.1 |
242.2 |
219.4 |
Source: Wheaton Precious Metals, Edison Investment Research.
In addition, WPM had long-term investments, in the form of equity share- and warrant-holdings, in listed companies in the sum of US$246.7m as at end-March (cf US$246.7m as at end-December and US$200.9m as at end-September), equivalent to US$0.54/share. Subsequent to the quarter’s end however, Wheaton disposed of its investment in Hecla for gross proceeds of US$177m.
For FY23, WPM generated US$750.8m from operating activities, before consuming US$646.6m in investing activities and paying out US$265.1m in forecast dividends. In FY24, we estimate that WPM will generate US$954.7m from operating activities (cf US$887.4m previously), before consuming US$917m in investing activities (cf US$890.6m previously) and paying out an increased US$280.9m in dividends under the influence of WPM’s new, progressive dividend policy. However, readers should note that the timing of precious metals purchase agreement payments is uncertain and, inasmuch as investments are advanced or delayed, it is possible that WPM could register either a larger or smaller net cash position on its balance sheet by the year end than that forecast. In any event however, all other things being equal, in the absence of any major new asset acquisitions, we do not expect WPM to need recourse to its debt facilities at any point in the foreseeable future.
Exhibit 18: Financial summary
$000s |
|
2020 |
2021 |
2022 |
2023 |
2024e |
2025e |
2026e |
|
Year end 31 December |
IFRS |
IFRS |
IFRS |
IFRS |
IFRS |
IFRS |
IFRS |
||
PROFIT & LOSS |
|||||||||
Revenue |
|
|
1,096,224 |
1,201,665 |
1,065,053 |
1,016,045 |
1,251,845 |
1,427,066 |
1,559,616 |
Cost of Sales |
(266,763) |
(287,947) |
(267,621) |
(228,171) |
(237,304) |
(313,272) |
(336,844) |
||
Gross Profit |
829,461 |
913,718 |
797,432 |
787,874 |
1,014,541 |
1,113,794 |
1,222,771 |
||
EBITDA |
|
|
763,763 |
852,733 |
735,245 |
719,704 |
951,092 |
1,050,345 |
1,159,323 |
Operating profit (before amort. and excepts.) |
|
|
519,874 |
597,940 |
503,293 |
505,270 |
706,468 |
710,475 |
791,241 |
Intangible Amortisation |
0 |
0 |
0 |
0 |
0 |
0 |
0 |
||
Exceptionals |
4,469 |
162,806 |
164,214 |
4,593 |
(452) |
0 |
0 |
||
Other |
387 |
190 |
7,680 |
33,658 |
11,194 |
0 |
0 |
||
Operating Profit |
524,730 |
760,936 |
675,187 |
543,521 |
717,211 |
710,475 |
791,241 |
||
Net Interest |
(16,715) |
(5,817) |
(5,586) |
(5,510) |
(5,575) |
535 |
978 |
||
Profit Before Tax (norm) |
|
|
503,546 |
592,313 |
505,387 |
533,418 |
712,088 |
711,010 |
792,218 |
Profit Before Tax (FRS 3) |
|
|
508,015 |
755,119 |
669,601 |
538,011 |
711,636 |
711,010 |
792,218 |
Tax |
(211) |
(234) |
(475) |
(367) |
(112,769) |
(99,419) |
(110,563) |
||
Profit After Tax (norm) |
503,335 |
592,079 |
504,912 |
533,051 |
599,319 |
611,591 |
681,656 |
||
Profit After Tax (FRS 3) |
507,804 |
754,885 |
669,126 |
537,644 |
598,867 |
611,591 |
681,656 |
||
Average Number of Shares Outstanding (m) |
448.7 |
450.1 |
451.6 |
452.8 |
453.1 |
453.1 |
453.1 |
||
EPS - normalised (c) |
|
|
112 |
132 |
112 |
118 |
132 |
135 |
150 |
EPS - normalised and fully diluted (c) |
|
|
112 |
131 |
112 |
118 |
132 |
135 |
150 |
EPS - (IFRS) (c) |
|
|
113 |
168 |
148 |
119 |
132 |
135 |
150 |
Dividend per share (c) |
42 |
57 |
60 |
60 |
62 |
68 |
69 |
||
Gross Margin (%) |
75.7 |
76.0 |
74.9 |
77.5 |
81.0 |
78.0 |
78.4 |
||
EBITDA Margin (%) |
69.7 |
71.0 |
69.0 |
70.8 |
76.0 |
73.6 |
74.3 |
||
Operating Margin (before GW and except.) (%) |
47.4 |
49.8 |
47.3 |
49.7 |
56.4 |
49.8 |
50.7 |
||
BALANCE SHEET |
|||||||||
Fixed Assets |
|
|
5,755,441 |
6,046,427 |
6,039,813 |
6,463,774 |
7,136,141 |
7,293,534 |
7,422,714 |
Intangible Assets |
5,521,632 |
5,940,538 |
5,753,111 |
6,169,534 |
6,841,254 |
6,998,647 |
7,127,827 |
||
Tangible Assets |
33,931 |
44,412 |
30,607 |
47,562 |
48,158 |
48,158 |
48,158 |
||
Investments |
199,878 |
61,477 |
256,095 |
246,678 |
246,729 |
246,729 |
246,729 |
||
Current Assets |
|
|
201,831 |
249,724 |
720,093 |
567,411 |
324,134 |
573,174 |
810,236 |
Stocks |
3,265 |
12,102 |
13,817 |
10,806 |
13,909 |
15,856 |
17,329 |
||
Debtors |
5,883 |
11,577 |
10,187 |
10,078 |
6,859 |
7,820 |
8,546 |
||
Cash |
192,683 |
226,045 |
696,089 |
546,527 |
303,365 |
549,498 |
784,361 |
||
Other |
0 |
0 |
0 |
0 |
0 |
0 |
0 |
||
Current Liabilities |
|
|
(31,169) |
(29,691) |
(30,717) |
(26,075) |
(23,995) |
(27,637) |
(28,767) |
Creditors |
(30,396) |
(28,878) |
(29,899) |
(25,471) |
(23,391) |
(27,033) |
(28,163) |
||
Short term borrowings |
(773) |
(813) |
(818) |
(604) |
(604) |
(604) |
(604) |
||
Long Term Liabilities |
|
|
(211,532) |
(16,343) |
(11,514) |
(19,594) |
(132,363) |
(231,782) |
(229,561) |
Long term borrowings |
(197,864) |
(2,060) |
(1,152) |
(5,625) |
(5,625) |
(5,625) |
(5,625) |
||
Other long term liabilities |
(13,668) |
(14,283) |
(10,362) |
(13,969) |
(126,738) |
(226,157) |
(223,936) |
||
Net Assets |
|
|
5,714,571 |
6,250,117 |
6,717,675 |
6,985,516 |
7,303,917 |
7,607,288 |
7,974,622 |
CASH FLOW |
|||||||||
Operating Cash Flow |
|
|
779,156 |
845,832 |
737,821 |
725,548 |
961,022 |
1,051,081 |
1,158,254 |
Net Interest |
(13,763) |
(187) |
6,227 |
33,770 |
(5,575) |
535 |
978 |
||
Tax |
49 |
(279) |
(171) |
(6,192) |
0 |
0 |
(112,784) |
||
Capex |
149,648 |
(404,437) |
(44,750) |
(648,963) |
(917,691) |
(497,263) |
(497,263) |
||
Acquisitions/disposals |
0 |
0 |
0 |
0 |
0 |
0 |
0 |
||
Financing |
22,396 |
7,992 |
10,171 |
12,934 |
0 |
0 |
0 |
||
Dividends |
(167,212) |
(218,052) |
(237,097) |
(265,109) |
(280,918) |
(308,220) |
(314,322) |
||
Net Cash Flow |
770,274 |
230,869 |
472,201 |
(148,012) |
(243,162) |
246,133 |
234,863 |
||
Opening net debt/(cash) |
|
|
774,766 |
5,954 |
(223,172) |
(694,119) |
(540,298) |
(297,136) |
(543,269) |
HP finance leases initiated |
0 |
0 |
0 |
0 |
0 |
0 |
0 |
||
Other |
(1,462) |
(1,743) |
(1,254) |
(5,809) |
0 |
0 |
(0) |
||
Closing net debt/(cash) |
|
|
5,954 |
(223,172) |
(694,119) |
(540,298) |
(297,136) |
(543,269) |
(778,132) |
Source: Company accounts, Edison Investment Research
|
|
Research: Industrials
Information Services Corporation’s (ISC’s) Q124 results highlight the strength of the underlying business, with topline and adjusted EBITDA growth of 15% and 34%, respectively, augmented by the sustained organic growth of the Services division and CPI fee adjustments. This progress was made less obvious at the statutory net income level by increases in interest costs and share-based compensation expenses of C$5.0m and C$5.8m, respectively. FY24 guidance has been reiterated, and we maintain our forecasts and valuation of C$40/share, implying 58% upside.